


Purpose: To assess the repeatability and validity of computerized distance visual acuity (VA) charts from Optonet Vision Unit (OVU) using a Continuing Professional Development (CPD) programme which recreates real-life scenario conditions. Methods: This is a multicentric study with 481 participants aged from 7 to 88 years. Distance VA was assessed by OVU with five different computerized VA charts, according to Bailey and Lovie's principles (Sloan, British, Numbers, Landolt C and Broken Rings). Two consecutive measurements (TCM) and two measurements (Test re-test (TRT)) were evaluated (95% limits of agreement (LOA), ICC 95%). Results: In all VA charts, the mean difference between measurements was near 0.00 logMAR and there was an excellent correlation between TCM (ICC ≥0.968, 95% LOA of ±0.071 logMAR) and TRT (ICC ≥0.957, 95% LOA of ±0.09 logMAR). Pairwise comparison between VA charts showed a statistical difference between tests, with a minimum mean difference of 0.003 logMAR (95% CI, -0.010 to 0.004) between Landolt C and Broken rings; and a maximum mean difference of 0.071 logMAR between Sloan letters and Numbers (95% CI, -0.075 to -0.067). Conclusions: The reliability and reproducibility of OVU software for distance VA measurement is promising for eye care practitioner consultation highlighting the possibility of expanding the use of OVU for both clinic and research. The use of online CPD programs is useful to improve statistical and research understanding is an innovative, hands-on approach that helps in bridging the gap between clinical practice and research.
Visual function tests assess the patient's ability to perceive and integrate light stimuli into visual information,1 such as visual acuity (VA), contrast sensitivity, motion, colour perception, or peripheral vision tests.2 VA is the most used visual function test and is defined as “the ability to discriminate two stimuli separated in space at high contrast relative to background and is represented as the reciprocal of the minimal angle of resolution (MAR) at a given distance”.2
This measurement is very useful to accurately obtain the maximum visual resolution capacity, to adapt an optical correction if necessary or to evaluate the progression of ophthalmic pathologies over time, as in age-related macular degeneration (AMD), cataract, or amblyopia.3
VA is clinically measured by eye charts or optotypes which are presented to patients and are designed according to standard international guidelines, the most common being the one promulgated by the Committee on Vision of the National Academy of Sciences National Research Council (NAS-NRC),4,5 widely followed in the USA and Europe.
Although the standardized printed VA test chart for the Early Treatment of Diabetic Retinopathy Study (ETDRS) is still the gold-standard test, widely accepted for logMAR VA measurement and used in most of the clinical studies,6,7 computerised clinical VA measuring systems have emerged in recent years due to the growth of technology and digital tools, including Snellen, directional, figure or shape charts.3,8 Computerized VA charts could potentially offer versatility and precision, allowing customised settings, accurate measurements and continuous updates, improving the clinical assessment of VA. However, as the consequences of incorrect recording of visual function and its use to inform clinical management are serious, digital VA must be validated before it is adopted as part of clinical practice.9
The requirements that these computerized VA charts must accomplish are also documented in the NAS-NRC guidelines and include distance of use, lighting, luminance, size, angle, contrast, calibration, accuracy, repeatability and reliability. It is also difficult to find scientific evidence of the comparison of commercially available VA charts, so the reliability of clinical outcomes with the use of different types of computerized eye charts may be questioned.
Optonet Vision Unit (OVU) is a digital web-based eye care software developed at Optonet Ltd© that can be accessed via operating systems such as Android, iOS and Fire OS or through its own app in the Apple App Store, Google Play or Amazon Appstore,10 registered with the British Medicines and Healthcare products Regulatory Agency under reference number 5943.10 The OVU tool offers visual function measurement tests, including different AV charts oriented for all types of patients. This tool has already been used in a previous study to characterize distance VA in children (3–12 years old) using three types of OVU charts (Sloan and Symmetrical letters and Landolt C) with the main objective of obtaining normal values in percentile curves in this paediatric population and showing a promising repeatability.11 However, this software has more VA charts that are currently useful in ophthalmic consultations, but their reliability and repeatability has not been demonstrated.
The main objective of this study is to conduct a multicenter study across 28 optometric clinics throughout Spain, using a Continuing Professional Development (CPD) program to assess the repeatability of the OVU logMAR VA digital charts. CPD frameworks are increasingly used as research platforms in healthcare, as they allow for the integration of real-world clinical scenarios, active participation of professionals, and systematic data collection during educational activities.12–15 This approach aligns with current trends in health professions education, which emphasize practice-based learning and data-informed reflection. In countries such as the United Kingdom (UK)16 or United States (US),17 the use of CPD has expanded to several health professionals to generate practice-based evidence across various health disciplines. Thus, the use of a CPD-based framework to test the repeatability of VA measurements in clinical settings is a useful tool and offers research value and may support wider adoption of OVU charts in routine optometric care.
MethodsThis is a cross-sectional study carried out at the University of Murcia (Spain) in collaboration with 28 optometrists from 28 different clinics distributed across Spain, recruited from a CPD program via a Moodle online campus during 2022. The research was approved by the Ethics Committee of the University of Murcia and carried out in accordance with the principles of the Declaration of Helsinki.
SubjectsThe subjects of the study were patients attending their optometric clinics on a regular basis and participants recruited at the University of Murcia who agreed to participate on a voluntary and consensual basis.
The inclusion criteria were participants attending optometric services and willing to participate; able to communicate and provide consent; wearing their optical correction (participants who wore contact lenses were asked to remove them at least 24 h before the examination to avoid VA fluctuations); VA better or equal to 0.8 logMAR (20/125 Snellen equivalent); and with or without pathological conditions.
The exclusion criteria were VA worse than 0.8 logMAR, to guarantee that all computer screens display 5 letters in each VA level at 4 m distance.
OVU chart designDistance computerized OVU charts were designed according to Bailey and Lovie´s principles, i.e. ETDRS formatting18 collected in NAS-NRC5: backlit charts of contrast equal to 1 (following the NAS-NRC recommendation of at least 0.85 contrast level). All VA charts were displayed on a digital screen showing the set of logarithmic scale lines of 5 letters each line to simulate standard ETDRS graphs.2,6 OVU is classified as a Class I device with CE marking. This certification ensures that the tool complies with internationally accepted quality and performance standards and confirms compliance with applicable regulatory requirements and international standards, including ISO 8596 (which specifies requirements for the design, dimensions, contrast and presentation of optotypes used in VA test) and ISO 5725 (which establishes the principles for repeatability and reproducibility studies).
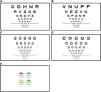
Following this formatting and the NAS-NRC regulation, five VA charts with different symbol types were used: Sloan letters with 10 letters (5 × 5 format) from ETDRS chart (C, D, H, K, N, O, R, S, V, Z) with a 10 % random hit rate19 (Fig. 1A); British letters (5 × 4 format) with 10 letter options (D, E, F, H, N, P, R, U, V, Z) with a 10 % random hit rate20 (Fig. 1B); Numbers (rounded) with 4 number options (5 ,6, 8, 9)21 with a 25 % random hit rate (Fig. 1C); Landolt C as a directional chart with 5 orientations for the aperture (Fig. 1D); and the Broken Ring chart that uses Landolt rings with contour interaction (inspired on the Broken Wheel test)22 (Fig. 1E). To maintain the same criteria as the previous tests, each size range is made up of five consecutive presentations (0.02 log unit per presentation) (Fig. 1E).
Procedure of VA measurement
To ensure methodological consistency across centers, participating optometrists received detailed instructions and were required to carry out a pilot assessment on three individuals prior to data collection, in order to familiarise themselves with the examination protocol. The data obtained during this pilot phase were not included for statistical analysis.
Following these preliminary measures, each participant underwent a routine complete eye examination. For data compilation of the study, the instructions were: VA was taken under appropriate ambient light (photopic conditions in each consultation, to perform a real-world measurement in 28 different centres), with the monitor set at maximum brightness. Clinicians provided their own monitors, all of which could display a contrast above 85 % and a luminance above 160 cd/m2, thus meeting international standard.23 Viewing distance was set at 4 m for all patients24 and was always checked before starting the examination. Optometrists were asked to pre-verify the actual viewing distance and calibration of the OVU VA charts (size and contrast), using an Optonet-developed checking system implemented in the OVU application which allows the examiner to confirm the distance.
The OVU software allows the examiner to indicate how many letters the participant has solved for each row (1–5 letters per row). For the Sloan and British charts, the criterion for stopping the test was to make 4 or 5 errors in a line. In contrast, for the Landolt C, Numbers and Broken Glasses charts, the criterion was to stop the test after 3 or more errors in a line due to their higher random hit rate, following the previously described criteria,25 or when the participant reaches the maximum VA presented (−0.30 logMAR (20/10 Snellen equivalent)). To enhance the precision of the VA measurement, two consecutive measurements (TCM) were taken, and the mean and standard deviation were calculated by the Optonet software. For the second measurement, the program displayed letters/symbols at the VA level where the first measurement began but with a random configuration to prevent memorization. To assess repeatability, a second VA measurement, test-retest (TRT), was performed with each VA chart one week later (average of 6.4 ± 3.8 days) using the same consecutive technique. This process was followed for all five VA charts displayed in random order.
Statistical analysisData from both eyes were analyzed using the statistical Package for Social Sciences (SPSS) software version 24 (International Business Machine Corp. IBM, Chicago, IL, USA). Variability between VA measurements of the five different VA charts was carried out with a One-Way repeated measures analysis of variance (ANOVA). Bonferroni adjustment was used for multiple comparison and significance was set when p < 0.05.
Measurement repeatability was assessed for TCM and for TRT by Bland-Altman plots (Bland & Altman, 1986), looking specifically at 95 % limits of agreement (LOA) and mean bias, with intraclass correlation coefficients (ICC, single measure) and repeatability coefficients. The average variability of repeated measurements within the same subject (SD(w)) and the coefficient of repeatability (CR =SD(w)*1.96*√2) with the 95 % confidence interval for measurement differences was also assessed. Given a value of 0.02 per letter, the intertest variability in terms of the number of letters can be inferred.
Last, comparisons between age groups (0–20, 21–40, 41–60, and > 60 years old), optical correction (emmetropic, myopic or hyperopic) and examiners were performed based on the TRT results of each VA chart using ANOVA statistical tests, and significance was established when p < 0.05.
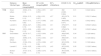
ResultsDemographic characteristicsA total number of 481 subjects aged between 7 and 88 years (mean age 35.3 ± 16.9 years) participated in the study, of whom 280 were females (58.2 %) and 201 males (41.8 %) (Table 1).
Demographic characteristics of the participants (N = 481).
The study included monocular data from both eyes of all participants, resulting in a sample of 962 eyes analyzed with a mean Spherical Equivalent (SE) of −0.79 ± 2.14 D (range −5.8 to 5.0 D). Most participants wore glasses (421, 87.5 %), 45.4 % of eyes wore myopic correction (N = 437, range −0.50 to −5.8 D), 24.6 % of eyes wore hypermetropic correction (N = 237, range 0.50 to 5.0 D) and 29.9 % of eyes were emmetropic (N = 287, range +0.25 to −0.25 D).
In terms of ocular health, 875 eyes (90.9 %) did not report any abnormal ocular condition, and the rest (87, 9.1 %) presented pathologies such as amblyopia (31, 3.2 %), early signs of cataract (46, 4.8 %), glaucoma (4, 0.4 %), or diabetic retinopathy (6, 0.6 %) (Table 1).
Distance VA measurementThe mean ± standard deviation (SD) of the distance VA of the participants in each of the five charts analyzed in Table 2. VA values ranged from −0.3 to 0.8 logMAR and the VA chart with the highest VA results was the Sloan letter (−0.0582 ± 0.1375 logMAR) while the lowest VA was obtained with the Number chart (0.0126 ± 0.1293 logMAR).
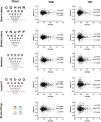
Repeatability of VA measurementsTo assess the repeatability of the two consecutive measurements (TCM) recorded by the software for each VA acquisition of each digital chart, the mean difference (bias), the 95 % limits of agreement (LOA), the repeatability coefficient (±letters), the within subject standard deviation SD(w), the coefficient of repeatability CR and the interclass correlation coefficient (ICC) were analyzed (Table 3) and represented graphically in Bland Altman plots (Fig. 2).
Mean bias and limits of agreement for each TCM and TRT, with 95 % CI. LOA: limits of agreement; TCM: two consecutive measurements; TRT: test re-test; logMAR: Logarithm of the Minimum Angle of Resolution; VA: visual acuity; SD₍w₎: within-subject standard deviation; CR: coefficient of repeatability.

Bland Altman plots of distance VA measurements comparing TCM (left), and TRT (right). The average and the difference between the two measurements are represented in the x- and y-axis, respectively. The red dashed line represents the bias, and the blue dashed line represents the 95 % CI of difference in VA. TCM: two consecutive measurements; TRT: test re-test; M1: measurement 1; M2: measurement 2; UL: Upper limit; LL: Lower limit.
The comparison between TCM showed a mean difference very close to 0.0, ranged from 0.0004 LogMAR for the Landolt C chart to 0.0034 logMAR for the British letter chart. An excellent agreement of TCM was observed for all digital VA charts examined (ICC (95 % CI), over 0.968 in all cases). The best results were obtained for the Sloan letters with an ICC (95 % CI) of 0.982 (0.980–0.984), a SD(w) of 0.01, CR of 0.04 and a repeatability coefficient (95 % LOA) of ±0.054 (±2.7 letters difference) and the worst result with the Numbers chart, with an ICC (95 % CI) of 0.968 (0.963–0.971), SD(w) of 0.01, CR of 0.04 and a repeatability coefficient of ±0.071 (±3.5 letters) (Table 3, Fig. 2). Thus, all results indicated an excellent repeatability between TCM with no clinical difference.
The repeatability of TRT VA measurements was also assessed by comparing two measurements 1 week apart. The results also showed a mean difference close to 0.0, ranging from 0.0074 logMAR for the Sloan letter chart to 0.0108 logMAR for the Numbers chart. Concerning agreement between TRT measures, excellent results were also recorded, with an ICC (95 % CI) for all VA charts above 0.957. In this case, the best results were again obtained for the Sloan letters with an ICC (95 % CI) of 0.969 (0.965, 0.973), and a repeatability coefficient (95 % LOA) of ±0.072 (±3.6 letter difference), a SD(w) of 0.04 and a CR of 0.04. The lowest for the Landolt C chart, with an ICC (95 % CI) of 0.957 (0.952, 0.962), a repeatability coefficient of ±0.090 (±4.5 letters), a SD(w) of 0.05 and a CR of 0.12 (Table 3, Fig. 2).
Influence of optical correction, age ranges and examiners on TRT resultsThe optical correction of the participants (no correction, myopic or hyperopic correction) was not associated with the results of TRT in none of the VA charts (Sloan (F2,959=3.384, p = 0.066), British (F2,959=1.490, p = 0.700), Symmetrical (F2,959=3.461, p = 0.063), Landolt (F2,959=0.849, p = 0.375), Broken Ring (F2,959=0.126, p = 0.723) and Numbers (F2,959=0.446, p = 0.504) (Sup. Table1).
The TRT comparison between different age ranges revealed no statistically significant differences for the British (F3=1.290; p = 0.276), Symmetrical (F3=1.456; p = 0.225), Landolt (F3=1.827; p = 0.140), Broken Ring (F3=2.144; p = 0.093) and Numbers (F3=0.791; p = 0.499) VA charts. Only a significant difference was obtained with Sloan VA chart (F3=2.831; p = 0.037). However, the mean difference (±SD) ranged from 0.0001±0.0276 logMAR in the 21–40 years-old group to 0.0059±0.0322 logMAR in participants over 60 years, indicating that the observed difference was clinically negligible, corresponding to <1 letter (Sup. Table 2).
The TRT results for each VA chart showed no statistically significant differences between examiners for the Sloan (F25=0.559; p = 0.961), British (F F25=1.045; p = 0.403), Symmetrical (F25=1.408; p = 0.089), Landolt (F25=1.119; p = 0.312) and Numbers (F25=1.436; p = 0.077) VA charts, except for Broken Ring VA chart that was significantly different (F25=1.581; p = 0.035).
Pairwise comparison between VA chartsStatistical analysis of the comparison between VA charts showed a violation of the sphericity assumption. Greenhouse-Geisser test was carried out with a value of F (3.265, 3007.229) = 482.749, p < 0.001, and an effect size of 34.4 % of variance (partial eta squared). These results indicated that there were differences between the overall VA means (p < 0.001). Therefore, a pairwise comparison was carried out using Bonferroni adjustment and a significant difference between the total means was obtained with all VA chart types (p < 0.001), except for Landolt C and Broken Ring (mean difference of 0.003, 95 % CI, −0.01 to 0.004, p = 1000) (Table 4). However, the maximum mean difference obtained was −0.071 between Sloan letters and Numbers (95 % CI, −0.075 to −0.067).
Pairwise comparisons between each of the five VA charts analyzed based on estimated marginal means. Bonferroni adjustment was used for multiple comparisons and significance was set when p < 0.05.
The results of this study demonstrate the repeatability of five digital VA charts under real-world conditions, with a minimal bias (lower than 0.0108 logMAR in all VA charts) and an excellent correlation between TCM (ICC higher than 0.968, 95 % LOA of ±0.071 (±3.5 letter difference)) and between TRT (two measurements at different time points) (ICC higher than 0.957, 95 % LOA of ±0.09 (±4.5 letter difference)). Therefore, VA charts from OVU are, to date, one of the most accurate and reliable digital VA charts for distance VA measurement.26,27 Their performance has been shown to be clinically consistent regardless of the examiner at the optometric centre, or other variables such as age range or type of ametropia correction. This reinforces the robustness of the digital charts across different clinical profiles and further supports their usefulness in routine optometric care, where patient characteristics can vary widely.
Furthermore, to the best of our knowledge, this is the first study to examine the repeatability of VA charts through a multicentre design using CPD. Previous studies in optometry have applied CPD programmes to investigate subjective refraction methods and prescription used in the UK,14 and to study the knowledge of Australian optometrists about ocular stem cell therapies.13 These two recent publications together with our findings, support the use of CPD as an innovative multicentric data collection method that facilitates the generation of robust, real-world evidence. This strategy also aims to converge clinical and research activities, reinforcing the connection between routine clinical practice and scientific research in order to improve the clinical relevance and efficiency of research, while promoting wider collaborative studies and advancing methodological standards in future clinical research in optometry.
Despite a global consensus on the methodology, units of measurement, and clinical significance of VA assessment, logarithmic optotypes and the logMAR annotation system are not yet universally adopted in clinical practice due to implementation complexity, costs, and unfamiliarity compared to Snellen or decimal systems. Consequently, the ETDRS printed charts remains the gold standard for VA testing worldwide.28
The reliability and repeatability of both printed and digital AV charts have been the subject of several studies. In the case of printed VA charts, the limits of agreement (LOA) for repeatability coefficients range from 0.07 to 0.2 logMAR,28–35 with the best results reported with differences of ±0.07 (±3.5 letters),29,30 ± 0.08 (±4 letters),31 ± 0.08 (±4 letters)31 and ±0.09 (±4.5 letters).32 Thus, our data, based on a large number of participants, yield robust TRT repeatability results that are similar or even better than those reported in previous studies.28–33,35
For digital VA charts, our results using UVO showed a high repeatability of TRT for the five VA tests analyzed, with a range of mean differences very close to 0.00 and an agreement of the measurements obtained with very good LOA repeatability coefficient (minimum differences of ±0.072 (±3.6 letters) for Sloan letters and maximum differences of ±0.09 (±4.5 letters) for Landolt C and Broken Rings). These robust results for the five tests evaluated may be since the system records (TCM) for each VA measurement. In this respect, in this work we have tested the repeatability of these TCM, obtaining very reliable results (ranging from ±0.054 (±2.7 letters) for Sloan and British charts to ±0.071 (±3.5) for Numbers chart), which therefore reduces the learning effect that the participants may experience due to the randomness of the letters/symbols.
Compared to other digital applications, our results show slightly lower TRT values than those provided by the K-VA test application, which shows a repeatability coefficient of ± 0.039, inferring a deviation of ±1.9 letters26; and similar to previous studies with a 95 % LOA of ±0.09 logMAR using the EyeChart App36 and ±0.08 log using Landolt C test from VisionApp.8
However, other digital applications validate their measurements based on the mean difference between measurements, not on the LOA data to calculate the repeatability coefficient, which gives a better assessment of the agreement between measurements. In this respect, OVU shows better values than those provided by Bellsmith et al. (2022) which shows a 95 % LOA of ±0.38 (±19 letters) for the mobile phone application37 and ± 0.40 (±20 letters) for the website test37; or the Peek palpation to assess VA in near vision, with ± 0.188–0.205 (9–10 letters),38 or compared to the printed ETDRS test with ±0.361 (18 letters).39
Then, which VA chart in the OVU software is more appropriate for clinical distance VA measurements? Regarding the VA charts with letters, the results show higher VA values compared to numbers or directional symbols (Table 2). However, pairwise comparison shows a statistically significance between them, with the VA obtained with the Sloan letter chart achieving the highest value. This difference may be due to the letter design (5 × 5 size for Sloan letters and 4 × 5 size for the British ones).
The fact that letter VA charts require a certain baseline linguistic competence40 makes the number and directional VA charts needed in clinical consultation to broaden the spectrum of patients for whom a reliable VA measurement can be taken. In this case, the difference between the letter charts and the directional charts are larger and again statistically significant (p < 0.001; mean difference ranges from −0.025 ± 0.002 (95 % CI, −0.030 to −0.042) for British vs. Landolt C to −0.047 ± 0.003 (95 % CI, −0.055 to −0.040) for Sloan vs. Broken Ring) (Table 4) which, due to the large sample size used in this study (N = 962 eyes), is also not clinically relevant.
The directional charts with a random hit ratio of 20 % (Landolt C and Broken Ring), designed for uncooperative patients or those lacking verbal competence, showed similar response accuracy to the previously described charts (Tables 2 and 4) and to other published data.11 The study by Navas-Navia et al. reported normative values of distance VA in children using Sloan and Symmetrical letters, and Landolt C charts from OVU describing percentiles of monocular and binocular VA from 3 to 12 years of age, indicating also the feasibility of OVU for VA measurement in all ages.11
Finally, the pairwise comparison study showed that the OVU VA values collected with the Number chart were significantly worse than that obtained with all other charts (maximum mean difference between Number chart and the Sloan chart (−0.071 ± 0.001 logMAR (95 % CI, −0.075 to −0.067)) (Table 4). This difference may be clinically relevant, as it represents almost a line of variation. It should be considered when interpreting results in clinical settings, especially when monitoring changes or making decisions based on small VA. These numerical charts are not very common in clinical practice, although are usually recommended for assessing VA in patients with verbal awareness but with letter recognition difficulties.
One limitation of these previous studies that may have affected the standardization of computerized VA testing to date is the inclusion of only one8,39 or few chart types,11 failing to compile a battery of validated VA charts for all kind of requirements.3 One limitation of this study is the absence of a direct comparison with the gold-standard ETDRS chart. As a result, the external validity of the VA measurement obtained with this digital application remains unknown. However, one of the strengths of this study is the inclusion of five representative types of distance VA charts (letters, numbers and directional symbols) from the same computerized tool, allowing clinicians and researchers to choose which VA chart is more appropriate for each patient and being able to compare the results, significantly enhancing clinical applicability. In addition, the collection of results through a CPD framework facilitated the participation of practising optometrists from a variety of real-world clinical settings. This approach reinforces the consistency of the results and enhances the applicability of these digital tests in everyday clinical practice.
The advantages of using computerized VA charts include providing controlled measurements3 and avoiding the disadvantages associated with the deterioration of traditional ETDRS charts over time, such as changing contrast levels that can lead to underestimations of VA.41 Additionally, symbol randomization prevents patient learning during measurements and facilitates updates of VA tests for different patient types.42 Digital systems, as OVU system offer high image quality, achieved through 4 K displays, enhanced brightness, and uniform contrast.43 These systems are also more cost-effective, enable symbol randomization to prevent memorization, and can be calibrated for various distances and contrast levels.
Finally in this study, the sample of participants was large and recruited from twenty-eight different clinical centres (n = 481 participants). Only VA worse than 0.8 logMAR was an exclusion criterion because of the difficulty of performing VA testing in these patients.41
Of the remaining participants, few had pathological conditions that resulted in low VA with their optical correction (Table 1), and the mean average of VA was not significantly lower compared to non-pathological eyes (0.1205 ± 0.2156 logMAR vs. −0.0815 ± 0.1031 logMAR, respectively). We have not found any difference in the repeatability of VA measurement between participants with lower or higher VA, indicating that the reliability of OVU is also precise for the lower VA analyzed. Nevertheless, the exclusion of participants with VA worse than 0.8 logMAR may limit the generalisability of the findings in terms of standardisation. As the current results apply only to individuals with relatively good visual acuity, further studies are needed to confirm the repeatability of VA measurements in populations with visual impairment or advanced stages of retinal diseases.
In summary, our results highlight the potential for expanding the use of the OVU system for VA monitoring in patients with ocular pathology and for clinical studies. In addition, leveraging online CPD programmes12 to foster community-based collaborative research can improve statistical and research understanding. This innovative and practical approach helps bridge the gap between clinical practice and research.
Statements and declarationsAuthor contributionsCG-R, JAL-L, DG-A, JD-P, and FJV-S contributed to the study conception and design. Material preparation, data collection and analysis were performed by CG-R, JAL-L, DG-A, JD-P, and FJV-S. Statistical analysis was carried out by CG-R, FJV-S and JL-L. The first draft of the manuscript was written by CG-R and FJV-S, and all authors commented on previous versions of the manuscript. All authors read and approved the final manuscript.
Ethics approvalThe research was approved by the Ethics Committee of the University of Murcia (No. 416D/2022) and carried out in accordance with the principles of the Declaration of Helsinki.
Commercial relationships disclosuresThis study was supported by Optonet®. The funders were not involved in the preparation of the article (writing or analysis) or in the decision to submit it for publication.
The authors thank the optometrists who enrolled the CPD programme and participated in the data collection.


