


To assess eye movements during reading in individuals with central vision loss using eye-tracking technology and an ad-hoc calibration method.
Materials and methodsThis pilot case control study included 17 participants (61.7 ± 8.8 years), 12 women and 5 men) and 17 controls, matched for age and sex. Two ad hoc computer-based tests were administered to analyze eye movements during a single-letter reading task and continuous reading task, measured using a 60 Hz eye-tracking device.
ResultsIndividuals with central vision loss showed differences from the control group, with an increase in the number of fixations, saccadic movements, and regressions, whereas the amplitude and speed of saccades were lower. This resulted in longer reading times in the study group.
ConclusionThe results revealed lower performance in eye movements skills during reading tasks in patients with central vision loss. Eye-tracking devices allow the objective binocular assessment of eye movements during reading tasks. Our ad-hoc calibration method ensured minimal data loss and high validity, enhancing the reliability of the assessments. This information can be used to develop optimal and personalized functional and visual rehabilitation programs.
Central vision loss (CVL) is one of the main causes of visual impairment in developed countries, affecting mainly middle-aged and older individuals due to conditions such as age-related macular degeneration (AMD). This condition mainly affects tasks that require near vision, such as reading,1 a fundamental activity in daily life that significantly affects the autonomy and quality of life of affected individuals.2
It is estimated that between 60% and 86% of patients attending vision rehabilitation services have reading difficulties,3–5 making reading one of the main objectives of these services and one of the most demanding tasks for this population group.6
Reading is a complex process requiring precise coordination between visual processing and eye movements. Fixation, saccadic movements, regression, and visual search skills are key components of the reading process, and a disturbance in central vision can affect the coordination and planning of eye movements.7
Generally, the assessment of reading in individuals with low vision is performed using psychometric tests, which consist of reading single letters or continuous texts. The most common tests were the Radner Vissum, MnRead, Colenbrander, and IReST. Studies using these tests in individuals with central vision loss have found lower reading speed performance in this population, mainly in those who experience binocular inhibition.6,8–10
While these tests are widely used and provide information on fluency and reading speed, they generally do not allow for the objective handling of other parameters, such as oculomotor metrics, nor do they provide a detailed understanding of eye movements during reading.
Previous studies have found that in patients with central vision loss, there is a clear association between reading speed and oculomotor parameters,11 and that a greater number of eye movements are necessary to localize visual stimuli.12 Consequently, compensatory oculomotor strategies are often developed to adapt to the vision loss.13
In a previous study, we designed specific tasks to assess essential eye movements skills required for reading, including fixations, saccades, and visual search skills. The results showed that individuals with central vision loss had lower yields in these areas, highlighting the importance of including these skills in visual rehabilitation training.14
In recent years, the importance of oculomotor training in visual rehabilitation programs has been highlighted, along with strategies for selecting optimal reading materials and assessing eccentric vision.1 Nevertheless, rehabilitation professionals face significant barriers, such as limited access to devices that assess eye movements objectively and binocularly due to high costs and the need for specialized training.15
Traditional eye movements assessment techniques, such as microperimetry or scanning laser ophthalmoscopy, are considered the gold standard methods, although the results they provide are mainly monocular, and the metrics they offer are limited. Currently, there is a lack of uniformity in the application of protocols to assess eye movements during reading, as well as a clear difficulty in obtaining binocular information on eye movements in real tasks.
Within this framework, eye-tracking technology has emerged, utilizing devices equipped with cameras or infrared sensors to track the gaze position. These advanced tools allow precise binocular recording and analysis of eye movement patterns, enabling the assessment of visual behavior across various tasks.11,16
Although there have been studies describing some aspects of eye movements in simulations of central vision loss using devices incorporating eye tracking, the use of eye tracking technology as a complementary tool to existing clinical tests that assess aspects of the functional use of vision has not been widely investigated. However, it has been shown to be a useful discipline for obtaining objective information.
This study aimed to assess eye movements during reading tasks in individuals with central vision loss using eye-tracking technology and applying an ad-hoc calibration method and a simple protocol for reading single letters and continuous text.
Our results support the implementation of eye-tracking technology in vision rehabilitation services to improve the monitoring and assessment of this type of patient.
Materials and methodsThis pilot case-control study was conducted at the Faculty of Optics and Optometry of Complutense University of Madrid, Spain.
Individuals with central vision loss were recruited by the Macula-Retina Association, a patient association with representation throughout Spain. The inclusion criteria were as follows: age > 18 years, diagnosis of ocular pathology causing bilateral central vision loss, a visual acuity between 0.5 and 1.3 LogMAR, and the inclusion criterion required that participants had not received treatment for any ophthalmologic pathology within the three months preceding enrollment in the study and that their condition remained stable with respect to visual acuity levels. For both groups the exclusion criteria were presence of another ocular pathology affecting peripheral vision, recent surgery, cognitive impairment, or general difficulty in performing the tests. The control group was match for age and sex.
Initial assessment of patientsInitially, a total of 34 individuals completed a form showing interest. Following an initial screening through informal interviews, 13 individuals were excluded based on the following criteria: loss of peripheral vision (n = 3), inability to travel to the Faculty of Optics and Optometry (n = 6), residence outside of Spain (n = 1), and visual acuity less than 0.5 LogMAR (n = 3). The remaining 21 participants were then invited to attend the evaluation and application stages of the study
Each participant was required to provide the researcher with their relevant medical history. Visual acuity and refraction were assessed in each patient.
Eye-tracking device and settingsThe Minimal Reporting Guidelines for Eye-tracking Research were followed,17 to achieve construct validity. The reading paradigm of the eye-tracking methodology was chosen to characterize eye movements during reading in individuals with specific clinical conditions.18
The stimuli were presented on a 23-inch external display using a screen-based Tobii Pro Lab Edition.19 A Tobii X2-60 (60 Hz) device (Tobii AB, Sweden) with a Full HD or 1080p was used. This eye-tracker is able to record with a precision of 0.4° and an accuracy of 0.34° under good light and temperature conditions. All stimuli were presented in white (RGB 240 240 240) on a black background (RGB 25 25 25) to ensure a contrast greater than 70% according to Weber's contrast measurement formula.

Where Ls is the stimulus luminance and Lb is the background luminance. In addition, because the tests in the study were applied to a computer, the Contrast Finder application (https://app. contrast-finder. org/lang=es) was used, which was designed to evaluate the contrast between two colors and to determine if it complied with the Accessibility Guidelines for Digital Content (WCAG 2.2.)20 indicating that the contrast between the chosen colors was valid and did not require any changes.
Calibration of eye-tracking deviceThe normal calibration consists of a single small dot that moves rapidly at different positions on the screen and the person must follow it with his or her gaze. Owing to the fixation difficulties faced by individuals with central vision loss, an ad hoc calibration strategy was designed. There is evidence that geometric shapes facilitate calibration by generating fewer microsaccadic intrusions and less dispersion of fixations.21
A stimulus consisting of a flashing black circle with two diagonal lines intersecting in the center and a white circle in the center of the entire stimulus was created (Fig. 1a). This configuration is similar to the adapted Amsler grid and was considered appropriate, as it is familiar to patients with vision loss and meets the characteristics recommended by previous studies.21

A resizing format was used, in which the flashing circle initially covered the entire screen for 5 s. Each person was asked to follow the diagonal lines to try to find the center of the circle, allowing sufficient time for the subject to locate the center. The dot was then moved to one of nine calibration positions, reaching a minimum size of 6° before changing position. At this point, the dot was returned to the center to facilitate fixation. Calibration using nine stimuli was considered appropriate to ensure that the apparatus would fit the eyes of an individual.18
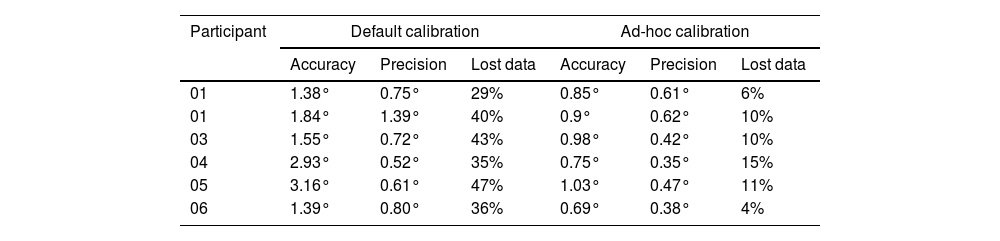
Prior to the eye-tracking tests, a pilot calibration test was conducted on six individuals with central vision loss. First, the default calibration of the program was performed, followed by the calibration adapted for this study. Table 1 shows a comparison of the results obtained in both tests, showing that in the adapted test the accuracy (≤1°) and precision (≤0.8) improved and the percentage of lost data also decreased, being within the range of 0%-20% which is accepted in eye-tracking studies.22
Results obtained in the default calibration and in the adapted calibration.
The single-letter test was carried out with the aim of determining oculomotor behavior when only five separate letters on the same line were required to be identified, which is similar to the traditional optotypes used to measure visual acuity, although in this case the contrast was different.
The test was performed using the Opticians’ Sans font, which is used for optometric optotypes. The test started with a fixation cross in the central part of the screen, followed by a screen with five single letters arranged in a row; four screens were presented with four different letter sizes, and between each screen, a central fixation cross. The presented stimuli corresponded to the following angular sizes: stimulus 1, 0.4°; stimulus 2, 0.28°; stimulus 3, 0.19°; stimulus 4, 0.09° (Fig. 1b).
Continuous-text reading taskThe continuous text test was used to determine in detail the behavior and possible patterns of eye movements during reading, as well as to find similarities or differences between tests.
This test was applied using the Times New Roman font, a common typeface in continuously reading optotypes for individuals with low vision. Spanish sentences from the Radner Vissum test were used as references.23 Four different font sizes were presented, corresponding to angular size of the following data: Stimulus 1, 0.4°; Stimulus 2, 0.28°; Stimulus 3, 0.19°; Stimulus 4, 0.09° (Fig. 1c).
Two sentences were presented for each font size to avoid drawing conclusions from a single dataset. The test started with a central fixation cross, followed by continuous text displays; between each task, a central fixation cross appeared again.
To ensure content validity, the tests were evaluated by 5 professionals with knowledge in eye-tracking, optometry and visual rehabilitation.
Procedure for the application of eye-tracking testsThe eye-tracking test was conducted in a closed laboratory, under controlled conditions of ambient lighting (70-100 lx) (MAVO Monitor, Gossen, Germany) and temperature (24°C) (TFA, Dostmann Wertheim, China). The test was performed in a space free of distractions, ensuring that no light source was directed at the person's face or the eye-tracking device.
Each participant sat 60 cm from the screen. A forehead rest was used to maintain the distance and to reduce sudden head movements, and each person used their best possible optical correction, as long as the lenses used did not interfere with the device's capture of the eyes. The tests were applied in order of least to most visually complex.
The procedure applied was as follows
- 1.
Calibration modelling using printed stimuli. The designed stimulus was printed on paper, and before starting the calibration, an explanation of the procedure was provided to each participant to allow them to anticipate the task.
- 2.
Calibration of the device for each individual. The maximum deviation was limited to <1°. If the deviation was high, the calibration test was repeated, and participants were excluded if the calibration was still deficient. Calibration was performed at the beginning of each test such that if a person became fatigued at the end of the test, he or she could withdraw and take a short break. Three individuals were excluded from the study because of difficulty in performing the calibration.
- 3.
In the single-letter reading test, each participant was asked to read a line of letters that appeared on the screen as fast as possible, and at the end of the line, the researcher had to press the space bar to move to the next screen.
- 4.
Continuous text reading test. Each participant read the sentences presented on the screen, and at the end of each sentence, the tester pressed the space bar to move to the next screen.
Tobii Pro Lab software (version 1.232.52758 (x64)) was used for the test presentation and data extraction. First, recordings of each participant were reviewed to detect possible recording errors. The metrics analyzed for each task and stimulus size were as follows:
- 1.
Single-letter reading: Total reading time, average duration of fixations, total number of fixations, time to make the first fixation, and number, speed, and amplitude of saccadic movements.
- 2.
Continuous text reading: Reading time, number of words per minute (wpm), number of errors, mean duration of fixations, number of fixations, time to make the first fixation, number of fixations and time to find the second line, number, speed, and amplitude of saccadic movements, number of regressions, and the existence of a pattern of line change were determined by classifying them into oblique change, return along the same line to go down, or no pattern of change.
Data were analyzed using the SPSS 21 statistical package (IBM Corporation, New York, United States). To assess the reliability or internal consistency of the eye-tracking test, we used Cronbach's alpha,24 obtaining an alpha of 0.7 in the single-letter reading test and 0.9 in the continuous text reading test, which is within the ranges that consider the test to have good/high reliability.
The Shapiro-Wilk test was used to assess the normality of the data, where necessary, and the data were normalized by calculating the decimal logarithm of each value. The Student's t-test was used to compare the means of the metrics of the control and study groups. The ANOVA test was also applied for multiple comparisons between the metrics for each of the different sizes of stimuli presented to determine if there was a different behavior in eye movements in the subjects in the study group when the size of the stimulus changed; in this case, Bonferroni adjustment was used when necessary. Differences were considered statistically significant at the 95% confidence level when the P-value was < 0.05.
ResultsFour individuals were excluded from the data analysis, three of them due to inability to calibrate the eye-tracking device, and one more person was excluded because after testing, the program did not make a complete record of the individual's data.
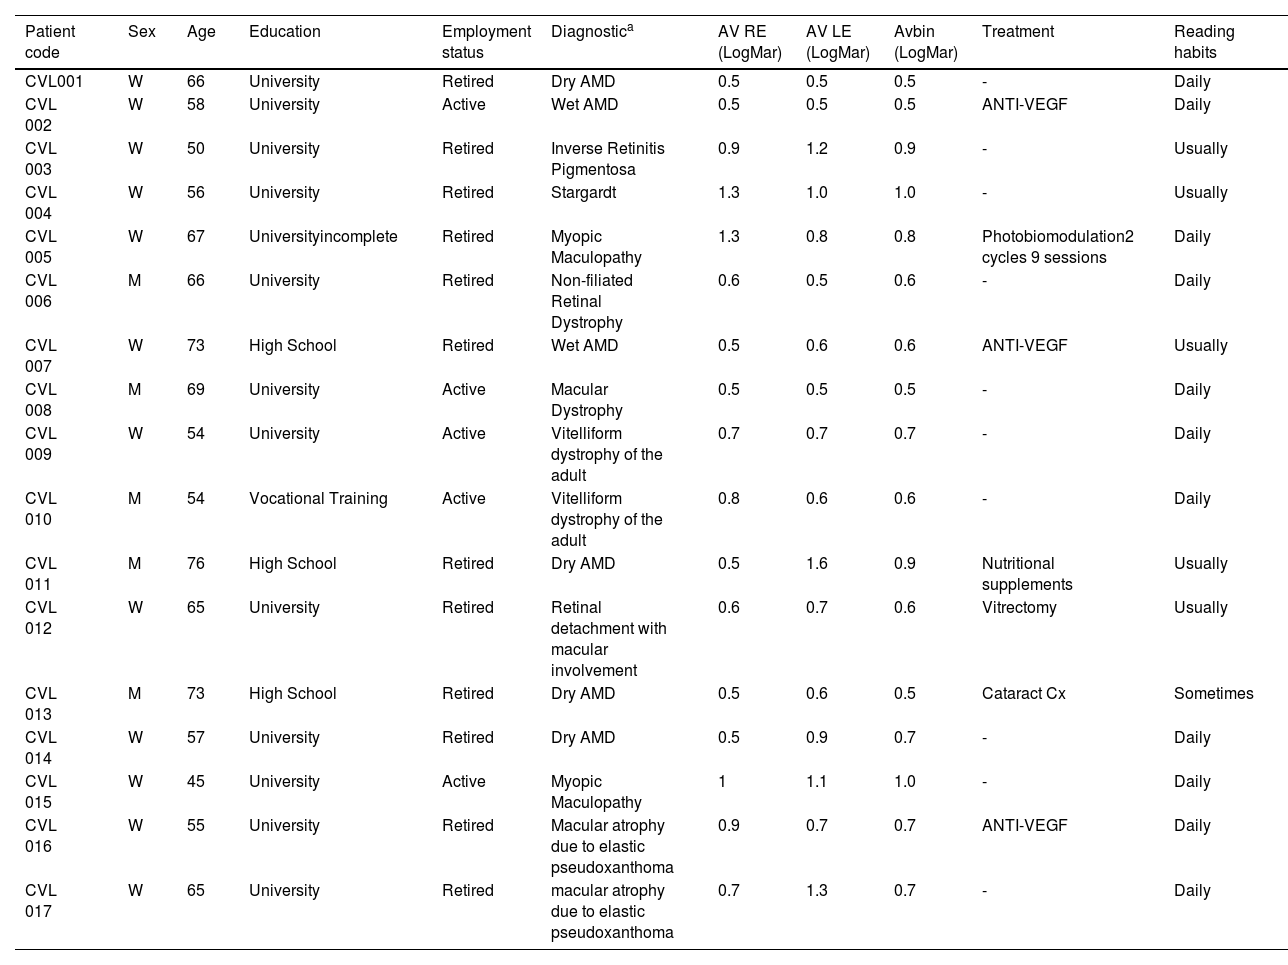
Finally, seventeen patients with central vision loss (12 females, 5 males; 61.7 ± 8.8 years) and seventeen individuals participated as part of the control group (12 females, 5 males; 61.82 ± 9.8 years). All individuals in the control group had a visual acuity of 0.0 LogMAR or better. None of them had any diagnosed ocular pathology or other health conditions that could potentially influence the study results, all of them had completed compulsory secondary education or higher. Additionally, all participants reported being habitual readers. The characteristics of the patients are shown in Table 2.
Characteristics of the study group.
| Patient code | Sex | Age | Education | Employment status | Diagnostica | AV RE (LogMar) | AV LE (LogMar) | Avbin (LogMar) | Treatment | Reading habits |
|---|---|---|---|---|---|---|---|---|---|---|
| CVL001 | W | 66 | University | Retired | Dry AMD | 0.5 | 0.5 | 0.5 | - | Daily |
| CVL 002 | W | 58 | University | Active | Wet AMD | 0.5 | 0.5 | 0.5 | ANTI-VEGF | Daily |
| CVL 003 | W | 50 | University | Retired | Inverse Retinitis Pigmentosa | 0.9 | 1.2 | 0.9 | - | Usually |
| CVL 004 | W | 56 | University | Retired | Stargardt | 1.3 | 1.0 | 1.0 | - | Usually |
| CVL 005 | W | 67 | Universityincomplete | Retired | Myopic Maculopathy | 1.3 | 0.8 | 0.8 | Photobiomodulation2 cycles 9 sessions | Daily |
| CVL 006 | M | 66 | University | Retired | Non-filiated Retinal Dystrophy | 0.6 | 0.5 | 0.6 | - | Daily |
| CVL 007 | W | 73 | High School | Retired | Wet AMD | 0.5 | 0.6 | 0.6 | ANTI-VEGF | Usually |
| CVL 008 | M | 69 | University | Active | Macular Dystrophy | 0.5 | 0.5 | 0.5 | - | Daily |
| CVL 009 | W | 54 | University | Active | Vitelliform dystrophy of the adult | 0.7 | 0.7 | 0.7 | - | Daily |
| CVL 010 | M | 54 | Vocational Training | Active | Vitelliform dystrophy of the adult | 0.8 | 0.6 | 0.6 | - | Daily |
| CVL 011 | M | 76 | High School | Retired | Dry AMD | 0.5 | 1.6 | 0.9 | Nutritional supplements | Usually |
| CVL 012 | W | 65 | University | Retired | Retinal detachment with macular involvement | 0.6 | 0.7 | 0.6 | Vitrectomy | Usually |
| CVL 013 | M | 73 | High School | Retired | Dry AMD | 0.5 | 0.6 | 0.5 | Cataract Cx | Sometimes |
| CVL 014 | W | 57 | University | Retired | Dry AMD | 0.5 | 0.9 | 0.7 | - | Daily |
| CVL 015 | W | 45 | University | Active | Myopic Maculopathy | 1 | 1.1 | 1.0 | - | Daily |
| CVL 016 | W | 55 | University | Retired | Macular atrophy due to elastic pseudoxanthoma | 0.9 | 0.7 | 0.7 | ANTI-VEGF | Daily |
| CVL 017 | W | 65 | University | Retired | macular atrophy due to elastic pseudoxanthoma | 0.7 | 1.3 | 0.7 | - | Daily |
The metrics collected for the reading tasks are expressed as means and standard deviations (Tables 3 and 4).
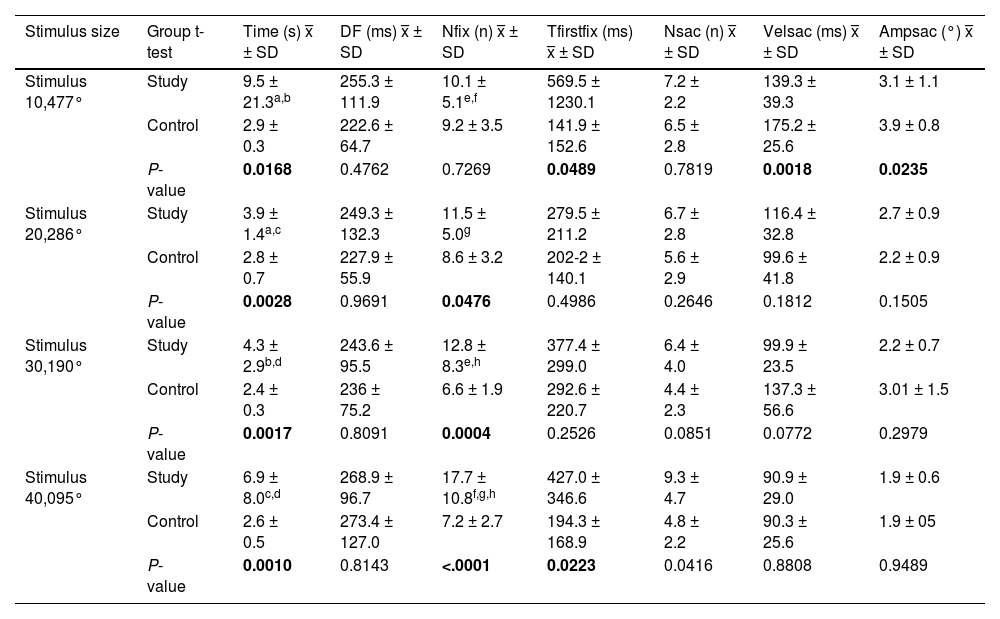
Results in single-letter reading task.
Time, Time to complete the task; DF, Duration of fixations; Nfix, Number of fixations; Tfirstfix, Time to first fixation in the area of interest; Nsac, Number of saccades; Velsac, Velocity of saccades; Ampsac, Amplitude of saccades. P < 0.05.
P-value =Student's t-test.
ANOVA test:
ᵃP = 0.0110; ᵇP = 0.0108; ᶜP = 0.012; ᵈP = 0.015; ᵉP = 0.0054; ᶠP = 0.0040; ᶢP = 0.006; ʰP = 0.0050.
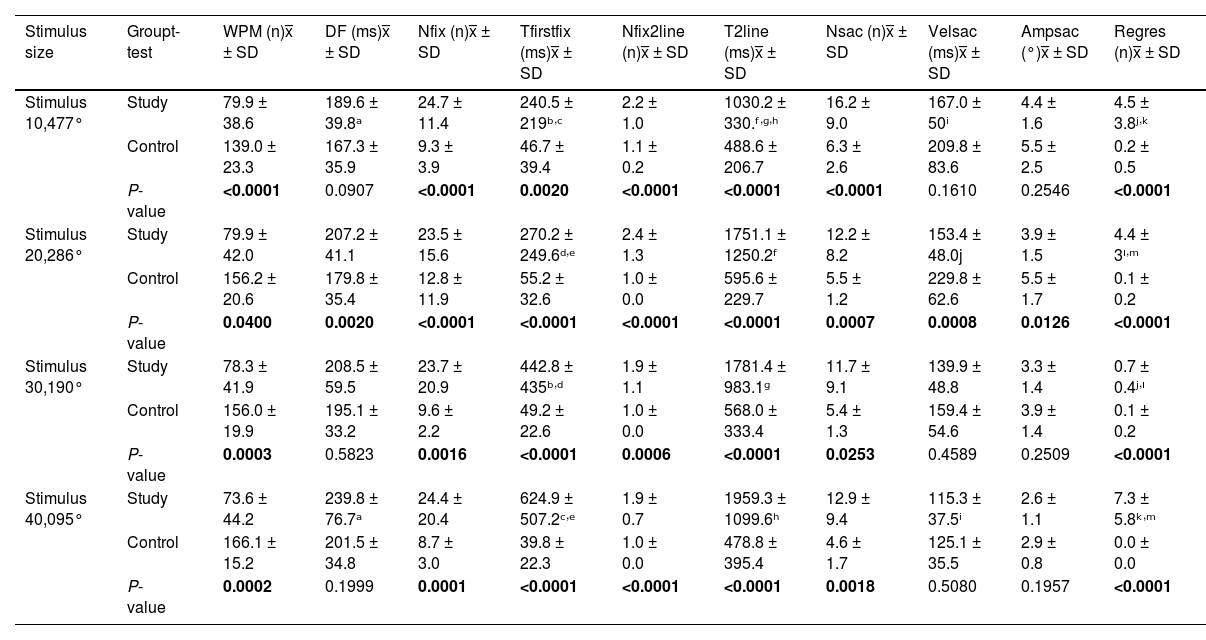
Results in continuous reading task.
Obliq, Oblique pattern; NP, No pattern; WPM, Words per minute; DF, Fixation duration; Nfix, Number of fixations; Tfirstfix, Time to first fixation; Nfix2line, Number of fixations to find second line; T2line, Time to find second line; Nsac, Number of saccades; Velsac, Velocity of saccades; Ampsac, Amplitude of saccades; Regres, Number of regressions.
P-value =Student's t-test.
ANOVA test:
ᵃP = 0.05; ᵇP = 0.04; ᶜP = 0.039; ᵈP = 0.045; ᵉP = 0.04; ᶠP = 0.05; ᶢP = 0.014; ʰP = 0.015; ⁱP = 0.0030; ʲP < 0.0001; ᵏP < 0.0001; ᴵP = 0.0078; ᵐP = 0.012.
Individuals in the study group required more time to complete the reading, and the duration, number of fixations, and number and speed of saccadic movements were also higher, with a lower saccade amplitude in relation to the control group (Table 2).
Statistically significant differences (P < 0.05) between the two groups were found for all four stimulus sizes in the metrics of total reading time and number of fixations.
For the total reading time, the study group showed a variation in time with a change in stimulus size of up to 6 s, with the reading time being longer for the larger stimuli (0.47°) and the smaller one (0.0095°). The control group maintained a short and stable time throughout the test (Fig. 2).

Single letter reading test by group and by stimulus size. a. Reading time. b. Number of fixations. c. Number of saccades. Reading continuous text. a. Reading time. b. Number of fixations. c. Number of saccades. d. Time to find the first line. e. Time to find the second line f. Amplitude of saccades. g.Number of fixations, saccades and regressions in the continuous text reading test for the study group and the control group.
In comparison with the number of fixations in the study group, a pattern of an increasing number of fixations was observed as the size of the stimulus decreased, reaching a difference of up to eight fixations between the largest and smallest stimuli.
Continuous reading taskStatistically significant differences were found between the two groups in most of the metrics analyzed and for the four stimulus sizes presented.
The participants in the study group did not have a specific pattern for making the line change, whereas those in the control group made an oblique line change.
Patients in the study group made a greater number of errors during reading, which increased as the font size decreased, and took longer to complete the reading task (Fig. 2). This resulted in the study group reading between 60-92 words per minute, which was less than the control group. Although stable behavior was observed in the number of words read across all four stimulus sizes, the number of words read tended to decrease when the font size of the presented text also decreased.
Patients with central vision loss made between 15 and 18 more fixations than the control group, and the same behavior was observed in the number of saccadic movements and regressions.
Study group had a stable behavior in terms of the number of fixations without this being altered by the change in stimulus size, the number of saccadic movements showed a small decline in stimulus sizes 2 (0.286°) and 3 (0.190°), being higher in the largest and smallest stimulus sizes. An increase in regression was evident in the control group when the letter size decreased (Fig. 2).
Regarding the ability to find the reading lines, differences between the groups were found in the time taken to find the first line, where the study group required between 173 and 585 ms more time than the control group. The same behavior was observed in the time taken to find the second line. However, in this case, the study group required 200–1000 ms more time to shift their gaze to the next line, and they made an average of two more fixations during this movement.
The time to find the first and second lines showed stable behavior in the control group, while in the study group, there was an increase in time as the stimulus size decreased.
The correlations between the metrics obtained in both tests and visual acuity were not statistically significant (P > 0.05).
DiscussionThis study aimed to assess eye movements during reading in individuals with central vision loss, using eye-tracking technology. Furthermore, we analyzed the contribution of eye tracking technology to visual rehabilitation services. For this purpose, an ad hoc protocol was created to assess eye movements during two reading tests using four different stimulus sizes.
Both tests showed statistically significant differences (P < 0.05) between the groups in the metrics of reading time, number of fixations, time to first fixation in the area of interest, and number of saccadic movements. The continuous text test also revealed differences in the pattern of line change, number of errors, number of words per minute, number of fixations, time to find the second line, and number of regressions.
Reading speed is one of the main aspects of reading performance. In relation to this metric, in the single-letter test, the study group showed greater variability in time for the four stimulus sizes. For continuous texts, there was a small increase in reading time as the font size decreased.
Reading speed was measured as the number of words per minute (wpm). In this study, patients with central vision loss read significantly fewer words than healthy individuals, ranging from 73-79 wpm. Similar results have been reported in previous studies, such as that of Prahalad et al., who found that, for similar letter sizes, individuals with central scotoma read an average of 79.8 wpm.25 Scherlen et al. reported a range of 65-80 wpm in this population.26
When analyzing behavior as a function of stimulus size, no significant variability was observed in the number of words read by the study group. Chung and Calabrese et al. showed that for different font sizes, the average number of words per minute remained constant in patients with central vision loss, unlike in healthy individuals. This confirms that vision restriction is an impairment in reading speed, and not necessarily in the spatial resolution of the stimulus.5,27
Reading speed is closely linked to eye motility patterns, such as the duration and number of fixations and amplitude of saccadic movements.28 A slower reading time is associated with fixation stability and a high number of saccadic movements.11,29
In a study by Yu and Kwon, they applied a reading test on 24 individuals with a simulated central scotoma and found a mean saccadic amplitude of 3.19 ± 0.09° and a fixation duration of 217.33 ± 6.41 ms,28 although these results are similar to those of this study, in our case the duration of fixations of the study group was longer than that of the control group, results that differ from previous studies that show that the duration of fixations is reduced in reading tasks in individuals with macular degeneration,30 in addition, no significant difference was found between groups in the duration of fixations.
Yu and Kwon recorded a saccade velocity of 107.3 ± 2.57°/sec, which is similar to that of the study group. It should be noted that the saccade velocity decreased only in relation to the control group in the continuous text test.
In this regard, Chung supported the idea that the slowed speed of saccadic movement results in the detection of a reduced number of letters in each movement.11 This could be caused by the difficulty of the task, which, unlike single-letter reading, exposes the person to more stimuli with less separation between them, and requires the person to try to move through the words in more detail to identify and recognize the letters or words where the crowding effect also interferes.31
The number of errors and regressions are other factors that are often compromised in the reading of patients with central vision loss.25 In this study, it was evident that patients in the study group made a higher number of errors and more regressions compared to the control group, which was confirmed by previous studies.32
Yu et al. found that regression increased by up to 86% between individuals with no visual impairment and those with central scotoma; even when reading a set of five letters from left to right, individuals with macular degeneration tended to regress by up to two times more than those in the control group.28
Line changes during reading can be a challenge for individuals with central vision loss; in this case, there were more fixations and more time to move from the end of one line to the start of the next, even though most did not show an orderly line change pattern. When executing line changes, factors such as line spacing may play a role33 in visual search skills. Training in scanning and finding strategies should be considered to encourage fluent reading or alternative text presentations, such as scrolling text, should be considered.32
The results obtained reflect that central vision loss may alter some features of eye movements and lead to lower reading performance compared to healthy individuals; therefore, training in these skills should be considered in visual rehabilitation.
Reading when vision is not compromised can be understood as a seemingly automatic process, but its effective execution involves a complex interplay of eye movements, visual search skills, perceptual ability, low crowding effects, and adequate visual span, which are largely dependent on foveal function,6 so when there is a macular problem, these factors can be affected, resulting in poor reading performance that can lead to frustration, and many individuals may even decide to give up reading tasks.
These statements suggest that beyond visual acuity, consideration should be given to controlling some elements of text presentation to improve access to reading for individuals with central vision loss. Indeed, in this study, there was no correlation between the metrics analyzed and visual acuity (P > 0.05), but there were significant differences between the groups in eye movements metrics and variable behavior in the study group when faced with different stimulus sizes.
In this sense, Latham et al., in a study carried out on patients with low vision, highlighted the importance of considering the most comfortable font size as an appropriate clinical measure as an alternative to critical font size,34 an idea supported by Xiong et al.4, who stated that reading acuity provides real information about a person's reading performance beyond his or her acuity to distinguish single letters.
Understanding the characteristics of eye movements during reading tasks may be fundamental for identifying specific skills that should be included in visual rehabilitation programs, thus allowing for the design of more personalized and timely training. Evidence suggests that oculomotor training is key to improving visual skills and reading performance in individuals with central field involvement.3,30
The main limitations of our study were the variability in the etiology of central vision loss and the small sample size. It is challenging to find participants with comparable visual functioning, even among individuals with the same diagnosis, which complicates the recruitment of large sample sizes for studies and prevented the generalization of the results, although the data found were similar to those of previous studies. Another limitation is that we only analyzed the differences in eye movements at different letter sizes and did not consider other variables, as contrast or illumination.
These limitations open the door for future studies on visual rehabilitation in individuals with central vision loss. Expanding sample sizes and developing assessment protocols to explore oculomotor behavior under varying text characteristics could help identify optimal typography for improved reading performance.
Additionally, applying eye-tracking to everyday tasks, such as reading labels or using mobile devices, may enhance understanding of functional autonomy. Investigating oculomotor patterns as potential biomarkers for cognitive decline and designing personalized interventions that integrate eye movements training with cognitive or physical therapies are promising directions. Longitudinal studies and research on the psychosocial impacts of improved eye movements could further illuminate its influence on quality of life and emotional well-being
ConclusionsCentral vision loss alters eye movements during reading in individuals with central vision loss, increasing the number of fixations, saccadic movements, regressions, and errors, and decreasing the amplitude and speed of saccadic movements. This results in decreased reading performance, particularly in terms of reading speed.
The identification of affected patterns in eye movements has important implications for visual rehabilitation, as it allows a better understanding of the specific difficulties that should be addressed in visual rehabilitation services. The results of the study lead to the conclusion that the main skills to be worked on are fixation stability, saccadic movements, visual search patterns and line changes.
Eye-tracking technology is a valuable and accurate tool for assessing binocular ocular motility in people with central vision loss, providing objective data on oculomotor behavior during real-life tasks such as reading. Our ad-hoc calibration method ensured minimal data loss and high validity, enhancing the reliability of assessments and enabling insights into the key skills that need to be trained, as well as recommendations for optimizing text features to improve reading performance. This technology holds significant potential as a complement to clinical evaluations, facilitating clinical decision-making, guiding personalized visual rehabilitation strategies, and supporting pre- and post-intervention assessments to evaluate effectiveness.
Data availability statementOur research data includes sensitive and confidential patient`s information. The data of the study can be requested from the corresponding author.
Ethical considerationsThe study protocol was reviewed and approved by the Ethics Committee of Complutense University of Madrid (No. CE_20221215-10_SOC). This study adhered to the principles and guidelines of the Declaration of Helsinki. Written informed consent was obtained from all participants before their participation in the study. All participants' personal information and test results were carefully saved and stored by the principal investigator.
FundingNo funding was received from funding agencies in the public, commercial, or non-profit sectors.
Author contributionsConceptualization, L.G-V, P.C. and J.L.H.-V.; Data curation: L.G-V; Investigation: L.G-V, P.C. and J.L.H.-V; Methodology, L.G-V, P.C., J.L.H.-V., J.A.G-P; Formal analysis, L.G.-V., P.C., J.L.H.-V., Project administration: L.G-V, P.C. and J.L.H.-V; Resources; L.G-V, P.C., J.L.H.-V., J.A.G-P; writing—original draft preparation, L.G-V, P.C., J.L.H.-V., J.A.G-P writing—review and editing, L.G-V, P.C., J.L.H.-V. All authors have read and agreed to the published version of the manuscript.
The authors acknowledge the University of Costa Rica for financial support provided to Leonela González Vides in her academic training abroad as a fellow under the Academic Mobility program of the Office of International Affairs and External Cooperation.


