


Considering the burden of refractive error, clinical-based research methods are often used as epidemiological tools. This study aimed to generate evidence on the prevalence and distribution of refractive error in Portugal.
MethodsA cross-sectional retrospective study was designed to review optometric records from Portuguese practices during July 2021.
Results348 optometric records were analysed. Subjects had a mean age of 44.2 ± 19.2 years (range 6–81) and 58.4% were female. The mean spherical equivalent was myopic, −0.65 ± 2.38 Diopters (D), varying from a minimum of −13.63 to a maximum of 6.25 D. According to sex, the mean spherical equivalent was −0.76 ± 2.29 D for female and −0.49 ± 2.49 D for male, with no significant difference between them (p = .307). The distribution of the spherical equivalent mean across the age groups, linearly varies from a myopic −1.62 ± 1.74 D in the age group of [6 – 29]; −1.58 ± 2.80 D in [30 – 44]; −0.09 ± 2.40 in [45 – 59] to a hyperopic 0.67 ± 1.61 D in the group of [60 – 81]. High myopia had a prevalence of 2.7% in the sample. Myopia was the most prevalent refractive error in the sample representing 41.3%. In the age group [6–29], myopia had a prevalence of 69.3%. Hyperopia had a prevalence in the sample of 29.7%.
ConclusionsMyopia represents the most prevalent refractive error within the sample and is the prevalence is higher in the younger age groups, demonstrating a shift towards an increase of myopia in the next years.
Although substantial variations in the estimates can compromise their interpretability and utility, clinical records and health care databases are important sources of information for estimating prevalence and incidence of eye care conditions and enable extensive study of its characteristics.1,2 Considering the burden and clinical and economic impact of uncorrected refractive error, clinical-based research methods are often used, along with the non-clinical, to generate evidence and estimates on the prevalence and distribution of refractive error.
Previous studies estimating the prevalence of refractive error by analysing the clinical records were conducted in different conditions. Such a study was already performed in Portugal, Queirós et al., 20093 analysed the clinical records of 4288 patients examined in five ophthalmologic and four optometric clinics in the north territory of Portugal. Gomez-Salazar et al.4 analysed records of 676 856 patients examined in optometry clinics in 14 states of Mexico. Malu and Ojabo, 2014,5 analysed records of 601 patients evaluated in a private hospital in Nigeria.
The findings of these three studies3–5 were similar, indicating that myopia was the most prevalent refractive error in school-aged children and hyperopia the most prevalent refractive error in adults with more than 40 years old. However, the collection of the data from different type of settings/sector, from different professionals and exam protocols and/or with geographical coverage restricted to a city or small regions within a country are limitations to be addressed.
To estimate the prevalence of refractive error within a country, a geographical coverage must be ensured, safeguarding that the methods of examination and the competency of the professionals performing it are consistent and comparable.
Considering this, the aim of this study was to estimate the prevalence and patterns of distribution of refractive error in Portugal within a clinical sample of consecutive patients examined in a chain of optometric practices using the same examination protocols distributed across the entire country.
MethodsStudy design and data collectionThis research was reviewed by an independent ethical review board and conforms with the principles and applicable guidelines for the protection of human subjects in biomedical research. A cross sectional retrospective study was designed to review optometric records from 20 consecutive examinations in 17 optometric practices, from a chain, scattered across 10 of the 20 districts of Portugal (Aveiro (n = 1), Braga (n = 2), Coimbra (n = 1), Faro (n = 1), Leiria (n = 1), Lisbon (n = 4), Madeira (n = 1), Porto (n = 4), Setúbal (n = 1) and Viseu (n = 1)) during July 2021. The optometric practices were distributed by districts from the north to the south of mainland Portugal and on the island of Madeira. All patients signed an informed consent allowing the provision of their data, anonymized to ensure that individuals could not be identified, and the study complied with ethical standards in accordance with the Declaration of Helsinki. Data were entered into a template Excel sheet previously prepared. The required data for all the cases was patient demographic information (sex, age, reason for the examination and result of the examination), patient refractive information (monocular and binocular distance presenting visual acuity (PVA), refraction – sphere, cylinder, axis, and addition, if prescribed – and monocular and binocular distance best-corrected visual acuity (BCVA)) and practice information (number of the optometric practice and district). PVA is the measure of unaided vision, or, if spectacles or contact lenses are worn to the assessment, VA is measured with the person wearing them. BCVA is assessed either with the best refraction or by pinhole. The study author was not involved in the data collection, had no contact with the patients in the clinical setting or with those responsible for the data collection. The various professionals responsible for the data collection were licensed optometrists with similar backgrounds, who follow the same examination protocols and conduct routine enforced by the optometric practices clinical management since 2018 and previously reviewed by one of the authors (JMGM) For patients who consulted more than once during the period in question, only data from the first visit were collected, ensuring that no patient data were duplicated and avoiding recall bias.
Data analysisAll data and information entered into the template were reviewed. Statistical analysis was conducted using the Statistical Package for Social Sciences (SPSS) version 28 (SPSS for Windows Inc., Chicago, IL, USA).
A sample characterization was made using descriptive statistics and presented as mean, standard deviation and frequencies. The variable age was grouped into 4 intervals with approximately 25% of individuals per group: 6 to 29, 30 to 44, 45 to 59 and 60 to 81 years old.
T-test was used to analyse the differences between the means of two groups and an Analysis of Variance (ANOVA) was used to analyse the differences between the means of more than two groups. The Pearson Chi-Squared test was used to analyse the frequency and percentage differences in refractive error according to sex and age groups, and the Bonferroni test was used to assess differences between the age groups. A p value of ≤ 0.05 was considered statistically significant. Estimates of prevalence were presented through percentages and corresponding 95% confidence intervals.
No significant difference for both the refractive (t = 1.586, p = .114) and visual acuity (PVA t = −0.347, p = .729 and BCVA t = −0.080, p = .936) outcomes between right eye (RE) and left eye (LE) were found (p = .114), so only results from the RE are presented in this work.
Outcome variables criteriaThe outcome variables were the refractive error parameters, namely, the spherical equivalent. Data on presbyopia were not analysed.
The quantitative definitions from the International Myopia Institute have been adopted, myopia was defined as spherical equivalent refractive error ≤ −0.50 Diopters (D) when ocular accommodation is relaxed and high myopia as spherical equivalent refractive error ≤ −6.00 D when ocular accommodation is relaxed.6 Emmetropia was defined for those with a spherical equivalent of less than 0.50 D in absolute value, regardless of whether the blur is myopic or hyperopic, and hyperopia when the spherical equivalent is ≥ +0.50 D.7
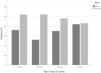
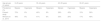
ResultsSample characterization348 optometric records were obtained, 14 had been eliminated due to duplication or incorrect entry, resulting in a total of 334 validated optometric records. Subjects had a mean age of 44.2 ± 19.2 years (range 6–81) and 58.4% were female. 163 of the subjects (49.0%) had more than 45 years old. Age groups were defined according two criteria, the first was to have a balanced number of individuals in each group but also according to key-ages for refractive error, namely a group up to 29 years old when is estimated a stabilization of myopia;8,9 a group beginning in the age 45, estimated age at onset of presbyopia;10 and another group beginning at 60 years old, when risks associated with myopia increase exponentially.11
Sex distribution across age groups is presented in Fig. 1. According to the practice location, 25% of the subjects were from Porto area; 24% from Lisbon; 11% from Braga, approximately 6% from each one of the areas of Setúbal, Viseu, Aveiro, Faro and Leiria and 5% from each one of Madeira and Coimbra areas.
As the reason for the examination, 55% already intended to update the refractive correction, 27% had a routine examination, 7% had the first eye care assessment and 11% search eye care for other reasons.
Amongst the total sample, 78% of the examinations resulted in a prescription of a refractive error compensation, 11% didn't require any action, 3% were referred for other health professionals without any prescription or action and 8% have had other results.
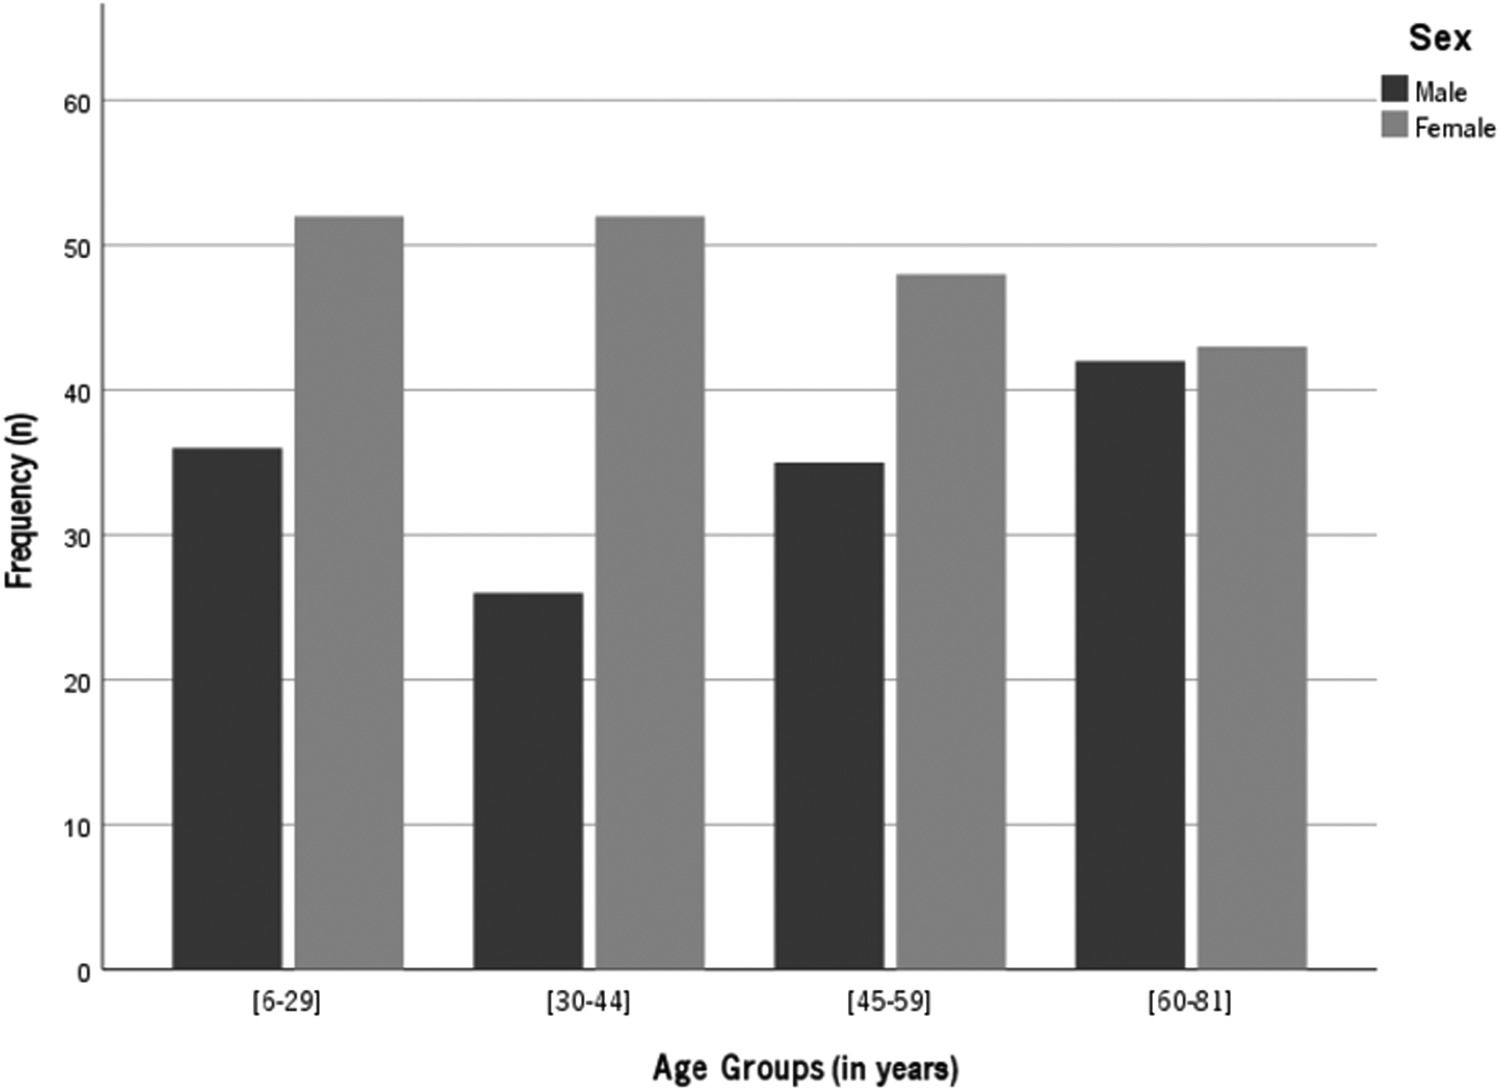
Refractive error descriptive analysis and distributionThe distribution of the refractive error within the sample, as spherical equivalent, assumes a normal distribution (Kolmogorov-Smirnov [K-S], p>.05), centred near emmetropia but shifted to myopia side (Fig. 2).
The mean spherical equivalent of the sample was myopic, −0.65 ± 2.38 D, varying from a minimum of −13.63 to a maximum of 6.25 D. The median value was emmetropic, −0.25. The distribution assumed a kurtosis of 3.63 D and a skewness of −1.04 D.
According to the sex, the mean spherical equivalent was myopic for both sex, −0.76 ± 2.29 D for female and −0.49 ± 2.49 D for male, with no statistically significant difference between them (t = 1.022; p = .307). The distribution of the spherical equivalent mean across the different age groups, varies from a myopic −1.62 ± 1.74 D in the age group of [6 – 29]; −1.58 ± 2.80 D in the [30 – 44]; −0.09 ± 2.40 D in [45 – 59] to a hyperopic 0.67 ± 1.61 in the age group of [60 – 81].
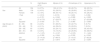
Statistically significant differences were found between the mean distribution of the spherical equivalent across the age groups (F = 22.88; p < .001). Statistically significant differences of the mean spherical equivalent were found between group [6 – 29] and groups [45 – 59] and [60 – 81] and between group [30 – 44] and groups [45 – 59] and [60 – 81], with p < .001 in all the cases (Table 1).
Distribution of the spherical equivalent (SE) by sex and age groups: means, standard deviation (SD) and 95% Confidence Interval (CI); a statistically significant.
Refractive error was categorized according to the previous mentioned definitions (see methods section). The mean of high myopia was −8.13 ± 2.37 D. It is important to refer that for the age group from 60 to 81 years old, no case of high myopia was detected. For myopia, the mean was −2.21 ± 1.45 D, with −2.40 ± 1.51 for females and −1.89 ± 1.29 for males but without significant differences between sex or age groups. In the case of emmetropia the mean was −0.05 ± 0.21 with mean values increasing linearly across the group ages from −0.13 ± 0.21 in the age group from 6 to 29 to 0.03 ± 0.21 in the group of 60 to 81 years old. Hyperopia had a mean of 1.69 ± 1.18. No statistically significant differences were found between the mean of each refractive error category and age or sex (K-S, p>.05).
High myopia had a prevalence of 2.7% in the sample, was most prevalent in males (4.3%) than females (1.5%), and the age group from 30 to 44 was the most affected (5.1%) (Table 2).
Frequency and percentage of refractive error, categorized according to definitions of high myopia, myopia, emmetropia and hyperopia, by sex and age groups and respective correlations.
| N | High Myopia (n;%) | Myopia (n;%) | Emmetropia (n;%) | Hyperopia (n;%) | ||
|---|---|---|---|---|---|---|
| All | 334 | 9; (2.7%) | 138; (41.3%) | 89; (26.7%) | 98; (29.3%) | |
| Sex | Male | 139 | 6; (4.3%) | 50; (36.0%) | 40; (28.8%) | 43; (30.9%) |
| Female | 195 | 3; (1.5%) | 88; (45.1%) | 49; (25.1%) | 55; (28.2%) | |
| t Test | t = 0.316; p = 0.761 | t = 2.018; p = 0.046 | t = 0.406; p = 0.686 | t = 0.392; p = 0.696 | ||
| Chi-Squared | χ2 =6.770; p = 0.455 | χ2 =28.575; p = .770 | χ2 =1.421; p = 0.965 | χ2 =20.909; p = 0.698 | ||
| Age Groups (in years) | [6 – 29] | 88 | 2; (2.3%) | 61; (69.3%) | 20; (22.7%) | 5; (5.7%) |
| [30 – 44] | 78 | 4; (5.1%) | 44; (56.4%) | 23; (29.5%) | 7; (9.0%) | |
| [45 – 59] | 83 | 3; (3.6%) | 20; (24.1%) | 24; (28.9%) | 36; (43.4%) | |
| [60 – 81] | 85 | 0; (0.0%) | 13; (15.3%) | 22; (25.9%) | 50; (58.8%) | |
| ANOVA | F = 1.075; p = 0.399 | F = 0.127; p = 0.944 | F = 2.576; p = 0.590 | F = 1.420; p = 0.242 | ||
| Chi-Squared | χ2 =14.25; p = 0.431 | χ2 =88.73; p = 0.873 | χ2 =19.27; p = 0.376 | χ2 =82.26; p = 0.265 |
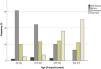
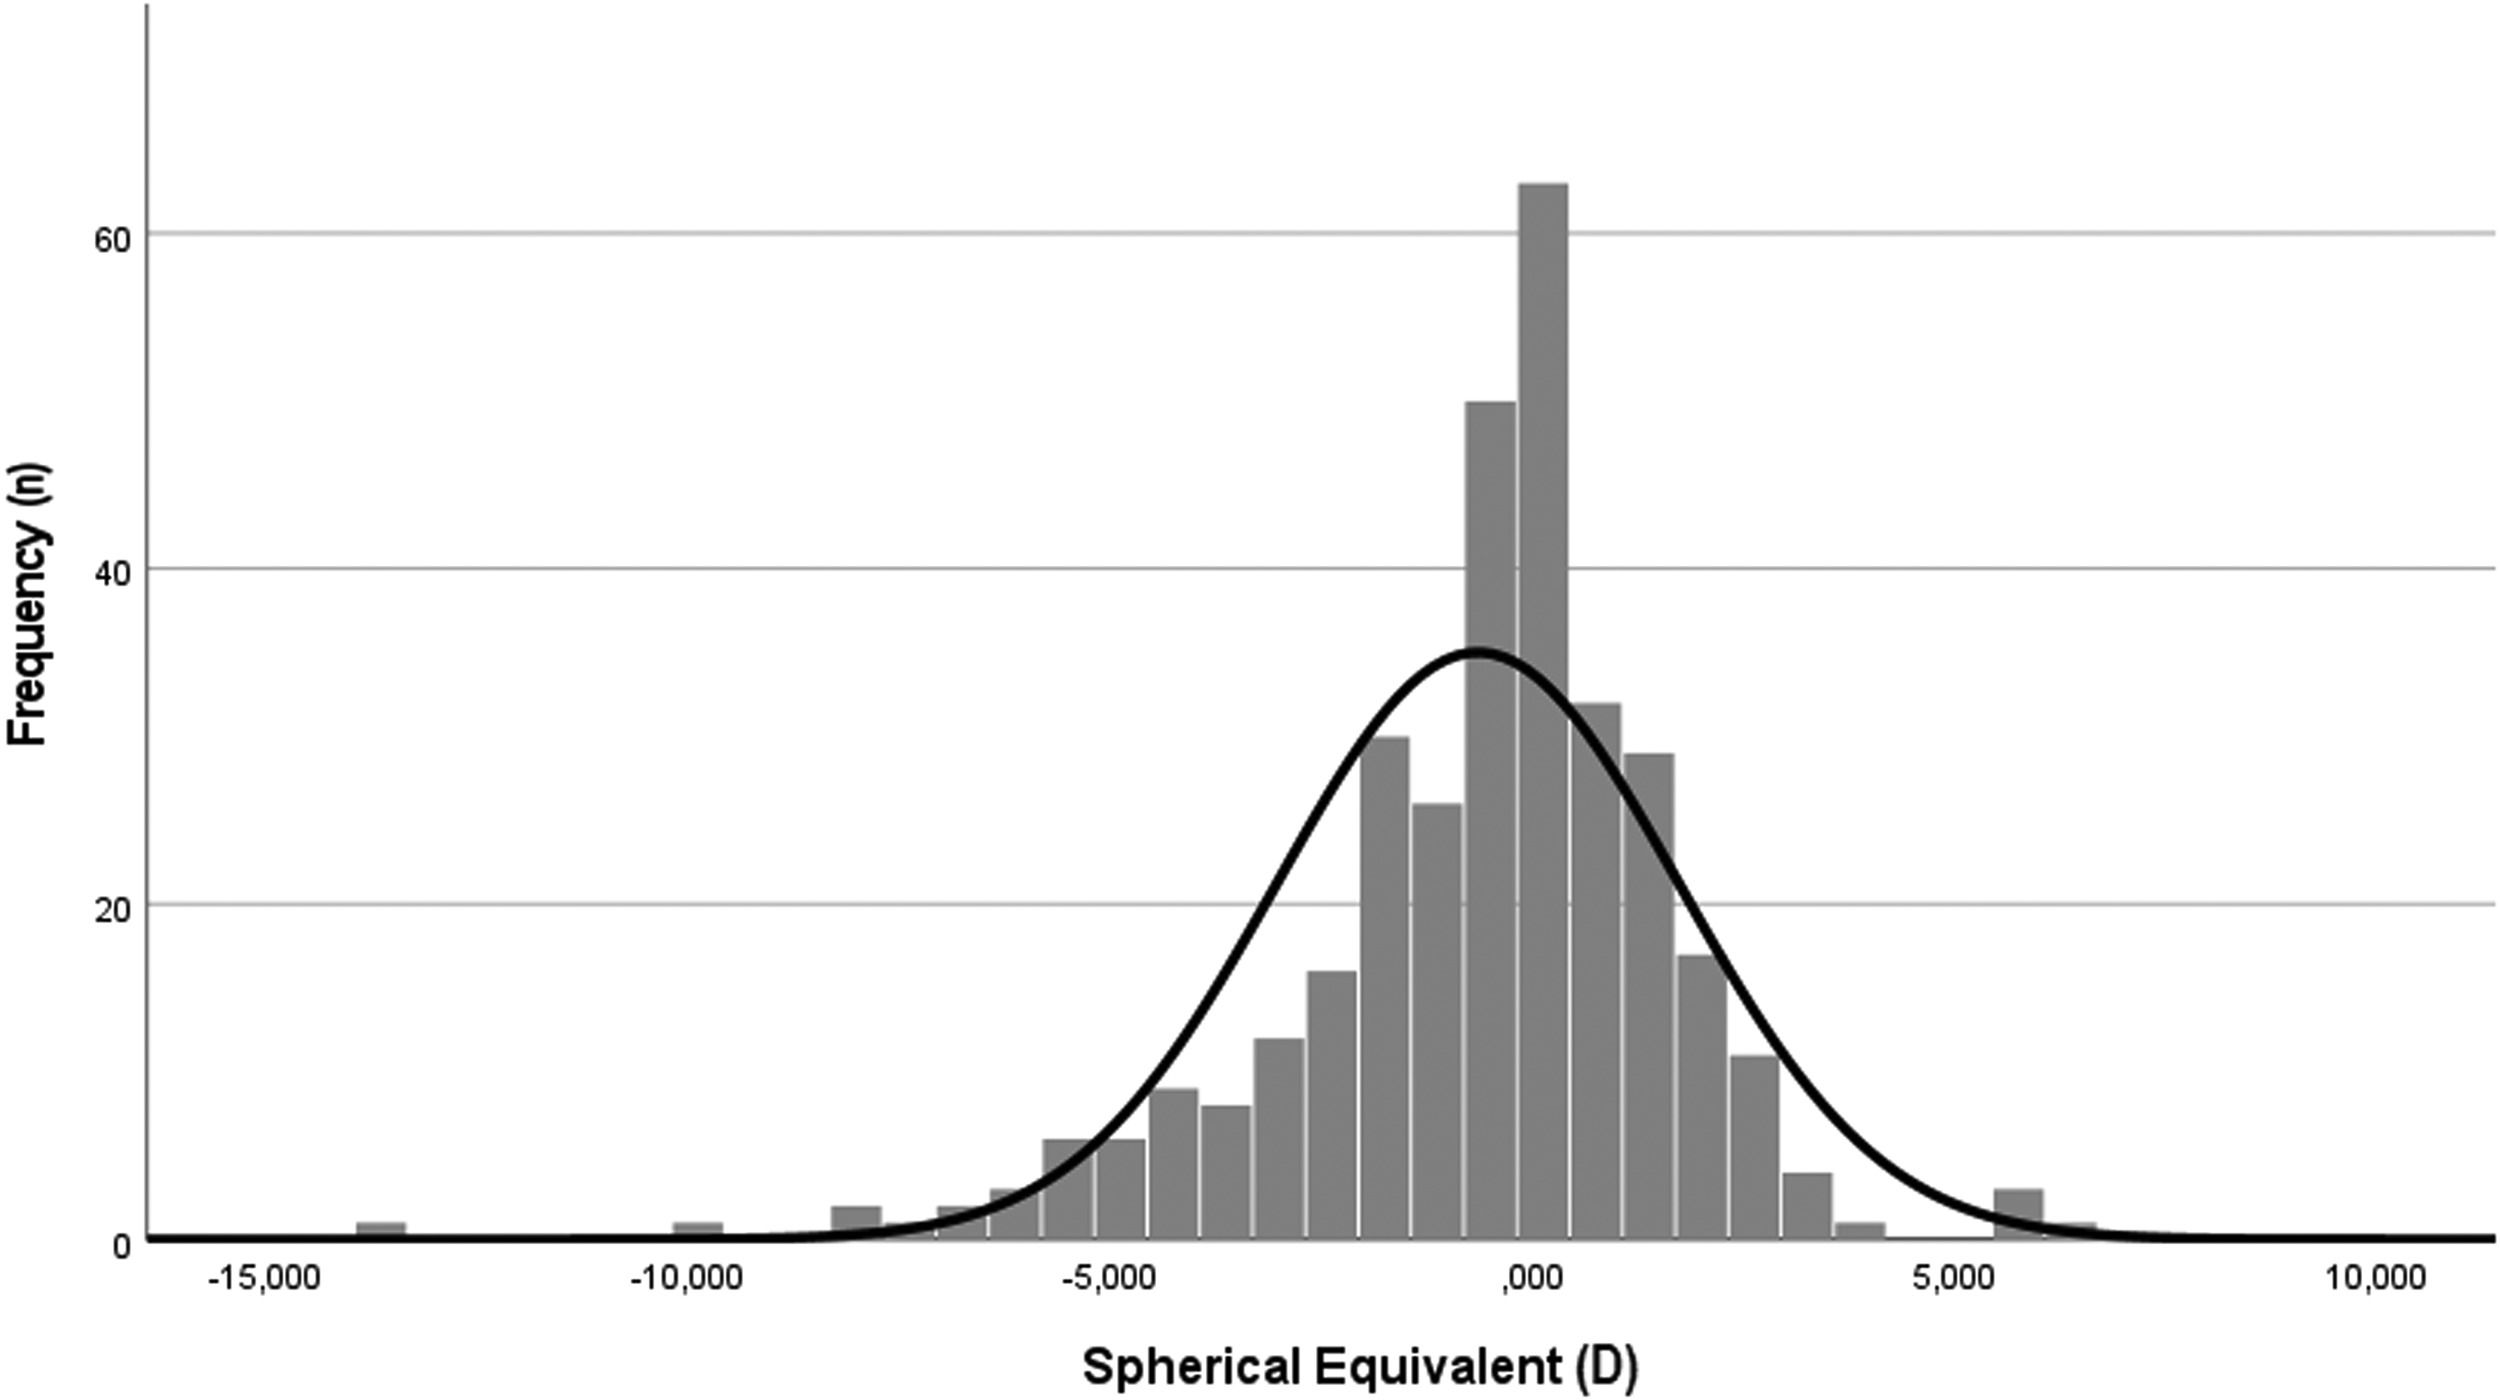
Myopia was the most prevalent refractive error in the sample with 41.3%. 69.3% of the individuals form the age group 6 to 29 years old and 56.4% of those in the age group from 30 to 44 had myopia. Myopia prevalence was higher in females (45.1%) than males (36.0%). The prevalence of myopia reached a minimum of 15.3% in the age group of 60 to 81 years old (Fig. 3 and Table 2). No association between myopia and age or sex groups was observed.
Emmetropia prevalence was very similar between age groups and between males and females (Fig. 3 and Table 2).
Hyperopia was present in 29.7% of the sample and the prevalence was slightly higher in males (30.9%) than females (28.2%), with no statistically significant differences. The prevalence of hyperopia increases with the age of the sample, varying from 5.7% in the age group from 6 to 29 years old to 58.8% in the age group from 60 to 81 years old (Fig. 3 and Table 2). No association between hyperopia and age or sex was detected.
DiscussionThis study aimed to estimate the prevalence and patterns of distribution of refractive error in Portugal within a clinical sample of consecutive patients examined in a chain of optometric practices distributed across the entire country territory.
The mean refractive error of the sample was myopic, −0.65 ± 2.38 D and the skewness of the distribution shows an asymmetry towards the myopic side. No statistically significant differences were found between males or females. According to age, a populational shift towards the myopization of the population is observed, with the younger age group from 6 to 29 years old presenting a mean refractive error of −1.62 ± 1.74, that gets less myopic for the age group from 30 to 44 years old (−1.58 ± 2.80 D), to an emmetropic mean for the age group from 45 to 50 years old (−0.09 ± 2.40 D) and finally a hyperopic mean in the age group from de 60 to the 81 years old (0.67 ± 1.61), in agreement with several studies.3,12–14 Statistically significant differences were found between the overall mean spherical equivalent and certain age groups, namely between the 6 to 29 years old group and the groups from 45 to 59 and 60 to 81 years old and between group the 30 to 44 group and the groups from 45 to 59 and 60 to 81 years old. The results of this study suggest that the onset of myopia in early ages, continues throughout life, eventually evolving, in a small percentage, to high myopia15 and that younger generations tend to present a higher prevalence of myopia.13
This refractive error shift amongst the age groups (older people more hyperope than younger), has been linked to physiological eye changes with age.16 However, and assuming that no hyperope at a certain age will become myope, a populational analysis and not a case-based one can better inform about trends and predictive evaluations. In fact, the present results illustrate an intergenerational change in refractive error distribution rather than changes as consequence of the ageing. The hyperopia to myopia shift shows a demographic shift, were the younger generation is becoming more myope, and myopia increases, and the hyperopia is decreasing by the natural life-end of the more older population, that is known to be more hyperopic.13,17,18
Prevalence of high myopia within the sample was of 2.7%, and 4.3% of the male individuals in the sample present this refractive error.
Myopia was the most prevalent refractive error in the sample, with 43.1% of the cases, in line with the epidemiological data and trends verified around the world.9,13,19–21 69.3% of the cases in the age group from the 6 to the 29 years old; 56.5% of the cases in the age group of 30 to 44; 24.1% of the cases in the group from 44 to 59 and lastly, 15.3% of the cases of the age group from the 60 to the 81 years old were myopes. Showing the same trend in the increase of myopia for the younger generations reported in the literature.12,13,21
The prevalence of hyperopia in the sample was 29.3%, showing the inverse trend of myopia, with a decrease of prevalence for the younger generations.20,21 Hyperopia represented 5.7% of the cases in the age group from the 6 to the 29 years old; 9.0% of the cases in the age group of 30 to 44; 43.4% of the cases in the group from 44 to 59 and 58.8% of the cases of the age group from the 60 to the 81 years old.
Comparing the values of prevalence found within the sample of this study with findings from the same country, we observe a higher value of myopia prevalence in this study, 43.1%, than by Queirós et al., 2009, 29.8%, and a very similar value of hyperopia prevalence with 29.3% in this work compared to 25.2% founded by Queirós et al., 2009. Also, it is important to note that temporal differences of this studies (2009 to 2021) can contribute to higher prevalence of myopia and a shift of the distribution of refractive error to have more myopic younger generations nowadays.3,13
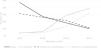
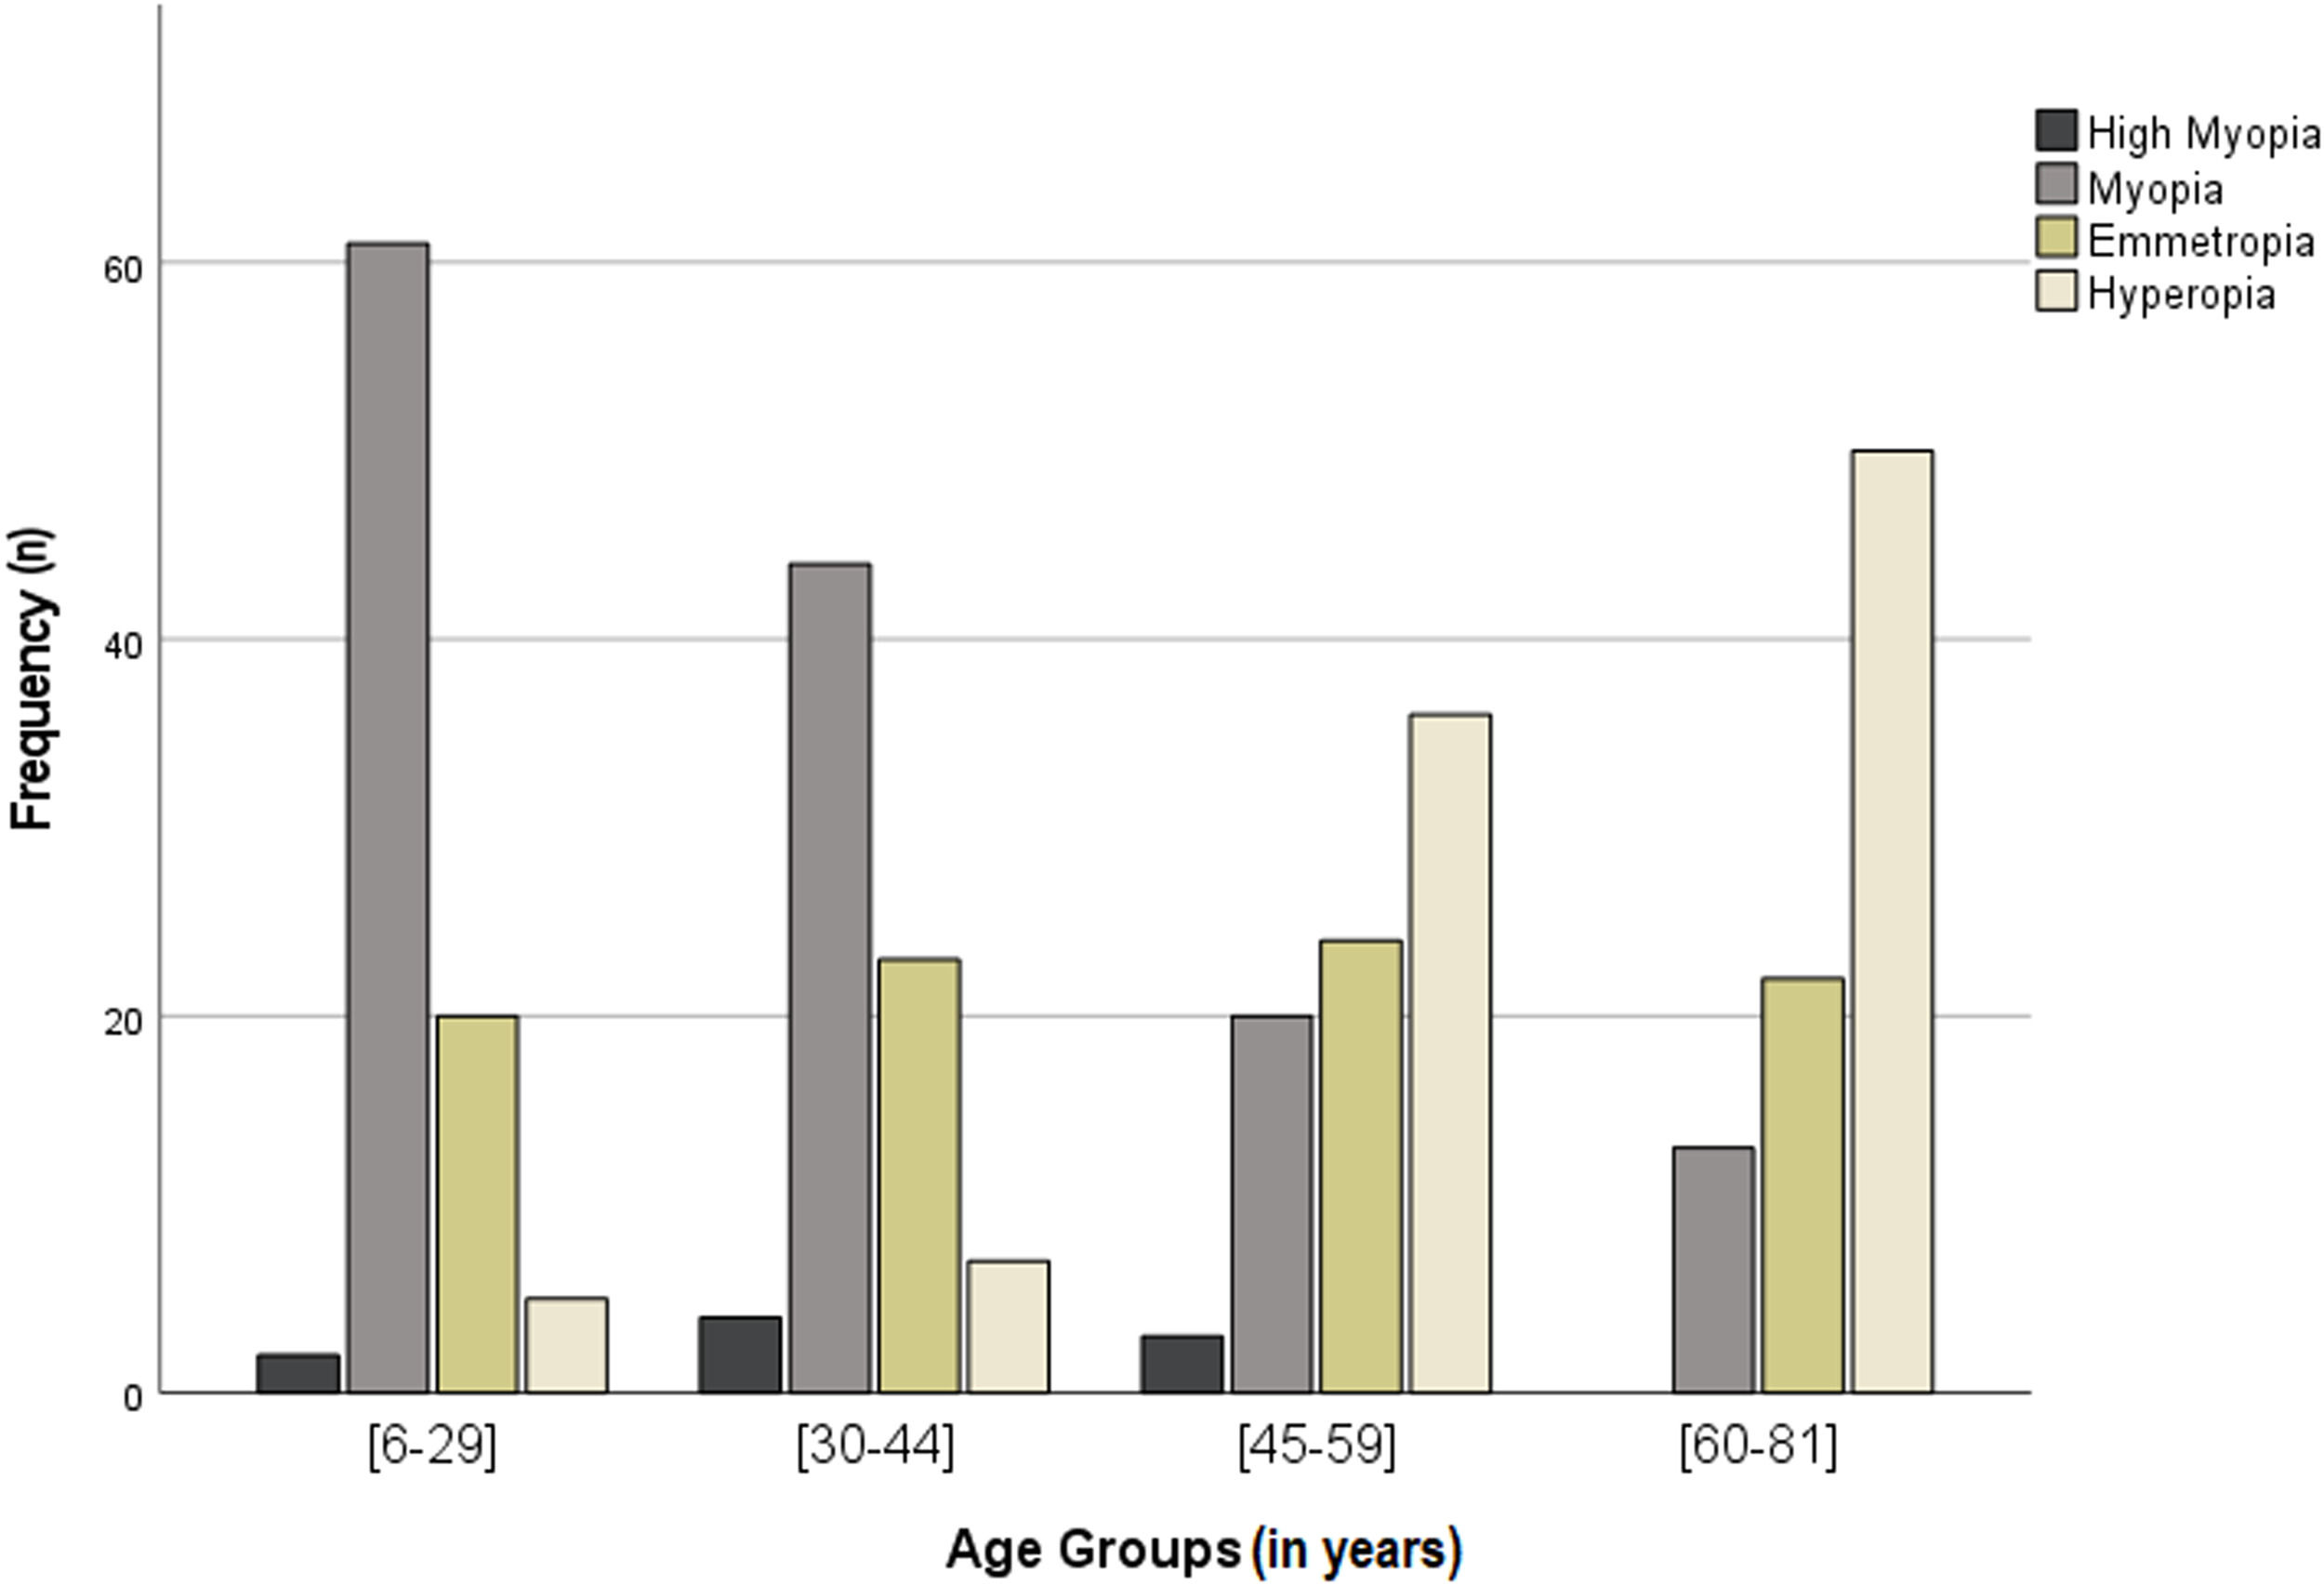
Williams et al., 2015, estimate the prevalence of refractive error in adults across Europe in an epidemiological study.21 Making a comparative analysis of the findings of this study, specifically the prevalence of myopia (high myopia included) and hyperopia according to age groups, with his results, similarities in the trends are observed (Fig. 4). The temporal distance between the studies (2015 to 2021) is also an effect to consider, assuming that an increase in the prevalence of myopia for younger generations is expected over the years.13
![Comparison between the values of prevalence found in this study with Williams et al. (2015) for myopia and hyperopia according to the age groups. * [6,29] range in Williams](https://static.elsevier.es/multimedia/18884296/0000001600000004/v1_202309200613/S1888429623000134/v1_202309200613/en/main.assets/gr4.jpeg?xkr=ue/ImdikoIMrsJoerZ+w93meMsSv3kCFu9ka1kgzl/xrK32s3f4YRcWD6Dd7AXarN4J/wPnQyBA42SPCQjNlv2+T+FIszyxRhh8zxrYi5rydsaQ5lEck7donQLKfx1e8oF+yAa8V8u8CA+A1JuXiP+TfWeUlDzC9PTZ0zidwCypMt/HEio5dsjiL2r2M0bFHbDjpameSuJgPSPpuCkOBcbEXR42wfrowBp99th1QAh8Fr6afduSGVpUzPpMSpGzQ8ezbOgOT9/IYrA0wV7ro6RHuGePfRo3KMo3nU8iGQYA=)
Despite the differences in the study design, methodology and samples, values of refractive error prevalence within this sample according to age groups were very similar to the ones found by William et al., 2015. A comparative analysis of these findings, specifically the prevalence of myopia (high myopia included) and hyperopia according to age groups is presented in Table 3. The most prominent differences are observed for the prevalence of myopia in the age group from 6 to 29 years old and the prevalence of hyperopia in the age group from 45 to 58 years old. Both prevalence values are higher in the present study, what can be justified by the differences in the mean age and sample (n) within the age groups.
For the group age of 6 to 29 years old, the prevalence of hyperopia assumes the same value in both studies, 6%, and the prevalence of myopia is 72% in this work and 48% for Williams et al., 2015. From the 30 to 44 years old both the hyperopia and myopia prevalence are very similar, 9% in this work and 6% in Williams et al., 2015, for hyperopia and 40% in this work and 41% in Williams et al., 2015, for myopia. A prevalence of 33% of myopia and 20% of hyperopia was found for the age group of 45 to 59 years old by Williams et al., 2015, very similar to the 28% of myopia but not to the 43% of hyperopia found in this work, that can be justified by the differences in the mean age and sample (n) within the age group. And lastly, for the group age of 60 to 81 years old, the prevalence of hyperopia is 59% in this work and 49% for Williams et al., 2015 and the prevalence of myopia is 15% in this work and 17% for Williams et al., 2015.
LimitationsThere are important limitations in this approach, and it is not intended to be considered as a source of epidemiological data comparable to population studies. The main limitation of this study is the fact that the selection of individuals (records) was conducted using non-probability sampling. The study is based on data obtained in clinical settings and may not reflect the population distribution. Likewise, by including individuals who attended the clinic, that is searching for eye care, one could have a selection bias. However, it allows to obtain results comparable to other approaches that are much more costly and time-consuming. Although it provides useful findings, this study design, as well as the non-probability sampling approach, limits extrapolation of those findings to the general population.
ConclusionIn conclusion, this study showed that myopia represents the most prevalent refractive error within the sample of optometric practices analysed. More important, myopia prevalence is higher in the younger age groups than the older ones, demonstrating a shift towards an increase of myopia in the next years. That trend has important implications for public health, in the planning of services, not only to manage the increase in the prevalence of myopia, but also, future expected myopia-related complications likely to cause visual impairment.
Findings from this study show what to expect at service level and allows decision-makers to plan at service delivery level, informing on the distribution of refractive error, frequency and ranges to expect for different age groups. Additionally, this study allows to identify alternative sources of epidemiological data, demonstrating to be a low-cost design when compared to population-based surveys, and an important instrument for public health purposes.
This research did not receive any specific grant from funding agencies in the public, commercial, or not-for-profit sectors.


