


To evaluate the viability and accuracy of a mobile application (app) for subjective measurement of presbyopic addition, comparing its performance with standard clinical methods.
MethodsTwenty presbyopic subjects (aged 52 to 64) participated in the study. Clinical measurements of sphero-cylindrical refraction and its correction was achieved using trial lenses. Addition was also clinically measured using a standard and a tentative method. A set of 12 trial lenses ranging from 0 to 2.75 D were randomly put on top of the far distance correction, generating the correction addition correction or different levels of under/over correction of the addition. Participants then used a smartphone-based app to subjectively determine binocularly their near point (NP) using a push-up method while looking at a blue stimulus that rescaled as a function of the face-device distance measured using the front camera of the device. For each induced level of under/over correction of the addition, participants completed three measurements of their near point.
ResultsLinear regression analysis showed a strong correlation (R² = 0.82) between app-measured and clinical addition values. Bland-Altman analysis revealed a mean over estimation of -0.22± 0.38 D with a limit of agreement of ±0.74 D of the near correction. Cumulative error analysis indicated that 61.7 % of app measurements were within 0.25 D of clinical values, and 82.5 % within 0.50 D
ConclusionsA smartphone-based subjective measurement of presbyopic addition can potentially be used to assess the addition needed to detect the under or over corrected addition in full presbyopic subjects.
The range of distances at which we can see clearly undergoes a continuous decline from birth until the mid-50 s,1 after which we become presbyopic (from the ancient Greek presbys+ops, "aged eye"),2 although most other physiological visual functions do not suffer such significant functional impairment.
Uncorrected refractive error in presbyopes represents a public health problem3,4 being the main cause of visual disability worldwide. Its prevalence is growing given that the world's population has been aging rapidly.5 Its correction has become more and more necessary due to the increased use of electronic devices such as mobile phones and tablets,6 even among the elderly.
Presbyopia is quantified by the addition, which represents the power required in an ophthalmic lens to compensate for the loss of crystalline lens power needed to see well near objects (i.e. a book) placed at a certain distance, in the emmetropic or distance vision corrected eye. This positive lens generates an image of the stimulus (S) in a position beyond the patient’s near point (NP) (see Fig. 1), allowing the patient to see the stimulus comfortably, that is without the need of a full accommodation.7 Usually, the position of the image is such that the patient only needs to use half of his/her amplitude of accommodation (AA) to see it well, keeping the other half unused for comfortability. Thus, the dioptric distance between the NP and the image of the stimulus (S’) generated by the addition corresponds to AA/2 (see Fig. 1). Thus, the power of the addition will then depend on the patient’s AA, very much related with patient’s age, as well as the distance to the stimulus (d in Fig. 1), related on the task the subject wishes to perform, and generally corresponds to 40 cm.
 placed a distant d from the eye, to place S’ beyond de patient’s NP, so it can be seen comfortably by using only the half of the patient’s amplitude of accommodation (AA).")
Optical effect of the addition lens in an emmetropic or distance vision corrected eye. The addition lens optically “moves” the stimulus (S) placed a distant d from the eye, to place S’ beyond de patient’s NP, so it can be seen comfortably by using only the half of the patient’s amplitude of accommodation (AA).
Since the corrected eye's AA corresponds to the inverse of the positive distance to the NP (Cli_NPw/o Add) expressed in diopters, that is the vergence of the near point (VNP), the clinical addition (Cli_Add) can be expressed as:

If the value of Cli_Add in Eq. (1) is negative, these additions would reduce the reserve power and the NP of an eye which does see clearly at near distances. Therefore, it is assumed that the eye does not need any addition for near vision. To leave the correction of the distance vision unchanged, the addition is usually added to the lower part of the ophthalmic lens as a discontinuous change in the power (bifocal lens) or a progressive vertical change of the power of the ophthalmic lens (progressive lens). Furthermore, if an emmetropic subject prefers to use single-vision lenses just for near vision (reading glasses), the Cli_NPw/o Add value in Fig. 1 would correspond to that of the naked eye (without any far vision correction), and the addition value in Eq. (1) would represent the power of the reading glasses. For individuals with distance vision ametropia who prefer near single-vision glasses, the required lens power should be determined by adding their distance refractive correction to their near addition.
Accommodation decline with age tends to be similar in all individuals, leading to the existence of tables of typical addition values based just on the age.7,8 However, there is a relatively large variability in the addition between subjects of the same age,9 which leads the tables to include a certain age-specific addition range.10 This variability is linked to the variability of each subject's AA, as shown by numerous classic studies.9,11 Although the origin of the variability is unclear, it is known, for example, that presbyopia generally appears at an earlier age in people living at latitudes closer to the equator. The physiological basis for this is early lens sclerosis (ERLS) caused by higher levels of UVA irradiation exposure.12 On the other hand, it has been recently observed that the depth of focus of the eye with paralyzed accommodation differs between subjects. The cause appears to be more related to subjective aspects than to the optics of the eye.13 Given that DoF is a form of pseudoaccommodation (ERLS) and is an important component of subjective AA in presbyopes, the intersubject variability in DoF would explain, at least in part, the dispersion found in AA measured in subjects of the same age.
In this context it seems that a personalized measurement of the position of the near point is necessary to accurately determine the extent of the addition of presbyopic subjects such that a reserve power would guarantee a comfortable near vision. Clinical personalized refraction assessments are typically conducted by eye care professionals in clinical settings, requiring the patient’s physical presence. The method usually employed in clinics to find the addition will be described in detail in the Methodology subsection and is based on the finding of the minimum power of the positive lens which enables us to see comfortably a stimulus usually placed at 40 cm.7,14 This method has the problem that the larger the power of the positive lens used, the larger the visual magnification, reducing the spatial frequency contained in the stimulus. A more practical method, known as “push-up method”,7,14 consists of the real movement of the optotype until the stimulus containing small letters cannot be read. One might think that this task can be performed without the help of a practitioner given that it only needs as an optotype and a ruler, as the is the case of the use of a RAF near point rule.15 However, there are two main problems: the first is that as the stimulus is approaching there is an increase in the angular size of the letters which makes it more difficult to know when they cannot be read; the second is that if the subject’s VA is unknown the subject might not know what letter size he/she should look at.
The high prevalence of uncorrected refractive error is primarily attributed to the shortage of eye care practitioners and the lack of optometric services in remote populations.4,16,17 Moreover, presbyopia is often correlated with increased physical frailty and functional impairment, which can hinder access to healthcare facilities. One possible approach to addressing the mobility challenges faced by older adults, such as financial limitations, costs associated with diagnostic services, and a shortage of facilities for assessing refractive errors, involves leveraging mobile technologies.4,17,18 Self-assessment of the addition using a smartphone and the push-up method mentioned above where no extra optics are needed, could provide a valuable alternative for vision screening. Fortunately, the advancements in mobile device technology have facilitated the development of innovative refractive assessment tools that can potentially be self-administered. These devices allow users to self-evaluate visual acuity,19,20 refractive errors20–22 and can be used for measuring the NP taking into account that actual smartphones are equipped with screens which allow the presentation of enough high spatial frequency stimuli at near distances. However, to our best knowledge, at the time of writing, no mobile device tool is available for addressing the needs of older patients in terms of monitoring changes in distance refraction and/or presbyopic addition to facilitate near vision.
The present study compared the standard clinical method for assessing presbyopic addition with measures derived from NPs obtained subjectively using a smartphone device.
MethodsThe study was conducted with the approval of the Ethics Committee at the University of Murcia, in adherence to the principles outlined in the Declaration of Helsinki.
ParticipantsTwenty presbyopic participants between 52 and 64 years (56 ± 3 years) were recruited for the study. The mean subjective refraction of the participants was 0.13 ± 1.23 D [−3.25D, +2.50D] (spherical equivalent) and the mean clinical addition was 2.20 ± 0.21 D [+1.75D, +2.50D]. In this age group the amplitude of accommodation (AA) is close to 0.00 D, with residual accommodation around 1.00 D, which is actually due to the depth of field (DoF) of the eye.7
Participants were excluded if they presented any ocular pathology that could significantly compromise visual acuity, including age-related macular degeneration (AMD), glaucoma, or any other retinal or optic nerve condition. Subjects with advanced cataracts or any history of recent ocular surgery were also excluded, as well as those who did not achieve a minimum clinical best-corrected visual acuity of 0.8 (20/25) in both eyes.
Of the total participants, 45 % were male and 55 % were female. The study included 20 presbyopic subjects in total: 10 habitual users of progressive addition lenses and 10 habitual users of over-the-counter reading glasses.
Clinical measurementsClinical measurements of subjective refraction and visual acuity (VA) at near were performed by an optometrist using a phoropter Topcon Visiontester VT-SE.
Firstly, each participant’s distance correction was determined using standard clinical subjective refraction guided by objective refraction (retinoscopy). The aim was to attain maximum positive visual acuity (MPMVA)23,24 using a Bailey Lovie chart displayed at a distance of 6 m on a properly callibrated Hanion l-1933 display. Peak display luminance was 230 nit, and VA chart Michelson contrast was 0.957. The ambient illuminance level in the room was measured at the plane of the eyes of the subjects with a luxmeter (HI 97500 Luxmeter, Hanna Instrument) and kept consistent between clinical measurements and app-based measurements at approximately 250 lx.
Then, for the clinical assessment of the addition (ClinAdd) an "add tentative method”23 was used which took into account the subject's age and allowed for adjustments according to the patient's working distance and AA. In this method, subjects wore their best distance correction. A near vision test was placed at 40 cm from the corneal vertex, and binocularly over the distance correction, positive spherical trial lenses of the same power were added to both eyes until the best VA was achieved, ensuring the optimal range of focus depending on their working distance. Subjects were asked to focus on a word with decimal VA = 0.8 and to bring the test closer to their eyes until it became blurry. Then, they were asked to move it further away until it became blurry again after an interval of clear vision. The investigator chose the addition that provided the greatest interval of clear vision. This value was measured once per subject. This method was selected due to its documented accuracy and patient satisfaction, as demonstrated by Hanlon et al.25
App measurementsThe NP distance was measured using a custom app developed by VisionApp Solutions S.L. (Murcia, Spain). The app operated at a frequency of 20 Hz continuously monitoring the distance between the subject's face and the device using images captured by the device's front-facing camera. It displayed on-screen visual stimuli, with their color set to blue in order to take advantage of the longitudinal chromatic aberration (LCA) of the human eye.26 Notably, the human eye experiences a significant level of LCA between blue and white light. The NP for blue light was empirically found to be approximately −0.70 D more negative than that for white light.27 This consistent natural refractive disparity observed across human subjects26 can be leveraged by modern smartphones with bright screens emitting broadband light.28 As a result, these displays enable the subjects to find a blue near point (NPb) by situating the device at a nearer distance than what would have been the case for the white near point (NP) (Fig. 2). This facilitates the use of mobile devices at relatively nearer distances for monitoring VA and monitoring refractive errors.20
 allowing the eye to form a clear the image on the retina again.")
An illustration of the benefit of using blue visual stimuli to avoid impractically far face-device distances. In the top panel an emmetropic eye forms an image of a white stimulus placed far away on the retina. In the middle panel the stimulus color is just changed to blue, and the same eye forms a blurred retinal image similar as a 0.7D myopic eye. In the bottom panel the object is brought closer to the same eye, to a distance of 1.42 m (vergence of −0.70 D) allowing the eye to form a clear the image on the retina again.
The on-screen visual stimuli consisted of three parallel, vertical blue lines drawn on a black background (Fig. 2). The width of each of the three lines and of the space between them was adjusted in real time based on the current face-device distance. This ensured that the lines consistently subtended the same angular size from the point of view of the subject. The width of each of the lines was 4 times the width of the space between the lines. The space between the lines (BS in Fig. 3a) subtended an angle of 1 / (0.8 * VA) ″utes, where VA was the subject’s clinical decimal VA.
Experimental procedure
A Samsung Galaxy™ S20 FE device with a 6.50-inch screen, an organic light-emitting diode (OLED) screen and 405 dots per inch (dpi) pixel density was mounted on a tripod and used with all subjects. The luminance of the blue lines (Fig. 3) was 25 nit and was kept constant during the measurements by inhibiting the automatic change of the screen illumination of the smartphone. The device was adjusted to be on the eye level and perfectly upright (not tilted in any direction). Each subject was corrected using trial lenses as described previously (see “Clincal measurements”).
As a preliminary step, a face-device distance measurement calibration was performed where each subject maintained a calibration distance of 30 cm from the device as indicated by a ruler and confirmed by pressing a button. Further details of the calibration process were described elsewhere.29,30 Subjects sat in an office chair with wheels which facilitated smooth and accurate changes in face-device distance.
While each subject wore its best distance correction in a trial frame, a set of positive trial lenses with powers ranging from +0.00 D to +2.75 D (IndPower) in 0.25 D steps (a total of 12 lenses), were placed on top. The optical effect of these lenses was to optically make the stimulus which is closer than the NP (NPw/o add in Fig. 1) to move away to make it match with the NP (NPw/o add in Fig. 1) of the eye when it is just using part (usually half) of its amplitude of accommodation. Thus, when the trial lens used corresponded to the clinical addition (ClinAdd) (Eq. (1)) the subject would be perfectly corrected, while if the power of trial lens is different from ClinAdd, the subject would have an over addition (IndOverAdd). Note that this over addition can be either a deficit (IndOverAdd > 0) or an excess (IndOverAdd < 0) of the addition really needed.
In this manner, the value of the induced over addition (IndOverAdd) corresponded to:

For instance, if the clinical addition is two diopters (ClinAdd = 2 D) and the trial lens has a power of 1.25 D (IndPower = 1.25 D), the subject will have his presbyopia under corrected by a mount of 2–1.25 D = 0.75 D, which correspond to the IndOverAdd value using Eq. (2).
Trial lenses selected at random were inserted in the trial frames on top of the subject’s distance correction. A different researcher, independent of the one conducting the study, concealed the lens powers by assigning randomized numbers from 1 to 12 to each of the 12 lens powers used. Neither the subjects nor the researcher conducting the study knew the power of the lenses (double-blind study).
The subject was wearing his best distance correction using a trial frame. Then, using the office chair, he moved away to a distance of 1.42 m (equivalent to a target vergence of −0.70 D in white light) from the device's screen. This configuration considered a LCA of −0.70 D for blue stimuli resulting in a blue light vergence consistent with 0.00 D for white light in the retinal plane (similar to the vergence of −0.166 D experienced clinically at 6.00 m). The subjects were then asked to confirm whether they could resolve the three blue lines in the on-screen stimulus. Next, the researcher induced different degrees of IndOverAdd using positive trial lenses.
For each trial lens, three measurements of NPb were obtained with the app, so a total of 36 measurementas were obtained for each subject. Subjects were guided by the app’s interface instructing them to adjust their face-device distance by moving closer until they could only perceive a single blue blurred line (Fig. 3b) and then move away until they could first perceive the three lines distinctly (Fig. 3a) and confirm by pressing a button. When the subjects confirmed, their distance representing the blue NP was recorded by the app. A minimum distance of 0.20 m was established as a lower limit to avoid face detection problems (due to the face visual angle being larger than the field of view of the camera) and pixel size problems (difficulties to render high spatial frequency Figs. due to dpi limits).
Presbyopic addition calculation and data analysisThe mean value of the three measurements of the NPb obtained when using the same IndPower was used to compute the app value of the over addition (AppOverAdd) using the following equation:
where: 2.5 D corresponds to the ideal near viewing distance of 40 cm; NPb is the positive distance in meters between corneal vertex and the device position; −0.7 D corrects the increases of the vergence of the blue stimulus due to the ocular LCA; and AA is computed from the relation between age and the AA obtained by Duane31 where the mean DoF found beyond 52 years, corresponding to 1 D have been substracted. This way the second term of Eq. (3) is basically equal than the second term in Eq. (1). The main difference between Eq. (1) and 3 is the interpretation of the negative reuslts. While in the case of Eq. (1) a negative results is interpreted as the person does not need any addition, in our study a negative value after using Eq. (3) will be interpreted as over correction of the presbyopia.
To determine the accuracy and precision of the app when evaluating the potential over or under corrected addition, the value obtained by Eq. (3) of AppOverAdd, will be compared with the induced value of over or under corrected addition IndOverAdd (Eq.2). For this comparison, a linear regression analysis and a Bland-Altman analysis will be performed. The inter and intra-subject standard deviation (SD) and the coefficient of determination R2. Finally, AppOverAdd will be calibrated using a reverse quadratic regression32 and a 50–50 hold-out cross-validation.33 This reverse regression aims to minimize quadratic errors in OverAdd, while the hold-out technique ensures that the results remain replicable on independent future data. The goal is to fine-tune a formula that best predicts IndOverAdd from the app measurement data. With the callibrated outcomes, we will also peform linear regresion, Bland-Altman and a cumulative distribution of errors analysis. The RStudio v.2022.7.2.576 program was used for statistical analysis.
ResultsIntra-subject variability was assessed by comparing the three Near Point measurements of each subject in terms of vergence magnitude. Specifically, pairwise comparisons were performed between the first and second measurements, the first and third, and the second and third. The results are presented in Table 1.
Bland-Altman analysis results from the comparison of the three Near Point measurements in vergence for each subject.
| Comparison | Mean [SD] (D) | LOA (D) | |
|---|---|---|---|
| +1,96SD | −1,96SD | ||
| 1 vs 2 | −0.02 [0.21] | 0.41 | −0.43 |
| 1 vs 3 | 0.00 [0.21] | 0.42 | −0.42 |
| 2 vs 3 | 0.02 [0.18] | 0.38 | −0.34 |
*Mean [SD] = average of the difference between AppOverAdd and IndOverAdd [Standard Deviation]; LOA = Limits of agreement; +1.96SD = Mean+1.96*Standard Deviation; +1.96SD = Mean-1.96*Standard Deviation.
Fig. 4 shows an inter-subject linear fit between the induced and app-measured over addition (IndOverAdd and AppOverAdd, respectively). A positive value in the x-axis represents a under correction of the clinical addition whereas a negative value represents an overcorrection of the addition. The coefficient of determination, R2, indicates that both measures are highly correlated and significant (p < 0.001).
, the black line represents a 1:1 relation. Error bars represent ±1 SD within subject.")
Over addition measured by the app for different clinically induced over addtion values. Linear regression analysis including the 3 repeated measures of AppOverAdd and a IndOverAdd. The red line represents a mean fit across all subjects (intersubject), the black line represents a 1:1 relation. Error bars represent ±1 SD within subject.
Most AppOverAdd values in Fig. 4 are above the 1:1 line, indicating that the app overestimates the induced over addition. For example, a presbyope of 2.25 D corrected with an addition lenses of 2.00 D, would have a induced over addition of 0.25 D, meaning that he/she needs 0.25 D addition to be perfectly corrected. However, the app could give a result of about 0.50 D, meaning that the user should have a 2.50 D addition correction, which would lead to an excess of power of 0.25 D Several factors could be responsible of that overestimation which will be discuss in the next section.
In order to have more accurate OverAdd predictions, AppOverAdd was callibrated using a quadratic reverse regression34 and a 50–50 hold-out cross-validation.33 The dataset was randomly split into training and test sets, being the formula trained on the former, and applied to the latter. The employed callibration formula turned out to be the following:

Fitted test data (Adjusted AppOverAdd) is shown in Fig. 5 as well as a linear regression against IndOverAdd, being this correlation significant (p < 0.001). This adjustment slightly improved the coefficient of determination.
, the black line represents a 1:1 relation, and error bars represent ±1 SD within subject.")
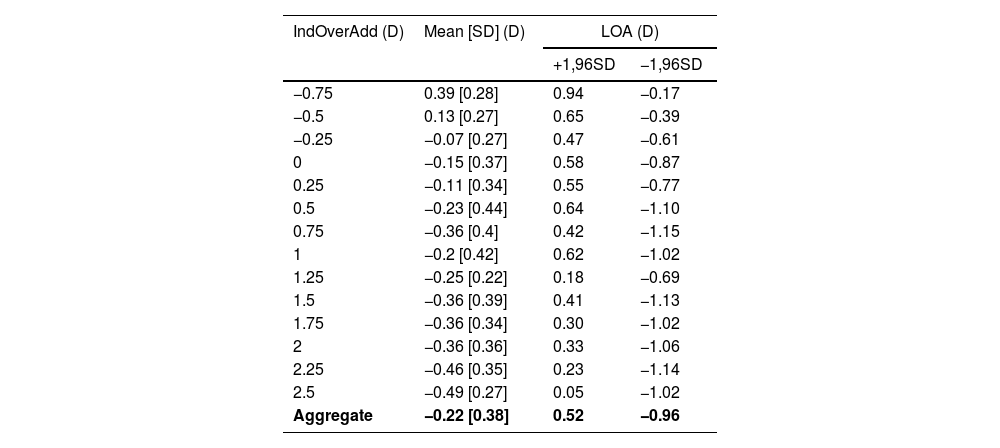
Fig. 6 shows a Bland-Altman analysis of the data shown in Fig. 4 showing the differences between the adjusted over addition measured by the app and the induced clinical values. The mean difference is −0.22 ± 0.38 D, with limits of agreement (LOAs) of 0.52 D and −0.96 D The mean difference and LOAs for each induced over addition are shown in Table 2.
. A positive value in the Y-axis represents a under estimation of the measured performed by the app of the addition needed for the correction of near vision.")
Bland-Altman plot of 3 repeated measures of AppOverAdd. Each color represents a IndPower, from left to right from 0.00 D to 2.75 D in steps of 0.25 D The solid black line represents the mean of all differences and the dashed black lines the LOAs (± 1.96SD). A positive value in the Y-axis represents a under estimation of the measured performed by the app of the addition needed for the correction of near vision.
Results of the difference between over addtion values given obtained the app (Adjusted AppOverAdd) and the one induced clinically (IndOverAdd) for each IndOverAdd.
*IndOverAdd = induced over addition; Mean [SD] = average of the difference between Adjusted AppOverAdd and IndOverAdd [Standard Deviation]; LOA = limits of agreement; +1.96SD = Mean + 1.96 * Standard Deviation;
−1.96SD = Mean - 1.96 * Standard Deviation; Aggregate = results obtained withouth splitting by IndOverAdd (D).
Fig. 7 shows the cumulative distribution of the differences between the induced over addition and the over addition found by the app after adjustment. In 20 % of the measurements the app finds the exact clinical value of the over addition, and the maximum difference was 1 D
Discussion
A preliminary evaluation of the precision and accuracy of a non-commercial app to measure NP and presbyopia is presented. The app methodology is based on the push-up method, but with two main differences from the clinical method. The first is the use of stimuli with blue color to have closer Near Point distances. This avoids the need of the subject to be placed far away from the device, so that these measurements can be done handheld. The second is the rescaling of the stimulus in real time based on the current face-device distance, which ensures the stimulus consistently subtends the same angular size. The app NP results show good intra subject repeatability (mean ± SD differences between repetitions range from −0.02±0.21 D to 0.02±0.18 D, see Table 1) in agreement with other values obtained of near point measured with other techniques.35 However, the inter subject values of the addition show a much large disperson (Fig. 4), which are also expected taking into account the large dispersion between in the AA measurements obtained in subjects with the same age, as mentioned in the Introduction.9,11
Fig. 4 also shows overestimation of the OverAdd measurement made by the app, if using Eq. (3). Although AA used in Eq. (3) was obtained from Duane’s relationship, it should be noted that due to the range of ages of the subjects measured, it merely corresponds in this study to pseudoaccommodation or depth of field, representing an approximate value of 1.0 D for all subjects. Thus, in Eq. (3) the AA term could be considered a constant value for this specific presbyopic range of ages.
Regarding why the AppOverAdd results do not match exactly the IndOverAdd results, having some bias instead, four possible factors arise. The first is related to the fact that the stimulus does not rescale in the clinical method, so a closer near point can be expected in the clinical method than in the app, as spatial frequencies tend to decrease as the stimulus is closer. This is consistent with the AppOverAdd overestimations of IndOverAdd. The second is related to the fact that the app measures the face-device distance and maintain visual magnification at one by rescaling the stimulus, while in the clinical method the use of positive lenses at certain distance from the corneal plane (about 2 cm in the case of the trial lenses and about 3 cm for the case of a phoropter increases the visual magnification.36 For example, using a phoropter with a positive lens of 2 D (assumed as a thin lens) placed at 3 cm form the corneal vertex, the paraxial visual magnification of a test placed at 40 cm from the phoropter is 1.04. In that case an apparent increase of 4 % of the stimulus could be expected allowing the subject to need a lower addition than the case where no magnification is presented (app measurements), in agreement to the results found (Fig. 4). Third factor is realted to the ammount of accomodative reserve used un Eq.3, AA/2. It is also common to have (2/3)*AA of accomodative reserve.24 In that case Eq. (3) should have a AA/3 term instead of a AA/2 term, as it comes from the subtraction of the AA minus the accomodative reserve (2/3)*AA. Therefore, this would lead to less positive results, which would result in a smaller overestimation of OverAdd. Finally, the face-device distance measurements which are used to obtain the NP distance are obtained with respect to the plane of the subject’s eyes. Clinical presbyopic addition is usually defined with reference to the spectacle plane, which may account for a small part of the total error.
All those potential factors that may slightly influence the over-addition measured by the app are optometric reasons that support the need for an empirical calibration using a reliable standard method. In fact, after such calibration, the app’s results improved slightly, with the R² increasing from 0.77 (Fig. 4) to 0.82 (Fig. 5). The Bland-Altmann analysis (Fig. 6) of adjusted data reveals that the mean difference (bias) between the clinical and app measurement methods was −0.22 ± 0.38 D with LOA of ±0.74 D (Fig. 6 and aggregate values in Table 2). This bias value represents an overestimation with respect to induced values of over addition (IndOverAdd). The overestimation was found to increase slightly for bigger values of uncorrected addition (see Table 2 and Figs. 5 and 6). One possible explanation for this increase could be the decrease in the DoF in presbyopes at near distances.7 In the particular case of a perfectly clinically corrected addition (IndOverAdd = 0 D, Fig. 5), a small mean over estimation of 0.15± 0.27 D (see Table 2) was obtained by the app after calibration. Antona et al. when comparing 7 different clinical methods found a mean value of bias of 0.13 D with a range of [0.007, 0.34 D], and a mean value of LOA of ±0.67 D with a range of [0.52, 1.02].
It is important to point out that the measurements described in the present article has been carried out in healthy subjects, without ocular or even systemic pathologies (diabetes, macular degeneration, etc.) which could alter the results.37,38 Moreover the visual acuity, which define the spatial frequency of the stimulus (Fig. 3A), has been determined by the observer in this study, but in normal conditions the subject should be able to measure it by himself. Several apps allow measurement of the VA with satisfactory results,19,20,39,40 so a full procedure that includes the VA and near point measurement should be feasible.
Another limitation of the present study is the number of subjects participating in it and the relative narrow range of ages where there were no pre-presbyopes. Although the AA used in Eq. (3) was obtained from Duane’s relationship, its value is basically a constant whithin the range of ages analyzed corresponding to about 1 D, which basically represent the depth of field of the eye older that 52 years. Further studies should be done in a large range of ages that includes pre-presbyopes as well as full presbyopes, to see if the calibration equation (Eq. (4)) is still valid.
Regarding the stimulus, using three parallel lines in a single orientation limits the measurement of the refractive change in the perpendicular direction, so refractive changes of astigmatism would not be detected. Some subject may also have a problem deciding when the two black lines are not visible (Fig. 3). Moreover, some configurations of eye aberrations may produced monocular polyplopia41 and the subject may still see two or more black lines corresponding to gaps between images, although their stimulus is closer than the clinical near point. Studies using other types of stimuli that make the task easier for to the naïve subject could be of great interest.
In conclusion the study demonstrates that presbyopia and its over or under correction can be determined using a technology based in the used of smartphone in full presbyopes (patients with ages above 52 y.o.). This technology offers a promising tool for remote monitoring of presbyopia allowing, for instance, the loss of near vision for a potential increase of the presbyopia or the control of the near vison after a cataract surgery. Moreover, the technology can be especially useful, especially for elderly individuals with mobility issues and limited access to eye care services.
FundingNone
N López-Gil: cofounders, patent author and consultant of VisionApp Solutions
M Jaskulski: cofounders, patent author and employee by VisionApp Solutions
RM Salmerón-Campillo, G Martinez-Ros and JA Diaz-Guirado: employee by VisionApp Solutions
Our sincere thanks to Cristina Olivares from Centro Óptico San Roque for her assistance in supplying the optometric materials required for the measurements in this study. We are also very thankful to the anonymous reviewers who have contributed significantly to a better understanding of this report.


