


To compare Placido disc-based and scanning slit topography in the evaluation of corneal power changes after PRK.
MethodsThe changes in corneal power, evaluated with an Orbscan II utilizing both Placido disc-based and Scanning Slit topography, before and 1, 3 and 6 months after PRK were compared with refractive changes in 109 individuals (149 eyes) who underwent photorefractive keratectomy (PRK) with a sphero equivalent refraction, calculated at the corneal apex, ranging from -0.25 to -12 D (mean -4.58±2.54 D).
Results1,3 and 6 months refractive changes showed a good correlation with changes in BFS (r2=0.64, r2= 0.53, r2= 0.62, respectively); in Sim K's (r2= 0.77, r2= 0.8, r2= 0.78, respectively) in Mean Power 3mm (r2= 0.81, r2= 0.88, r2= 0.87, respectively) in Mean Power 5mm (r2= 0.68, r2= 0.78, r2= 0.78, respectively) in Anterior Mean Power 3mm (r2= 0.88, r2= 0.85, r2= 0.85, respectively) in Anterior Mean Power 5mm (r2= 0.75, r2= 0.7, r2= 0.75, respectively) in Total Mean Power 3mm (r2= 0.75, r2= 0.71, r2= 0.79, respectively) in Total Mean Power 5mm (r2= 0.75, r2= 0.71, r2= 0.78, respectively). However, all differences were statistically significant (P<0.001).
ConclusionThe data obtained with the scanning slit system seem to be more reliable, but need correcting factors to improve their precision.
Comparar la topografía corneal basada en discos de Plácido con la basada en el barrido con rendija para evaluar la variación de potencia corneal tras PRK.
MétodosSe midió la variación de la potencia corneal tras queratectomía fotorrefractiva (PRK) en 109 sujetos (149 ojos, equivalente esférico calculado en el vértice corneal comprendido entre -0,25 D y -12 D; media ± SD = -4,58±2,54 D) mediante un Orbscan II, utilizando tanto topografía basada en discos de Plácido como topografía basada en el barrido con rendija. Las medidas se realizaron tanto antes como transcurridos 1, 3 y 6 meses de la operación de PRK. Los resultados se compararon con el cambio en la refracción de dichos sujetos.
ResultadosTranscurridos 1, 3 y 6 meses, se observó una buena correlación entre el cambio en la refracción y la variación de cada una de las siguientes magnitudes: BFS (esfera con el mejor ajuste) (r2= 0,64; r2= 0,53; r2= 0,62 respectivamente), Sim K (queratometría simulada) (r2= 0,77; r2= 0,8; r2= 0,78 respectivamente), Potencia Promedio 3mm (r2= 0,81; r2= 0,88; r2= 0,87 respectivamente), Potencia Promedio 5mm (r2= 0,68; r2= 0,78; r2= 0,78 respectivamente), Potencia Promedio Anterior 3mm (r2= 0,88, r2= 0,85, r2= 0,85 respectivamente), Potencia Promedio Anterior 5mm (r2= 0,75; r2= 0,7; r2= 0,75 respectivamente), Potencia Promedio Total 3mm (r2= 0,75; r2= 0,71; r2= 0,79 respectivamente) y Potencia Promedio Total 5mm (r2= 0,75; r2= 0,71; r2= 0,78 respectivamente). Sin embargo, todas estas diferencias resultaron ser estadísticamente significativas (P<0,001).
ConclusionesLos datos obtenidos con el sistema de barrido con rendija parecen ser más fiables, pero es necesario aplicar factores de corrección para mejorar la precisión de los mismos.
The most important task in the field of refractive surgery is to find a reliable method to accurately assess the corneal refractive power after excimer laser procedure, as it could be used in several cases. For instance, it could effectively explain if an under- or hyper-correction, following corneal refractive surgery, is due to a mistake in taking the refraction before surgery or to the excimer laser calibration. Moreover, it could be useful in calculating intraocular lens (IOL) power in patients who previously underwent refractive surgery.1,2
So far, different devices such as videokeratography,3-7 manual keratometry,8 and automated keratometry9 have been tested, but all these studies, even if with some slight differences, have shown that these devices do not reflect the effective refractive changes, with an underestimation of the refractive changes that increases as the correction becomes higher.
Orbscan II (Bausch & Lomb, Rochester, NY) utilizes two different systems, namely Placido disc and scanning slit. For this reason it should be considered a tomography, as tomos is a Greek word which means “a section”, “a slice”.
We decided to perform a study to establish which of the power changes calculated with this device is closer to and better predictive of the manifest refractive changes after photorefractive keratectomy (PRK).
MethodsOne hundred and nine consecutive patients (47 males and 62 females), with ages ranging from 18 to 56 years (mean =31.01 + 7.77 years), and who had undergone PRK for myopia and/or myopic astigmatism at our Department were enrolled in this prospective study. Only one hundred and forty-nine eyes were treated, because the other 69 eyes either had been previously treated or did not need refractive surgery. The preoperative refraction, calculated at the corneal apex as spherical equivalent (SEQ), ranged from -0.25 to −12 D (mean= -4.58±2.54 D).
The research protocol adhered to the tenets of the Declaration of Helsinki and all study participants signed an institutional-review-board-approved informed consent.
Preoperative and follow up examinations at 1, 3, and 6 months included detailed ophthalmic examination with manifest refraction, and assessment of the corneal power with an Orbscan II. In particular, eight parameters were examined, namely: Best fit sphere (BFS), 3mm anterior (3 AMP) and total (3 TMP) mean power, 5mm anterior (5 AMP) and total (5 TMP) mean power, simulated keratometry (Sim K), mean power in the 3mm (3 MP) and in the 5mm (5 MP) zone. Sim K, BFS, 3 MP and 5 MP were derived from Placido measurements, whereas the remaining parameters were derived from slit-scan measurements.
BFS, 3mm AMP, 5mm AMP, Sim K, 3mm MP, 5mm MP are automatically generated by the machine, while we calculated the TMP at 3 and 5 mm by adding the values of the 3mm and the 5mm anterior mean power map to the 3mm and the 5mm posterior mean power map, respectively.
Although we are aware that this is not the correct way to calculate the total mean power, as it does not take into account the corneal thickness, it is an objective way that is not influenced by the operator; besides, the contribution of the corneal thickness to the formula (to the total value) is usually less than 0.1 D; thus, this term can be neglected for clinical purposes.10
Patients were asked to discontinue wearing contact lenses for at least 1 month before undergoing the last evaluation, which was performed a few days before the PRK treatment.
Patients with systemic and ocular diseases that could potentially interfere with the healing process of the cornea or with the refractive outcome (such as diabetes, collagenopathies, dry eyes, uveitis, corneal and lens opacities or glaucoma) were excluded from the study.
Treatment of the sphere and cylinder was performed by combining objective and subjective refractions, thereby achieving the best-corrected visual acuity. Cycloplegic refraction was determined during the first visit, whereas subjective refraction was determined during the last visit before surgery, taking into account the cycloplegic refraction results. When a discrepancy between these 2 methods was identified, a red– green test was performed, and this was the final refraction. All treatments were performed in our usual way,11 under topical anesthesia with oxybuprocaine (Novesina® Novartis Farma, Italy) eye drops. The eyelids were kept open with a speculum, the epithelium was debrided with a mechanical epithelial brush, and Nidek EC 5000 excimer laser operating in scanning mode was used in all treatments, utilizing a multipass multizone approach. The number of ablation zones was related to the amount of treatment, with the tendency to apply more ablation zones for higher levels of treatment.
After the refractive treatment a phototherapeutic keratectomy (PTK) was performed by placing 1 drop of a 0.04% hyaluronic acid solution over the cornea, and spreading it out with a 23 gauge cannula. In this way, the fluid was filling eventual depressions of the cornea, thus protecting the tissue from the laser pulse. At this point a PTK treatment was performed and the endpoint of the smoothing was chosen on the basis of microscopy and of clinical evidence.12 A bandage contact lens was applied under sterile conditions on the treated eye immediately following surgery, and was left until complete re-epithelialization. During this period, the treated eyes received the following medication: Diclofenac sodium 0.1% eye drops twice a day for the first 2 days, nethylmicin preservative-free eye drops until re-epithelialization and preservative- free artificial tears for 1 month; after re-epithelialization clobetasone eye drops were prescribed to all patients for 1 month in a tapered dose, as follows: one drop four times daily for the first week, one drop three times daily for the second week, one drop twice daily for the third week, and one drop once a day for the last week.
To determine the correspondence of refractive changes to power changes at the corneal plane, subjective refraction with spectacle was obtained before and after PRK and the difference was measured as SEQ and calculated for the corneal plane using the following formula: SEQ corneal plane = SEQ spectacle plane / [1-(0.012 * SEQ spectacle plane)].13,14
These values were compared with the difference in corneal power obtained with the Orbscan II.
The refraction and the Orbscan II analysis were performed by two independent observers.
The correlation between the refractive (subjective) and the measured corneal power changes were assessed by linear regression analysis and Bland – Altman correlation, the significance of the differences was evaluated using Student-T Test. Analyses and graphs were obtained using Microsoft Excel 7 (Microsoft Corp., Seattle, WA, USA).
ResultsAfter PRK all the evaluated parameters yielded a statistically significant underestimation of the corneal refractive power changes, compared to the differences in refraction (subjective measurements) calculated at the corneal plane. The difference was more evident for the values obtained at 5mm with both methods, whereas at 3mm the difference was more evident with Placido. BFS and all the 5mm measurements showed a proportional error that increases with the treatment; on the contrary, this finding in not present with the 3mm measurement (Table 1 and Figures 1-8). This underestimation was less evident for 3 TMP and for 3 AMP (Figures 1, 4).
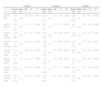
Differences, correlation index and statistical significance value between achieved corrections, calculated at the corneal plane (Ref CP) and the differences calculated with the Orbscan II at the 1-, 3- and 6-month follow up
| 1 month | 3 months | 6 months | |||||||||||||
| Range (D) | Mean (D) | SD | r2 | P | Range (D) | Mean (D) | SD | r2 | P | Range (D) | Mean (D) | SD | r2 | P | |
| Ref CP - BFS | -9.97 to +0.85 | -3.56 | 2.26 | 0.64 | <0.001 | -10.53 to +2.53 | -3.35 | 2.18 | 0.53 | <0.001 | -10.51 to +2.83 | -3.35 | 2.03 | 0.62 | <0.001 |
| Ref CP – Sim K's | -10.9 to +6.7 | -0.77 | 1.7 | 0.77 | <0.001 | -10.1 to +3.8 | -0.74 | 1.49 | 0.8 | <0.001 | -10.1 to +4 | -0.81 | 1.48 | 0.78 | <0.001 |
| Ref CP – 3 MP (Placido) | -10.91 to -0.42 | -1.01 | 1.31 | 0.81 | <0.001 | -7.89 to +0.4 | -1.06 | 1.07 | 0.88 | <0.001 | -5.9 to +0.82 | -1.07 | 1.07 | 0.87 | <0.001 |
| Ref CP – 5 MP (Placido) | -8.27 to +3.45 | -2.56 | 1.95 | 0.68 | <0.001 | -8.93 to +0.56 | -2.43 | 1.71 | 0.78 | <0.001 | -9.01 to +0.53 | -2.48 | 1.63 | 0.78 | <0.001 |
| Ref CP – 3 AMP (Slit) | -6.31 to +2.18 | -0.58 | 1.06 | 0.88 | <0.001 | -7.39 to +1.16 | -0.59 | 1.09 | 0.85 | <0.001 | -5.5 to +2.4 | -0.56 | 1.01 | 0.85 | <0.001 |
| Ref CP – 3 AMP (Slit) | -6.11 to +2.68 | -0.3 | 1.48 | 0.87 | 0.003 | -7.09 to +1.26 | -0.27 | 1.05 | 0.86 | 0.005 | -4.21 to +2.3 | -0.25 | 0.92 | 0.87 | 0.0045 |
| Ref CP – 5 AMP (Slit) | -7.8 to +1.35 | -2.25 | 1.79 | 0.75 | <0.001 | -8.33 to +0.86 | -2.11 | 1.72 | 0.7 | <0.001 | -8.51 to +1.10 | -2.11 | 1.52 | 0.79 | <0.001 |
| Ref CP – 5 AMP (Slit) | -7.57 to +1.35 | -2.15 | 1.76 | 0.75 | <0.001 | -8.23 to +0.66 | -2 | 1.67 | 0.71 | <0.001 | -6.41 to +1.1 | -2.01 | 1.48 | 0.79 | <0.001 |
SD: standard deviation; r2: coefficient of determination; P: statistical significance.
 and the difference (y-axis) in diopters between achieved corrections, calculated at the corneal plane (Ref CP) and 3mm TMP changes at 6 months follow up are displayed according to Bland & Altman plot. r2=0.112")
 and the difference (y-axis) in diopters between achieved corrections, calculated at the corneal plane (Ref CP) and BFS changes at 6 months follow up are displayed according to Bland & Altman plot. r2=0.822")
 and the difference (y-axis) in diopters between achieved corrections, calculated at the corneal plane (Ref CP) and Sim K changes at 6 months follow up are displayed according to Bland & Altman plot. r2=0.141")
 and the difference (y-axis) in diopters between achieved corrections, calculated at the corneal plane (Ref CP) and 3mm AMP changes at 6 months follow up are displayed according to Bland & Altman plot. r2=0.165")
 and the difference (y-axis) in diopters between achieved corrections, calculated at the corneal plane (Ref CP) and 5mm AMP changes at 6 months follow up are displayed according to Bland & Altman plot. r2=0.622")
 and the difference (y-axis) in diopters between achieved corrections, calculated at the corneal plane (Ref CP) and 5mm TMP changes at 6 months follow up are displayed according to Bland & Altman plot. r2=0.614")
 and the difference (y-axis) in diopters between achieved corrections, calculated at the corneal plane (Ref CP) and 5mm MP changes at 6 months follow up are displayed according to Bland & Altman plot. r2=0.717")
 and the difference (y-axis) in diopters between achieved corrections, calculated at the corneal plane (Ref CP) and 3mm MP at 6 months follow up are displayed according to Bland & Altman plot. r2=0.374")
Placido disc and scanning slit are based on two different ways of acquiring the images.
Placido disc-based corneal topography calculates corneal power by measuring the size of the projected rings reflected on the anterior corneal surface and by converting the image size into radius of curvature or dioptric power by using three curvatures: the axial, the meridional and the refractive curvature.6
In the slit scan system, a slit is projected sequentially onto the cornea from a 45 degree angle. The reflection obtained from the cornea, iris and lens provides 40 interlaced images for computer analysis. The slit beam edge reflection, analyzed in 40 images at the level of the anterior and posterior corneal surfaces are used to calculate elevation and thickness maps.15
Several authors utilized Placido disc-based corneal topography to compare refractive changes and corneal power changes,3-8 by using the axial curvature,3,4,5,7 the meridional curvature, or by comparing the data obtained with different curvatures.
The results of these studies were not univocal
Hersh et al.5 found a tendency to overestimate achieved refractive correction by the topography map for myopia corrections of 5 diopters or less, and a tendency to underestimate refractive corrections greater than 5 diopters. This was done by correlating the achieved spherical refractive correction and the topography power changes at the ablation center, pupil center and point of greatest power changes on the map. Moreover, the values obtained at the three zones correlated poorly with the achieved spherical equivalent refractive correction.
Rosa et al.,7 in determining the correlation between the achieved refractive correction and the topography power changes at the ablation center, at the vertex normal with axial curvature and within the 3mm pupil zone (Effective Refractive Power), found in all the evaluated points a mean underestimation of about 25 to 30%, being greater in cases of higher corrections.
Peter et al.,8 utilizing the meridional curvature, found an underestimation between the achieved spherical refractive correction and the topography power changes that increased with the amount of myopic correction, with a statistically significant difference.
Hugger et al.6 found a close correlation between 14 corneal topography parameters and the refraction, with the exception of instantaneous simulated keratometry, but they suggested that further evaluations should be carried out, as this study had been performed only in 27 eyes, and only 1 month after refractive surgery (when there might be a greater amount of irregular astigmatism) and later, when wound healing changes could alter this relationship.
Rosa et al.,16 in another study evaluating 6 different measurements, they have shown that the topographic indices showing the closest correlation to change in dioptric power are those averaging power values over a wide measurement area (on more data points) and making axial assumptions, even if all the available parameters did not effectively reflect the changes in corneal powers after refractive surgery.
Different explanations have been described trying to explain these findings:
Hersh5 suggested that the poor correlation he found was due to: 1) a wide “blend zone” toward the periphery of the ablation zone, 2) the fact that the central power is not actually measured, but is interpolated from the central rings, and 3) that the topography unit measures corneal plane power whereas refraction measures, effectively, refer to the spectacle plane.
Rosa et al suggested that the good correlation found in their study may reflect the fact that they used fairly large ablation zones, and so the device did not measure enough corneal surface outside the ablation zone.7,9
The reason of this underestimation could be the use of an invalid refractive index (1.3375) used to calculate the difference in power. For this reason, some authors suggest using a refractive index (n) of 1.376, while others suggest a higher value n= 1.4083,6,17 or a treatment-related refractive index.18 Unfortunately, so far no agreement has been reached regarding which refractive index is to be used.
The evaluation of corneal power changes after corneal refractive surgery with Orbscan has been performed by few authors.
Sonego-Krone et al.,19 with this device, evaluated measurement zones ranging from 1.0mm to 6.0mm at steps of 1-mm. They found that the total – mean power map, derived at 2.0mm, best reflects the keratometric power of the LASIKinduced corneal changes.
Cheng et al.20 measured the anterior and posterior corneal surfaces to calculate the effective corneal power using the Gaussian optics formula. A high correlation was found between these measurements and the induced refractive changes.
Gelander21 found a high degree of underestimation for the 3.0mm and 2.5mm measurement zones. Meanwhile, a high degree of overestimation was obtained for the 1.0mm measurement zone. The 1.5mm and 2.0mm measurements zones were more balanced, but both predicted a tendency toward overestimation, and concluded that mean power of the cornea at 1.5mm was the parameter that seemed to be more reliable.
In our study we found that the measurements performed at 5 mm with either method showed a greater difference, compared to the values obtained at 3 mm. These findings confirm those of Sunego-Krone et al.,19 who found the smaller measurements zone to be more reliable then the larger one, which could be explained by the fact that larger zones include the blend zone towards the periphery of the ablation zone.
On the other hand, among the 3mm measurements, the 3 AMP and 3 TMP values obtained with slit seem to be more reliable than the 3 MP ones obtained with Placido. These findings support the hypothesis that Placido disc-based measurements are not reliable after corneal refractive surgery, a fact that may be related to the refractive index used, whereas those based on the elevation22 seem to be more reliable.
In conclusion, even if slit measurements seem to be slightly more reliable compared to Placido disc-based ones, they also need to have correcting factor applied to reliably reflect the refractive changes after PRK, maybe for the same reasons involved in the non-reliability of Placido disc-based systems.
No author has a financial or proprietary interest in any material or method mentioned, and none of them received financial support for this study.


