


To assess how different corneas respond to a standardized structural weak spot in different sizes and locations using the finite element method depending on their initial geometry.
MethodThe corneal meshes of 5 randomly selected emmetropic SyntEyes with different biometry and optical properties were generated using MATLAB and ANSYS. To simulate keratoconus development, a local stiffness reduction of up to 60 % of the original value was implemented in three locations (central, 1mm, and 2mm inferior) with a diameter of 2mm for each cornea. From this, tangential corneal power maps were calculated.
ResultsLocal weakening causes the formation of a conical deformation at the site of the weak spot and, for an inferior weak spot, a superior flattening. At the center of the weak spot, the cornea becomes thinner by 50μm, while the maximum anterior curvature increased by an average of 51.76±1.38D and the posterior curvature by an average of -7.45±0.15D for the central keratoconus. The anterior surface area increases by 0.88±0.29 mm² and 0.85±0.03 mm² for a central and inferior keratoconus, respectively. The corresponding values for the posterior surface were 1.10±0.03 mm² and 1.06±0.03 mm².
ConclusionThe shape of a keratoconic cornea is not only determined by the response to a local structural weakening, but also by its original corneal shape. This understanding may help enhance early detection and monitoring techniques for keratoconus progression.
The biomechanical stability of the cornea is maintained through a highly organized arrangement of collagen fibers within the stroma that provides both strength and elasticity.1,2 In keratoconus, this collagen matrix is disrupted, leading to a localized biomechanical instability.3 This causes the cornea to gradually become thinner and assume a conical shape, that manifests optically as large amounts of higher order aberrations and a reduced visual image quality. Keratoconic eyes typically cannot be fully corrected by standard spectacles, except for the earliest cases. Instead, the most common approach is to use rigid gas permeable (RGP) contact lenses that provide a more regular first surface for light to pass through and reduce the influence of the anterior corneal surface through index matching. However, RGP users can experience discomfort in the long term.4 In those cases, scleral lenses should be proposed as a possible alternative previous to corneal transplant.5 Meanwhile, the primary therapeutic intervention for keratoconus is corneal cross-linking (CXL), a procedure designed to strengthen the corneal tissue to stop the progression of the disease. This involves applying riboflavin (vitamin B2) to the cornea and then exposing it to ultraviolet A (UVA) light to increase the collagen cross-links within the cornea,6 making it stiffer and more resistant to deformation. While effective in slowing or stopping the progression of keratoconus,7 CXL does not reverse the damage already done. In more advanced cases, when the best-corrected visual image quality becomes inadequate for the patient, or the cornea becomes dangerously thin, a corneal transplantation may be considered. However, this procedure is costly and carries a risk of graft rejection, infections, and other complications. It is therefore essential to ensure that the cornea does not reach these advanced stages by crosslinking keratoconus cases confirmed as progressive in the earliest possible stage. For this reason, imaging techniques such as corneal topography and optical coherence tomography are essential to screen those in need of treatment.8–10
The exact cause of the structural weakening in keratoconus is not completely understood, but it is believed to involve hereditary predisposition,11,12 systemic influences, and behavioral factors such as frequent eye rubbing.13–15 To further investigate the importance of the corneal biomechanical properties, researchers have employed various modeling techniques to understand the underlying issues that lead to the development and progression of keratoconus. Carvalho et al.,16 for example, developed a Finite Element Model (FEM) of the cornea to predict keratoconus-like behavior based on its local biomechanical material properties under varying conditions such as elasticity changes and intraocular pressure. Their model demonstrated that local changes in material properties induce the characteristic conical deformation seen in keratoconus. Similarly, Roy and Dupps17 created patient-specific computational models to study keratoconus progression and the effect of cross-linking treatments by incorporating clinical tomography and intraocular pressure measurements to simulate changes in corneal curvature and higher-order aberrations. They also found that regional reductions in corneal hyperelastic properties replicated keratoconic topographic features, providing a useful tool for evaluating treatment responses and disease progression. Further numerical simulations by Falgayrettes et al.13 found that softening of specific corneal layers, particularly the posterior stroma, could lead to the conical deformation and thinning characteristic of keratoconus. Their models also highlighted the impact of eye rubbing on the biomechanical stress distribution within the cornea, which could exacerbate the progression of the disease as eye rubbing creates shear stress on the corneal tissue, causing mechanical damage to the delicate interlamellar cross-links that provide structural integrity to the cornea. Indirectly, the mechanical stress from eye rubbing can also induce keratocyte apoptosis, a process where cells undergo a programmed death.3,18,19 This cellular damage can lead to an increase in the production of matrix catabolic proteins, which break down the extracellular matrix components. Additionally, the production of essential structural components such as collagen and ground substances can be impaired.20
Additional studies introduced advanced numerical models to capture the complexity of corneal biomechanics. Pandolfi et al.19 proposed a microstructural model that considers the interaction between collagen fibrils and cross-links within the stromal matrix. Their results showed that the weakening of cross-links could lead to a marked increase in the deformability of the cornea, potentially triggering the progression of keratoconus. Köry et al.21 developed a discrete-to-continuum mathematical model for corneal biomechanics, illustrating how localized reductions in collagen stiffness led to macroscopic thinning and increased curvature of the anterior and posterior corneal surfaces, consistent with keratoconus progression. Meanwhile, Fantaci et al.22 proposed a continuum-based keratoconus growth model that accounts for the structural changes in the underlying tissue during disease progression to provide insights into how extracellular matrix degradation, tissue remodeling, and collagen fiber disorganization contribute to the pathology. Their findings suggest that keratoconus progression may be driven by a combination of biomechanical weakening and growth mechanisms, emphasizing the importance of early detection and intervention
While previous studies confirmed that the presence of weak areas can progressively deform the cornea, the influence of the initial corneal shape on the keratoconic shape changes has not been investigated. Hence this study uses the finite element method to study whether the same structural weakness induced on different healthy corneas would produce the same keratoconus pattern.
MethodThis analysis starts from 5 randomly selected emmetropic corneas produced by the SyntEyes model, a higher-order statistical eye model designed to generate synthetic biometric data sets with statistical properties identical to those of the original data set of healthy Belgian adults.23 The properties are provided in Table 1.23 The following section describes the methodology, including the generation of synthetic corneal geometries, the material properties used, and the finite element analysis approach applied.
Geometrical parameters (mm).
rca, rcp: anterior and posterior corneal radius of curvature; CCT: central corneal thickness; S: spherical refractive error.
The first step of the modelling involves defining the corneal geometry and generating an appropriate computational mesh. The elevations of each corneal surface were initially described as two sets of Zernike coefficients (45 coefficients over a 6.5mm diameter area, each) that were converted into point clouds in a Cartesian coordinate system using Matlab (R2023a, The MathWorks, Natick, MA, USA). These point clouds were extrapolated to a limbal diameter of 12 mm, close to the average diameter of an adult cornea,24 by fitting a quadratic surface to both the anterior and posterior cornea surfaces:
where z represents the corneal elevation, x and y are the cartesian coordinates on the corneal surface, and coefficients c1 to c6are fitted to the point cloud of each corneal surface. The center of this fitted surface was subsequently replaced by the original surface over the initial 6.5 mm diameter. But as this leads to discontinuities at the interface between the original and fitted surfaces, a smoothing algorithm was applied to prevent convergence issues during finite element analysis and ensure a smooth optical surface for accurate calculations (Fig. 1). Next, to create the corneal volume, the posterior surface was shifted backwards by the value of the central corneal thickness (CCT), thus completing the point cloud model. This model was then converted into STL (stereolithography) files through triangulation, and into INP mesh files using MATLAB PDE (Partial Differential Equation) functions. Finally, these INP meshes were imported into Ansys Mechanical (2023 R2, Ansys Inc, Southpointe, PA, USA) for tetrahedral remeshing using the SOLID185 element and the finite element analysis itself (Fig. 2).

Visualization of corneal geometry. Zernike elevation corresponds to the original elevation data, which is fitted with the quadratic surface; Fitted corneal periphery: the peripheral cornea area is extrapolated using the quadratic function. Inset: Transition between the central and peripheral areas of the cornea using a smoothing algorithm.

With the corneal geometry and mesh defined, the next critical step is to assign appropriate material properties that accurately represent the mechanical behavior of the corneal tissue (Table 2). In this study, the anisotropic, nonlinear mechanical response of the cornea is modeled using the Holzapfel-Gasser-Ogden (HGO) hyperelastic material model, implemented through the PolyUMod material library in ANSYS Mechanical. The HGO model is specifically developed to describe the behavior of fiber-reinforced soft biological tissues, such as the cornea, where collagen fibers are embedded within a hyperelastic ground matrix. This formulation captures both the isotropic response of the matrix and the directional stiffness introduced by the collagen fibers.
The strain energy density function in the HGO model is decomposed into two parts: a deviatoric (volume-preserving) part and a volumetric (compressibility) part. Mathematically, the total strain energy potential is expressed as:

The deviatoric component is formulated based on a Neo-Hookean matrix model and an exponential fibre reinforcement term, as follows:
where C10 is the Neo-Hookean stiffness parameter, while k1 and k2 are material parameters that define the stiffness and nonlinearity of the fibre reinforcement, respectively.
I¯1 is the first invariant of the isochoric left or right Cauchy-Green deformation tensor:

Here, b¯ is the deviatoric part of the left Cauchy-Green deformation tensor b, F denotes the deformation gradient tensor and J=det(F) represents the local volume ratio:


The volumetric part accounts for the material’s resistance to volume change:
with k the bulk modulus, reflecting the material's resistance to volume change. The anisotropic contribution of the fibre families is introduced via the strain measure Ei defined for each fibre direction as:

Here, d is the dispersion parameter, where if d=0, the fibres are perfectly aligned, and if d=0.333, the fibers are oriented randomly. The latter value was used in this study. I4i*is modified fourth invariant represents the square of fibre stretch in the direction ai:

In this study, two perpendicular fibre families were modelled to represent the preferred collagen orientations in the corneal stroma.
Stress-free configurationCreating accurate mechanical models of the eye is challenging as the intraocular pressure (IOP) induces a tension that reshapes its tissues. Clinical measurements (or SyntEyes) typically reflect this pressurized state, so using these measurements directly in a finite element method (FEM) model would result in exaggerated geometric changes. Conversely, excluding IOP from the model fails to simulate the stress it would cause, making it an inaccurate representation of in vivo conditions. To address this, the eye's stress-free configuration (the hypothetical condition without IOP) must be estimated by iteratively solving an inverse nonlinear static problem. This process used an initial nodal pressure of 16mmHg uniformly applied to the posterior corneal surface and assumed that the boundary conditions were that the corneal edge was fixed and attached to the sclera, maintained by the ocular tissues.
Corneal weak spotAfter achieving stress-free configuration, we simulated the development of keratoconus by introducing a weak spot on the cornea. This weak spot was designed as a linear stiffness reduction by up to 60% of the original value using APDL (Ansys Parametric Design Language) over a circular area with a 2-mm diameter, at three locations (central, 1mm, and 2mm inferiorly). The weak spot was surrounded by a 1.5mm wide transition zone (Fig. 3a-c). The stiffness transition was defined to maintain a constant stiffness reduction within the focal weak spot, with a linearly increasing stiffness gradient in the surrounding transition zone towards the boundary of the weak area with the healthy cornea.
Data analysis Central with 2 mm diameter, b) 1mm Inferior, c) 2 mm Inferior. Gray indicates the area with a normal stiffness value, red the transition zone, and yellow the keratoconus zone.")
After determining the corneal deformation due to the weak spot, the central 6.5mm of the anterior and posterior surface is exported as point clouds. These point clouds were then fitted by an 8th order Zernike polynomial expansion in MATLAB, after which the tangential curvature was calculated. These curvatures were subsequently compared between cases, size, and location of weak spots, and reduction methods.
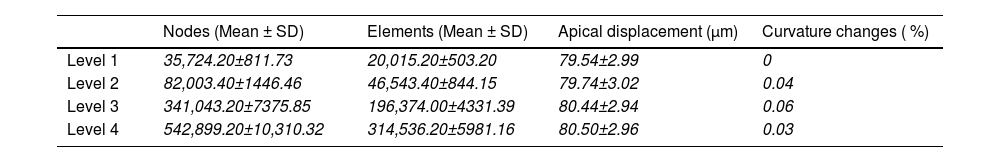
ResultsMesh convergenceA convergence analysis was conducted in order to determine the optimal mesh density for the finite element modelling. This was performed at four density levels for all five corneas without weak spot, using the apical displacement and maximum curvature changes under normal intraocular pressure (16mmHg) as a reference (Table 3). Although mesh level 3 was deemed sufficient for structural simulations, mesh level 4 was employed across all models to guarantee both structural accuracy and a sufficiently smooth surface for the curvature maps.
Mesh densities considered over five corneas.
The following gives an overview of the curvature changes due to the corneal weak spot, listed by the location (Fig. 4, Table 4). Maps of the power changes are provided in Supplement A.
 for all cases (KTC: keratoconus).")
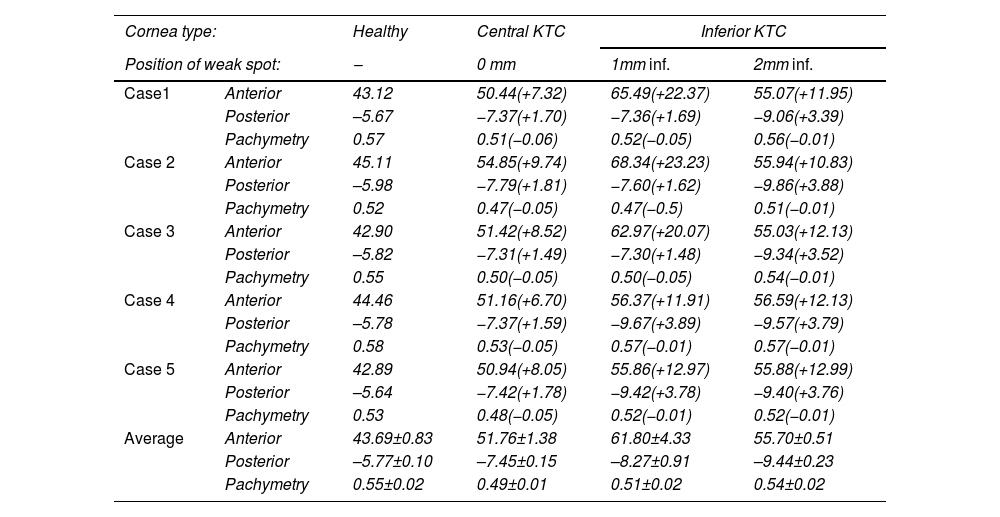
Maximum anterior and posterior corneal power and pachymetry for all cases, and all weak spot positions. Value between brackets is the change from baseline.
A central weakness with a uniform center produces a pronounced central bulging, typical of a severe keratoconus. The curvature maps depict a steep cone formation at the weak spot, with a sharp transition from the affected area to the healthy tissue. The maximum anterior curvature change for central weakness was between 6.70D and 9.74D
The most inferior weak spots show an inferior steepening reminiscent of a pellucid marginal degeneration with a crab claw pattern. The change in maximum anterior curvature for 1 mm inferior weakness was between 11.91D and 23.23D 40.41D, and −1.62D and 3.89D for the posterior cornea. Here, the topographical changes are almost the same for all eyes, probably due to the more extreme deformations (Supplement A).
PachymetryThe corneal thickness reduced at the center of the weak spots that varied by 50μm, depending on the case, and location. The strongest reduction was seen for the central keratoconus scenario (about 60μm reduction).
In contrast, the thickness reduction for inferior keratoconus was less pronounced, with only a 10 – 20μm decrease in thickness at the center of the weak spots.
Surface areaThe anterior surface area increases by 0.88±0.29 mm² and 0.85±0.03 mm² for a central and inferior keratoconus, respectively. The corresponding values for the posterior surface were 1.10±0.03 mm² and 1.06±0.03 mm².
DiscussionThis study employed finite element analysis to evaluate the impact of initial corneal geometry on corneal shape changes during the onset of keratoconus. To this end, a mechanical model was used to generate a weak spot at various locations on emmetropic corneas. The observations provide detailed curvature and pachymetry data that showed different deformation patterns, reflecting how keratoconus might develop in response to the same structural weakness applied to normal corneas. The resulting topography maps clearly show how local weakening of the cornea leads to the formation of a cone nearby that location. Furthermore, for inferior weaknesses this goes accompanied by a flattening in the adjacent areas, as previously described.25
In the simulations, the localized reduction in corneal stiffness leads to a distinct, pronounced central bulging indicative of a keratoconus (Fig. 4) that becomes more pronounced with as the local stiffness reduces (Fig. 5). Furthermore, the inferior keratoconus simulations highlight a well-known characteristic of this pathology, with >90 % of the keratoconus showing a corneal thinnest point decentered both inferiorly and temporally.26 The curvature maps clearly demonstrate the steepening effect in the inferior part of the cornea, with adjacent areas presenting some flattening as a coupling effect. This uneven deformation pattern aligns with clinical observations of inferior keratoconus, where the cone typically forms below the central cornea, resulting in irregular astigmatism and distorted vision. As shown in Fig. 4, weak spots at the most inferior position form a pattern consistent with pellucid marginal degeneration. This confirms that, at least topographically, pellucid marginal degeneration may indeed represent an inferior form of keratoconus. However, it is often considered a separate condition due to its distinct physiological characteristics, possibly influenced by its proximity to the limbus. Despite the clear differences observed between the topographical patterns of the individual eyes (columns in Figs. 4), the changes in topographical patterns look remarkably similar between eyes (Supplement A).

While this study may not have immediate clinical applications, it provides valuable insights into the role of initial corneal shape variations in determining the progression of keratoconus. Our findings demonstrate that the same degree of weakening can lead to significant progression in some cases, as indicated by Kmax, while in others, the progression remains minimal, solely due to differences in the initial corneal curvature. Such analyses can only be performed through modeling, as the pre-keratoconic shape of the cornea is rarely available in clinical settings since most patients seek ophthalmologic evaluation only after symptoms appear.
These findings contribute to understanding how different phenotypes of keratoconus develop and suggest that some healthy corneal geometries may lead to larger amounts of deformation should they ever develop keratoconus. This knowledge can aid clinicians in differentiating between patients who may require more intensive follow-up and those with a more stable condition. Ultimately, the research supports a move towards a more personalized approach to keratoconus management. Furthermore, our results may help refine the area of interest for customized topography-guided corneal collagen cross-linking, as current treatments still irradiate the central 8 mm by default. The study by Cassagne et al.27 suggests that a more individualized approach could be beneficial in determining the most effective treatment zone. By better defining the area of interest for intervention, we may improve the long-term outcomes of keratoconus management.
ConclusionAlthough the mechanical response to a corneal weak spot is fairly similar between eyes, the resulting topographical maps can be rather different due to the influence of the original corneal shape. These structural alterations underscore the importance of considering corneal geometry in the diagnosis, monitoring, and treatment of keratoconus. Understanding the role of corneal shape can lead to more precise and effective therapeutic strategies, potentially improving patient outcomes and slowing the progression of keratoconus.
The authors have no conflicts of interest to declare.
This project has received funding from the European Union’s Horizon 2020 research and innovation program under the Marie Skłodowska-Curie grant agreement No 956720.


