


The primary objective of the study was to explore the statistics of ocular higher-order aberrations in a population of primary and secondary school children.
MethodsA sample of 557 children aged 10–15 years were selected from two primary and two secondary schools in Heraklion, Greece. Children were classified by age in three subgroups: group I (10.7±0.5 years), group II (12.4±0.5 years) and group III (14.5±0.5 years). Ocular aberrations were measured using a wavefront aberrometer (COAS, AMO Wavefront Sciences, USA) at mesopic light levels (illuminance at cornea was 4lux). Wavefront analysis was achieved for a 5mm pupil. Statistical analysis was carried out for the right eye only.
ResultsThe average coefficient of most high-order aberrations did not differ from zero with the exception of vertical (0.076μm) and horizontal (0.018μm) coma, oblique trefoil (−0.055μm) and spherical aberration (0.018μm). The most prominent change between the three groups was observed for the spherical aberration, which increased from 0.007μm (SE 0.005) in group I to 0.011μm (SE 0.004) in group II and 0.030μm (SE 0.004) in group III. Significant differences were also found for the oblique astigmatism and the third-order coma aberrations.
ConclusionsDifferences in the low levels of ocular spherical aberration in young children possibly reflect differences in lenticular spherical aberration and relate to the gradient refractive index of the lens. The evaluation of spherical aberration at certain stages of eye growth may help to better understand the underlying mechanisms of myopia development.
El objetivo primario del estudio fue la investigación de la distribución de las aberraciones oculares de alto orden en un población de niños de enseñanza primaria y secundaria.
MétodosSe seleccionó una muestra de 557 niños, de edades comprendidas entre 10 y 15 años, de dos escuelas de enseñanza primaria y secundaria en Heraklion, Grecia. Se clasificó a los niños por edades en tres subgrupos: el grupo I (10,7±0,5 años), el grupo II (12,4±0,5 años) y el grupo III (14,5±0,5 años). Se midieron las aberraciones oculares utilizando un aberrómetro de frente de onda (COAS, AMO Wavefront Sciences, USA) en condiciones de de visión mesópica (la iluminancia en la córnea fue de 4 lux). El análisis con frente de onda se logró para una pupila de 5mm. El análisis estadístico se llevó a cabo únicamente con los datos del ojo derecho.
ResultadosEl coeficiente medio para la mayoría de aberraciones de alto orden no difirió de cero, a excepción del coma vertical (0,076μm) y horizontal (0,018μm), el astigmatismo oblicuo (-0,055μm) y la aberración esférica (0,018μm). El cambio más sobresaliente entre los tres grupos se observó en la aberración esférica, que pasó de ser de 0,007μm (SE 0,005) en el grupo I a 0,011μm (SE 0,004) en el grupo II y 0,030μm (SE 0,004) en el grupo III. También se hallaron diferencias significativas para el astigmatismo oblicuo y la aberración comática de tercer orden.
ConclusionesLas diferencias en los bajos niveles de aberración esférica ocular en niños reflejan posiblemente las diferencias en cuanto a aberración esférica lenticular y se refieren al gradiente de índice de refracción del cristalino. La evaluación de la aberración esférica en ciertas edades del crecimiento ocular puede ayudar a comprender mejor los mecanismos subyacentes al desarrollo de la miopía.
The quest to understand the origins of refractive error and particularly of myopia has been a long one and has yet been inconclusive. It is, though, well established that the development of myopia is primarily an increase in the vitreous chamber depth of the eye, which is influenced by genetic and environmental factors.1–5 In addition, recent research on animals has shown that eye growth can be altered with a variety of optical interventions that affect axial or peripheral retinal defocus.1,6 The existence of optically dependent growth mechanisms supplements earlier observations of deprivation myopia, i.e. excessive eye growth due to lack of a clear retinal image.7,8
It has also been postulated that high levels of axial ocular aberration, which degrade image quality at the fovea, might have a causative role in at least some types of myopia, such as late-onset myopia.9–11 In normal eyes, the impact of higher-order aberrations to retinal image blur is far outweighted by sphero-cylindrical refractive error, which is represented by the second-order terms (i.e., defocus and vertical/oblique astigmatism). There have been large-scale population studies on the prevalence of higher-order aberrations in healthy eyes. Most of the studies confirmed that the population means of all third- and higher-order coefficients vary randomly about zero between individuals.12–15 Although third-order terms usually contribute more to the variance of the wavefront in an individual eye than fourth-order terms do,16 spherical aberration is usually non-zero and positive in sign.
Fourth-order spherical aberration seems to be the most prominent aberration since it also changes systematically with the level of accommodation, the main effect being a progressive shift in the negative direction, which is fairly consistent among young adults.17–21 This shift may be relevant to the changing second-order focus errors (i.e., lags/leads of accommodation) with stimulus vergence.20 Moreover, higher-order aberrations and especially spherical aberration possibly provide retinal image cues that guide the control of defocus through emmetropization22 and accommodation,23,24 while in the absence of such cues the initial direction of accommodation is chosen at random.25
It is well known that aberrations tend to increase across the adult age range, although at any age there is substantial inter-subject variation. However, due to senile pupil miosis retinal image quality is maintained at an approximately constant level at all ages.15,26,27 Although, there have been large cross-sectional studies of high-order aberrations in the later adulthood, the correlation of ocular developmental changes in lens radii of curvature, axial length and other components of refraction with high-order aberrations has not been investigated rigorously.
In order to assess the potential role of ocular aberrations in the emmetropization process, they have to be measured at certain stages of the development of myopia, while the eye is actively changing its refraction. The majority of refractive error studies have postulated a 5–8 times increase in myopia prevalence rates between 6 years and 12-year-old children.28–30 Thus, the purpose of the study was to evaluate the types and amount of aberrations present in primary and secondary school children.
Materials and methodsParticipantsA sample of two primary and two secondary schools were selected in the Greek city of Heraklion in the island of Crete. All pupils in primary grades four to six and secondary school grades one to three were invited to participate. All pupils at school on the day of examination were tested apart from two secondary school pupils (0.73%) who did not wish to participate. Of the 588 children who initially agreed to participate in the study, 31 were excluded, because they were diagnosed with binocular vision anomalies or other pathologies or had a pupil diameter smaller than 5mm during the aberrations recordings.
Thus, 557 children (94.7%) with normal binocular vision, phoria and near point of convergence, and no ocular pathology were included in final analysis. None of the participants had a history of refractive or other ocular surgery. Written information consent was obtained from at least one of the parents and the regional department of primary and secondary education (Ministry of Education). The study design was observational and therefore no interventional procedures, such as cycloplegic drugs, were incorporated. Verbal consent was obtained from each child before examination. The research conformed to the tenets of the Declaration of Helsinki and followed a protocol reviewed and approved by the University of Crete Research Board.
The total number of male participants was 291 (52.2%). Mean age (standard error, SE) was 12.8 (SE 0.1) years. Mean spherical equivalent was −1.06 (SE 0.09) diopters (D). 201 children (36.1%) were emmetropes (spherical equivalent, SEq, was >−0.50D and <0.50D), 320 (57.5%) were myopes (SEq≤−0.50D) and 36 (6.5%) were hyperopes (SEq≥0.50D).
Data collection and analysisSphero-cylindrical refractive error for each eye was measured with an auto-refractor (Potec PRK-5000; Potec Ltd., Daejeon, Korea) followed by subjective refraction. The ocular wavefront error was measured using the Complete Ophthalmic Analysis System (COAS, AMO Wavefront Sciences, USA), which is based on the Shack–Hartmann principle. COAS technical specifications are described in detail elsewhere.20,31 Aberration measurements were performed under low mesopic lighting conditions. Participants were asked to position their head on the chin rest, to blink 1–2s prior to the measurements and to fixate with the non-tested eye a letter of 1.0logMAR size at 4m distance (chart background luminance was 70cd/m2). All room lights were extinguished during the experiment, thus the illuminance at cornea was about 4lux.
The data extracted from COAS consist of a set of Zernike coefficients up to the fourth order in OSA format32 and corrected for chromatic aberration. Pupil diameter scaling to 5.0mm and calculation of spherical equivalent (“Seidel Sphere”) and root-mean squared (RMS) errors (for defocus, coma, spherical aberration, etc.) was achieved using custom-written scripts in Matlab computational software (MatLab V 13.0; The Mathworks Inc., Nantick, MA).
Statistical analysisAll measurements were performed for each eye. However, since the intraclass correlation coefficient between the two eyes is close to one for most of the terms (see below), then choosing only one eye, or taking the average of both eyes may be logical choices.33,34 Due to the interocular mirror symmetry shown for some measurements, statistical analysis was carried out for the right eye only. There were no missing values. One-sample t tests were performed to determine whether the individual 3rd- and 4th-order components differed significantly from a mean of zero. Comparisons between categorical variables (e.g. gender, myopia rates) were made using the chi-squared test of independence. One-way ANOVA was used to compare the data between the three age groups. Student–Newman–Keuls test was used for pairwise comparison. A 5% significance level was chosen. Pearson's correlation coefficient r was used to assess the correlations between pairs of quantitative variables. The statistical package MedCalc version 12.5 (MedCalc Software, Ostend, Belgium) was used for the analysis.
ResultsThe mean signed value (±1 SE) of each Zernike coefficient (up to 4th order) for right (RE) and left eyes (LE) is depicted in Fig. 1. Although second-order aberrations, i.e. defocus (c20) and vertical astigmatism (c22), were by far the most dominant, a relatively high inter-subject variability (when weighted by its absolute value) was observed for the higher-order aberrations. It is also evident that the population averages of higher-order Zernike coefficients were approximately zero for both eyes, except the vertical coma (c3−1; 0.076 and 0.079μm for the RE and LE, respectively), the oblique trefoil (c3−3; −0.055 and −0.058μm for the RE and LE, respectively), the spherical aberration (c40; 0.018 and 0.017μm for the RE and LE, respectively) and the horizontal coma (c31; 0.018 only in the RE).
 of all low- and higher-order Zernike coefficients for right (open squares) and left (filled circles) eyes. Pupil diameter is scaled to 5mm.")
Figs. 2 and 3 show plots of the correlation for each Zernike term between the two eyes for low- (second) and higher- (third and fourth) order aberrations. Bilateral symmetry is evident in most cases. The highest correlation was found for zero-angular orders, i.e. for primary spherical aberration coefficient (c40, 0.88), and defocus sphere (c20, 0.85). Strong bilateral symmetry was also found for vertical coma (c3−1, 0.82) and vertical astigmatism (c22, 0.82), followed by the vertical (c3−3, 0.68) and the oblique (c33, 0.61) trefoil and vertical secondary astigmatism (c42, 0.59). Correlations between eyes were significant (p<0.05) for all the second- and third-order terms.
 order aberration terms (c20, c2−2, c22) between the two eyes. Pupil diameter is scaled to 5mm. The solid lines represent least square regression fits. The legend at the bottom indicates the correlation coefficient, r.")
. Pupil diameter is scaled to 5mm. The solid lines represent least square regression fits. The legend at the bottom indicates the correlation coefficient, r.")
Since the correlation coefficient between the two eyes for most aberration coefficients was close to one, further analyses were carried out for the measures of the right eye only. A summary of the characteristics of the children, and comparisons between the three age groups (I, II and III), are presented in Table 1. The mean age of pupils was 10.7 years (SE 0.04), 12.4 years (SE 0.04) and 14.5 years (SE 0.03), for groups I, II and III, respectively (F=2893.4, p<0.001). The total number of male participants was 90 (59%), 91 (55%) and 110 (48%) for the three age groups, respectively (x2=4.35, p=0.09). The mean spherical equivalent for the right eye was −0.94D (SE 0.12), −1.00D (SE 0.10) and −1.24D (SE 0.13) (F=2.21, p=0.11). The percentage of myopic eyes (SEq≤−0.50) was 54, 60 and 61% for the three age groups (x2=2.04, p=0.06).
Characteristics of the three age groups of children (N=557).
| Characteristics | Group I10–11 years (n=152) | Group II12–13 years (n=178) | Group III14–15 years (n=227) | p-Value |
|---|---|---|---|---|
| Mean (SE) | Mean (SE) | Mean (SE) | ||
| Age | 10.7 (0.04) | 12.4 (0.04) | 14.5 (0.03) | <0.001 |
| Spherical equivalent (D) | −0.94 (0.12) | −1.00 (0.10) | −1.24 (0.13) | 0.17 |
| Gender (N, %) | 0.09 | |||
| Male | 90 (59%) | 91 (55%) | 110 (48%) | |
| Female | 62 (41%) | 87 (45%) | 117 (52%) | |
| Refractive error (N, %) | 0.06 | |||
| Myopia | 82 (54%) | 106 (60%) | 139 (61%) | |
| Emmetropia | 65 (43%) | 60 (34%) | 68 (30%) | |
| Hypermetropia | 5 (3%) | 12 (6%) | 20 (9%) | |
| Spherical aberration (N, %) | 0.11 | |||
| Positive | 82 (54%) | 102 (57%) | 152 (67%) | |
| Negative | 70 (46%) | 76 (43%) | 75 (33%) |
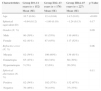
The mean values (±1 SD) for each Zernike coefficient (i.e. the signed values of each aberration), for the three cohorts, are depicted in Table 2. The same data are illustrated in a pyramid structure in Fig. 4. Among the second-order terms, statistically significant changes between the three groups were only observed for oblique astigmatism (F=11.40, p<0.001), which changes from negative values (−0.084μm) in group I to positive (0.026μm) in group III. Among the third-order terms, statistically significant differences were found for the vertical coma (between groups II and III; F=5.13, p=0.006) and the horizontal coma (between groups I and III, and groups II and III; F=7.26, p=0.001). Statistically significant differences between the age groups were found for all fourth-order terms (p<0.001), except for the oblique secondary astigmatism (p=0.62). The most prominent change was observed for the spherical aberration, which increased from 0.007μm (SE 0.005) in group I to 0.011μm (SE 0.004) in group II and 0.030μm (SE 0.004) in group III (F=8.06, p<0.001). Note, that no difference was found in the average absolute value of spherical aberration, i.e. its root mean squared (RMS) error value (F=2.95, p=0.06). The characteristic increase in the signed value of spherical aberration was probably due to the higher percentage of older children with positive spherical aberration, i.e. 67% in group III compared to 57% in group II and 54% in group I. Finally, a weak correlation was found between spherical aberration and spherical equivalent (r=0.15, p=0.04), with myopic eyes exhibiting less positive/more negative amounts of spherical aberration compared to hyperopic eyes.
Average (SD) signed Zernike coefficients (in μm) for the three age groups. The p-value tests any significant difference between the age groups using one-way ANOVA. Pairwise comparison is tested with the Student–Newman–Keuls (a significant difference between Groups I and II, I and III and II and III, is indicated by *, ** and ***, respectively).
| Coefficient | Group I (n=152) | Group II (n=178) | Group III(n=227) | p-Value |
|---|---|---|---|---|
| c2−2 | −0.084 (0.254) | −0.032 (0.203) | 0.026 (0.214) | <0.001*,**,*** |
| c20 | 1.393 (1.442) | 1.356 (1.275) | 1.451 (1.733) | 0.82 |
| c22 | −0.143 (0.467) | −0.114 (0.380) | −0.079 (0.336) | 0.28 |
| c3−3 | −0.045 (0.070) | −0.056 (0.072) | −0.058 (0.069) | 0.19 |
| c3−1 | 0.082 (0.126) | 0.099 (0.109) | 0.064 (0.098) | 0.006*** |
| c31 | 0.014 (0.060) | 0.007 (0.058) | 0.030 (0.065) | 0.001**,*** |
| c33 | −0.011 (0.059) | 0.003 (0.059) | −0.004 (0.061) | 0.09 |
| c4−4 | 0.008 (0.034) | 0.011 (0.019) | 0.012 (0.017) | 0.36 |
| c4−2 | −0.005 (0.022) | −0.005 (0.017) | −0.007 (0.014) | 0.62 |
| c40 | 0.007 (0.065) | 0.011 (0.054) | 0.030 (0.063) | <0.001**,*** |
| c42 | 0.003 (0.043) | −0.004 (0.021) | −0.014 (0.026) | <0.001*,**,*** |
| c44 | 0.011 (0.026) | 0.018 (0.034) | 0.016 (0.022) | 0.02* |
 of all Zernike coefficients for the three age groups presented in the characteristic pyramidic format (2nd order – upper, 3rd order – middle and 4th order – lower graph). 5mm pupils are used for analysis. Number of (right) eyes: 152 (group I), 178 (group II) and 227 (group III).")
Mean values (± 1 SE) of all Zernike coefficients for the three age groups presented in the characteristic pyramidic format (2nd order – upper, 3rd order – middle and 4th order – lower graph). 5mm pupils are used for analysis. Number of (right) eyes: 152 (group I), 178 (group II) and 227 (group III).
The current study investigates wavefront aberration statistics in a school children population aged between 10 and 15 years. The distribution patterns of individual modes agree with previous studies, showing a significant dispersion in all Zernike coefficients among normal eyes.12–15 Second-order terms, which represent the familiar sphero-cylindrical refractive errors, constitute the dominant aberrations while the population means of most of the third- and fourth-order coefficients are close to zero, with the exemption of vertical coma, oblique trefoil and primary spherical aberration. The low levels of monochromatic aberrations and the population means of approximately zero for almost every aberration in young eyes are possibly indicative of an emmetropization-like process that refines higher-order aberrations, in a similar manner it reduces sphere and cylinder.35
Spherical aberration was found positive in sign, in agreement with all large population studies among adults,12,15,36–39 and also exhibited the highest inter-ocular correlation among low- and higher-order aberrations, consistent with the relevant literature.12,15,37,40 However, its average magnitude (mean signed value: 0.017μm; mean absolute value: 0.049μm) is lower than those reported in populations of children, which typically vary between 0.04 and 0.06μm over a 5-mm pupil.14,41–43.
An interesting finding was the increased amounts of signed spherical aberration, by approximately a factor of 3, for the older children (group III: 0.030μm) as compared to the younger cohorts (group I: 0.007μm; group II: 0.011μm). This was not observed for the absolute levels of spherical aberration, probably because of the high percentage of children in groups I and II showing negative signed spherical aberration. In general, when there is no consistent trend in the sign of the spherical aberration coefficient within a population, its average levels are expected to be approximately zero, while its absolute levels are expected to be significantly different from zero.
Several authors have found lower magnitudes of spherical aberration in children as compared to adults.42,44,45 For example, Kirwan et al.44 found spherical aberration being negative in 84.6% of the children included in the study (with an average age of 6.7 years), resulting to a mean negative spherical aberration with a magnitude of −0.115μm. Martinez et al.42 compared higher-order monochromatic aberrations between hyperopic and emmetropic eyes from two large cohorts (mostly 6 and 12 year old) of Caucasian children and found higher levels of average spherical aberration in the older (0.06μm) as compared to the younger (0.04μm) cohort. This difference in spherical aberration was more pronounced in emmetropes (0.034 vs. 0.002μm, in older vs. younger cohorts) and low hyperopes (0.550 vs. 0.019μm, in older vs. younger cohorts). Similar to our study, the differences in the level of spherical aberration between the two age groups were less noticeable (e.g. 0.05 vs. 0.04μm in emmetropic subjects). Very low levels of spherical aberration, which did not differ statistically from a mean of zero, have also been found among infants.45
Other studies on children did not find significant effects of age on spherical aberration,14,41,46 probably because they were primarily designed to study aberration patterns among populations with different refractive error. Brunette and associates46 conducted a study that investigated the effects of age on higher-order aberrations from childhood to the eighth decade of life, with only three individuals of any given age included in the study. Although the authors suggested that the RMS of higher-order aberrations, including spherical aberration, was significant in childhood and decreased progressively to the third decade, increasing in older individuals, they did not analyze individual coefficients.
The increment of spherical aberration with age in childhood could be indicative of or associated to the typical changes of eye growth in all the major determinants of refractive power, such as corneal curvature, axial length, and lens power and thickness. The development of cornea, i.e. the flattening in the corneal curvature, is virtually complete by the age of 2–3 years,47 although longitudinal studies48 have shown that some corneal curvature flattening may continue between the ages of 9 and 12, especially for myopic children. In addition, flattening in lens radii of curvature and lens thinning also cease by the age of ten.49 These findings indicate that the change in the ocular spherical aberration after 10 years of age, i.e. the youngest children in the current study, are possibly due to the increase in axial length and/or any changes in the refractive index of the lens during later childhood.50 The low levels of ocular spherical aberration in the group of younger children possibly reflect differences in internal (lenticular) spherical aberration and relate to the gradient refractive index of the lens.51 The interpretation of the positive increase in the magnitude of the spherical aberration coefficient with age in school children is consistent with a similar trend seen across the adult age range,27 due to the continuous growth of crystalline lens which reverses the sign of lenticular spherical aberration and increases its magnitude.52
In the absence of any sphero-cylindrical refractive error, spherical aberration poses the main source of optical blur on foveal vision, providing a directional cue for accommodation,23,24 and allowing larger errors of focus for stimuli with increased vergence.20 Thus, the evaluation of spherical aberration at certain stages of eye growth, when axial length is still increasing and refraction is undergoing modifications, may help to better understand the underlying mechanisms of myopia development. Furthermore, the possible role of sophisticated compensatory mechanisms between the corneal and lenticular aberrations in normal refractive development may be clarified.35,53 It is obvious, that in order to reach safe conclusions regarding the role of higher-order aberrations and more specifically spherical aberration in eye growth, future longitudinal studies, in which both refraction and aberration are measured, should be addressed.
FundingThe authors did not receive any financial support from any public or private sources.
Conflicts of interestThe authors have no proprietary or commercial interest in any material discussed.


