


: Worldwide, the prevalence of myopia is increasing. Myopia begins at younger ages and progresses faster, leading to more adults with high myopia and risk of sight-threatening complications. No data are available about myopia trends in children in urban areas in the UK. We present a 10-year review of children attending a secondary and tertiary eye care facility in London, focussing on the proportion of glasses prescriptions for myopia and progression rates.
Methods: We collated refraction and demographic data from children under the age of 17 years seen at Moorfields Eye Hospital, London, UK, between 2008 and 2017.
Results: We included 63,854 datasets from 23,593 children (51.2% boys, median age 5.4 years, interquartile range IQR 3.8–7.1). The proportion of myopic prescriptions increased from 24 to 32%. In n = 3355 with initial mild/moderate myopia, median progression rate was −0.16 (−0.5 to 0.04) D/year. In those with progression (n = 2095), the rate was -0.40 (−0.19 to −0.74) D/year, slightly higher in girls than in boys (−0.42 vs −0.38 D/year; p = 0.02). Progression was faster in initial moderate than initial mild myopia (−0.54 vs −0.37 D/year; p < 0.001), and before than after average age of onset of puberty (−0.41 vs −0.35 D/year; p = 0.013). There was no statistically significant difference between children of different ethnic backgrounds.
Conclusions: In this cohort, the proportion of glasses prescriptions for myopia and the rate of progression are higher than previously reported for European countries. Living in an urban environment may result in similar progression rates despite different genetic backgrounds.
: A nivel mundial está incrementando la prevalencia de la miopía, que se inicia a edades tempranas y progresa de manera rápida, lo cual conduce a un mayor número de adultos miopes, y a un riesgo de complicaciones que ponen en riesgo la visión. No se dispone de datos acerca de las tendencias de la miopía en áreas urbanas en Reino Unido. Presentamos una revisión a 10 años, de niños que acudieron a centros de cuidados oculares secundarios y terciarios en Londres, centrándonos en la proporción de prescripciones de gafas para miopía, así como las tasas de progresión.
Métodos: Recabamos los datos demográficos y de refracción de niños menores de 17 años examinados en Moorfields Eye Hospital, Londres, RU, entre 2008 y 2017.
Resultados: Incluimos 63.854 conjuntos de datos de 23.593 niños (51,2% varones, con una edad media de 5,4 años, rango intercuartil RIC de 3,8 a 7,1). La proporción de prescripciones para miopía se incrementó del 24 al 32%. En n = 3.355 con miopía inicial leve/moderada, la tasa de progresión media fue de −0,16 (de −0,5 a 0,04) D/año. En aquellos con progresión (n = 2.095), la tasa fue de −0,40 (de −0,19 a −0,74) D/año, ligeramente superiores en niñas que en niños (−0,42 vs −0,38 D/año; p = 0,02). La progresión fue más rápida en la miopía moderada inicial que en la miopía leve inicial (−0,54 vs −0,37 D/año; p < 0,001), y antes que la edad media de inicio de la pubertad (−0,41 vs −0,35 D/año; p = 0,013). No se produjo diferencia estadísticamente significativa entre los niños de diferentes procedencias étnicas.
Conclusiones: En esta cohorte, la proporción de prescripciones de gafas para miopía, y la tasa de progresión, son superiores que lo anteriormente reportado en países europeos. Vivir en entornos urbanos puede derivar en tasas de progresión similares, a pesar de los diferentes entornos genéticos.
Over the past 50 years, the worldwide prevalence of myopia has increased dramatically.1–3 By 2050 more than half of the population are predicted to be myopic in over half of all countries.1 Sight loss from complications associated with high myopia, such as glaucoma, retinal detachment, macular and choroidal neovascularisation, is expected to increase seven-fold.4 High myopia can have a significant impact on medical, social and financial aspects of people’s life, with a measurable reduction in quality of life.5,6 The rising prevalence of myopia in adults is mirrored in an earlier age of onset and faster rate of progression of myopia in children. Studies in Northern Ireland, Australia and East Asia indicate that prevalence has doubled over the last 50 years; in urban Taiwan, 84% of boys age 18 years now have myopia.7–10 No data are available about myopia trends in children in multi-ethnic urban areas of the UK. As treatments to slow down the progression of myopia, such as low-concentration atropine eyedrops, orthokeratology and dual-focus contact lenses are now being evaluated in clinical trials in the US and Europe,11–14 it is important to determine the magnitude of the problem of myopia in children in the UK. We therefore carried out a retrospective evaluation of the prescriptions for glasses issued at our hospital over the last 10 years. We aimed to determine whether there has been an increase in the proportion of children requiring glasses for myopia, and to evaluate the proportion of children in whom myopia progresses, including the rate of progression.
MethodsThis work had Trust approval as a service evaluation (CA18/082); as it involved the analysis of anonymous data, this approval replaced an approval by an ethics board.
Data collationWe obtained refraction data from children under the age of 17 years for whom glasses had been ordered using the software platform Acuitas (Ocuco Limited, Ireland) at Moorfields Eye Hospital, London, UK, between 2008 and 2017. We added demographic data (ethnic background, gender) from the Patient Administration System. We collated refraction and demographic data in Microsoft Office Excel.
In the present analysis, we included prescriptions for the right eye only.
DefinitionsIn line with previous reports,10 we defined emmetropia as spherical equivalent (SE) greater than −0.5D and smaller than +0.50D. We defined mild myopia as SE of −0.5D to −2.99D, moderate myopia as −3.00 to −5.99D and high myopia as −6.00 to less than −12D. We defined progression as any increase in negative spherical equivalent at follow-up refractions.
By convention, normal puberty is considered to begin between the age of 8 and 13 years in girls and between 9 and 14 years in boys.15,16 For the purpose of the present evaluation, we used the UK average age at onset of puberty, which is 11 years in girls and 12 years in boys (https://www.nhs.uk/conditions/early-or-delayed-puberty/).
Statistical analysisWe carried out the statistical analysis using Microsoft Office Excel and IBM SPSS Statistics Version 24. We assessed data distribution using quantile-quantile plots. We summarised normally distributed data as mean (standard deviation, SD), and data not normally distributed as median (interquartile range, IQR). To compare differences between groups we used non-parametric tests (Mann–Whitney U), as data were not normally distributed. The statistical significance was set at a p-value of less than 0.05.
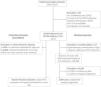
ResultsThe prescription database contained 63,874 datasets obtained between 2008 and 2017. As there were only 5 datasets for 2008, we removed this year from the analysis (Fig. 1). We also removed one dataset, as the year was mislabelled as 2003. Cross-referencing with the hospital patient administration system left 5 datasets for which the hospital identification number (ID) could not be verified; these were removed. 63,863 datasets from 23,597 individual children remained, with between 1 and 17 refraction results for each child. For four children, the gender was not recorded; these cases were removed, resulting in 63,854 refraction datasets from 23,593 children. Of these, 12,055 (51.2%) were boys. The median age was 5.4 (IQR 3.8–7.1) years. Ethnic background was not stated or was unknown in 33%, White in 25%, Asian/Asian British in 14%, Black/African/Caribbean/Black British in 7%, Mixed in 3%, and 19% had selected “any other ethnic group”.
Proportion of prescriptions for myopia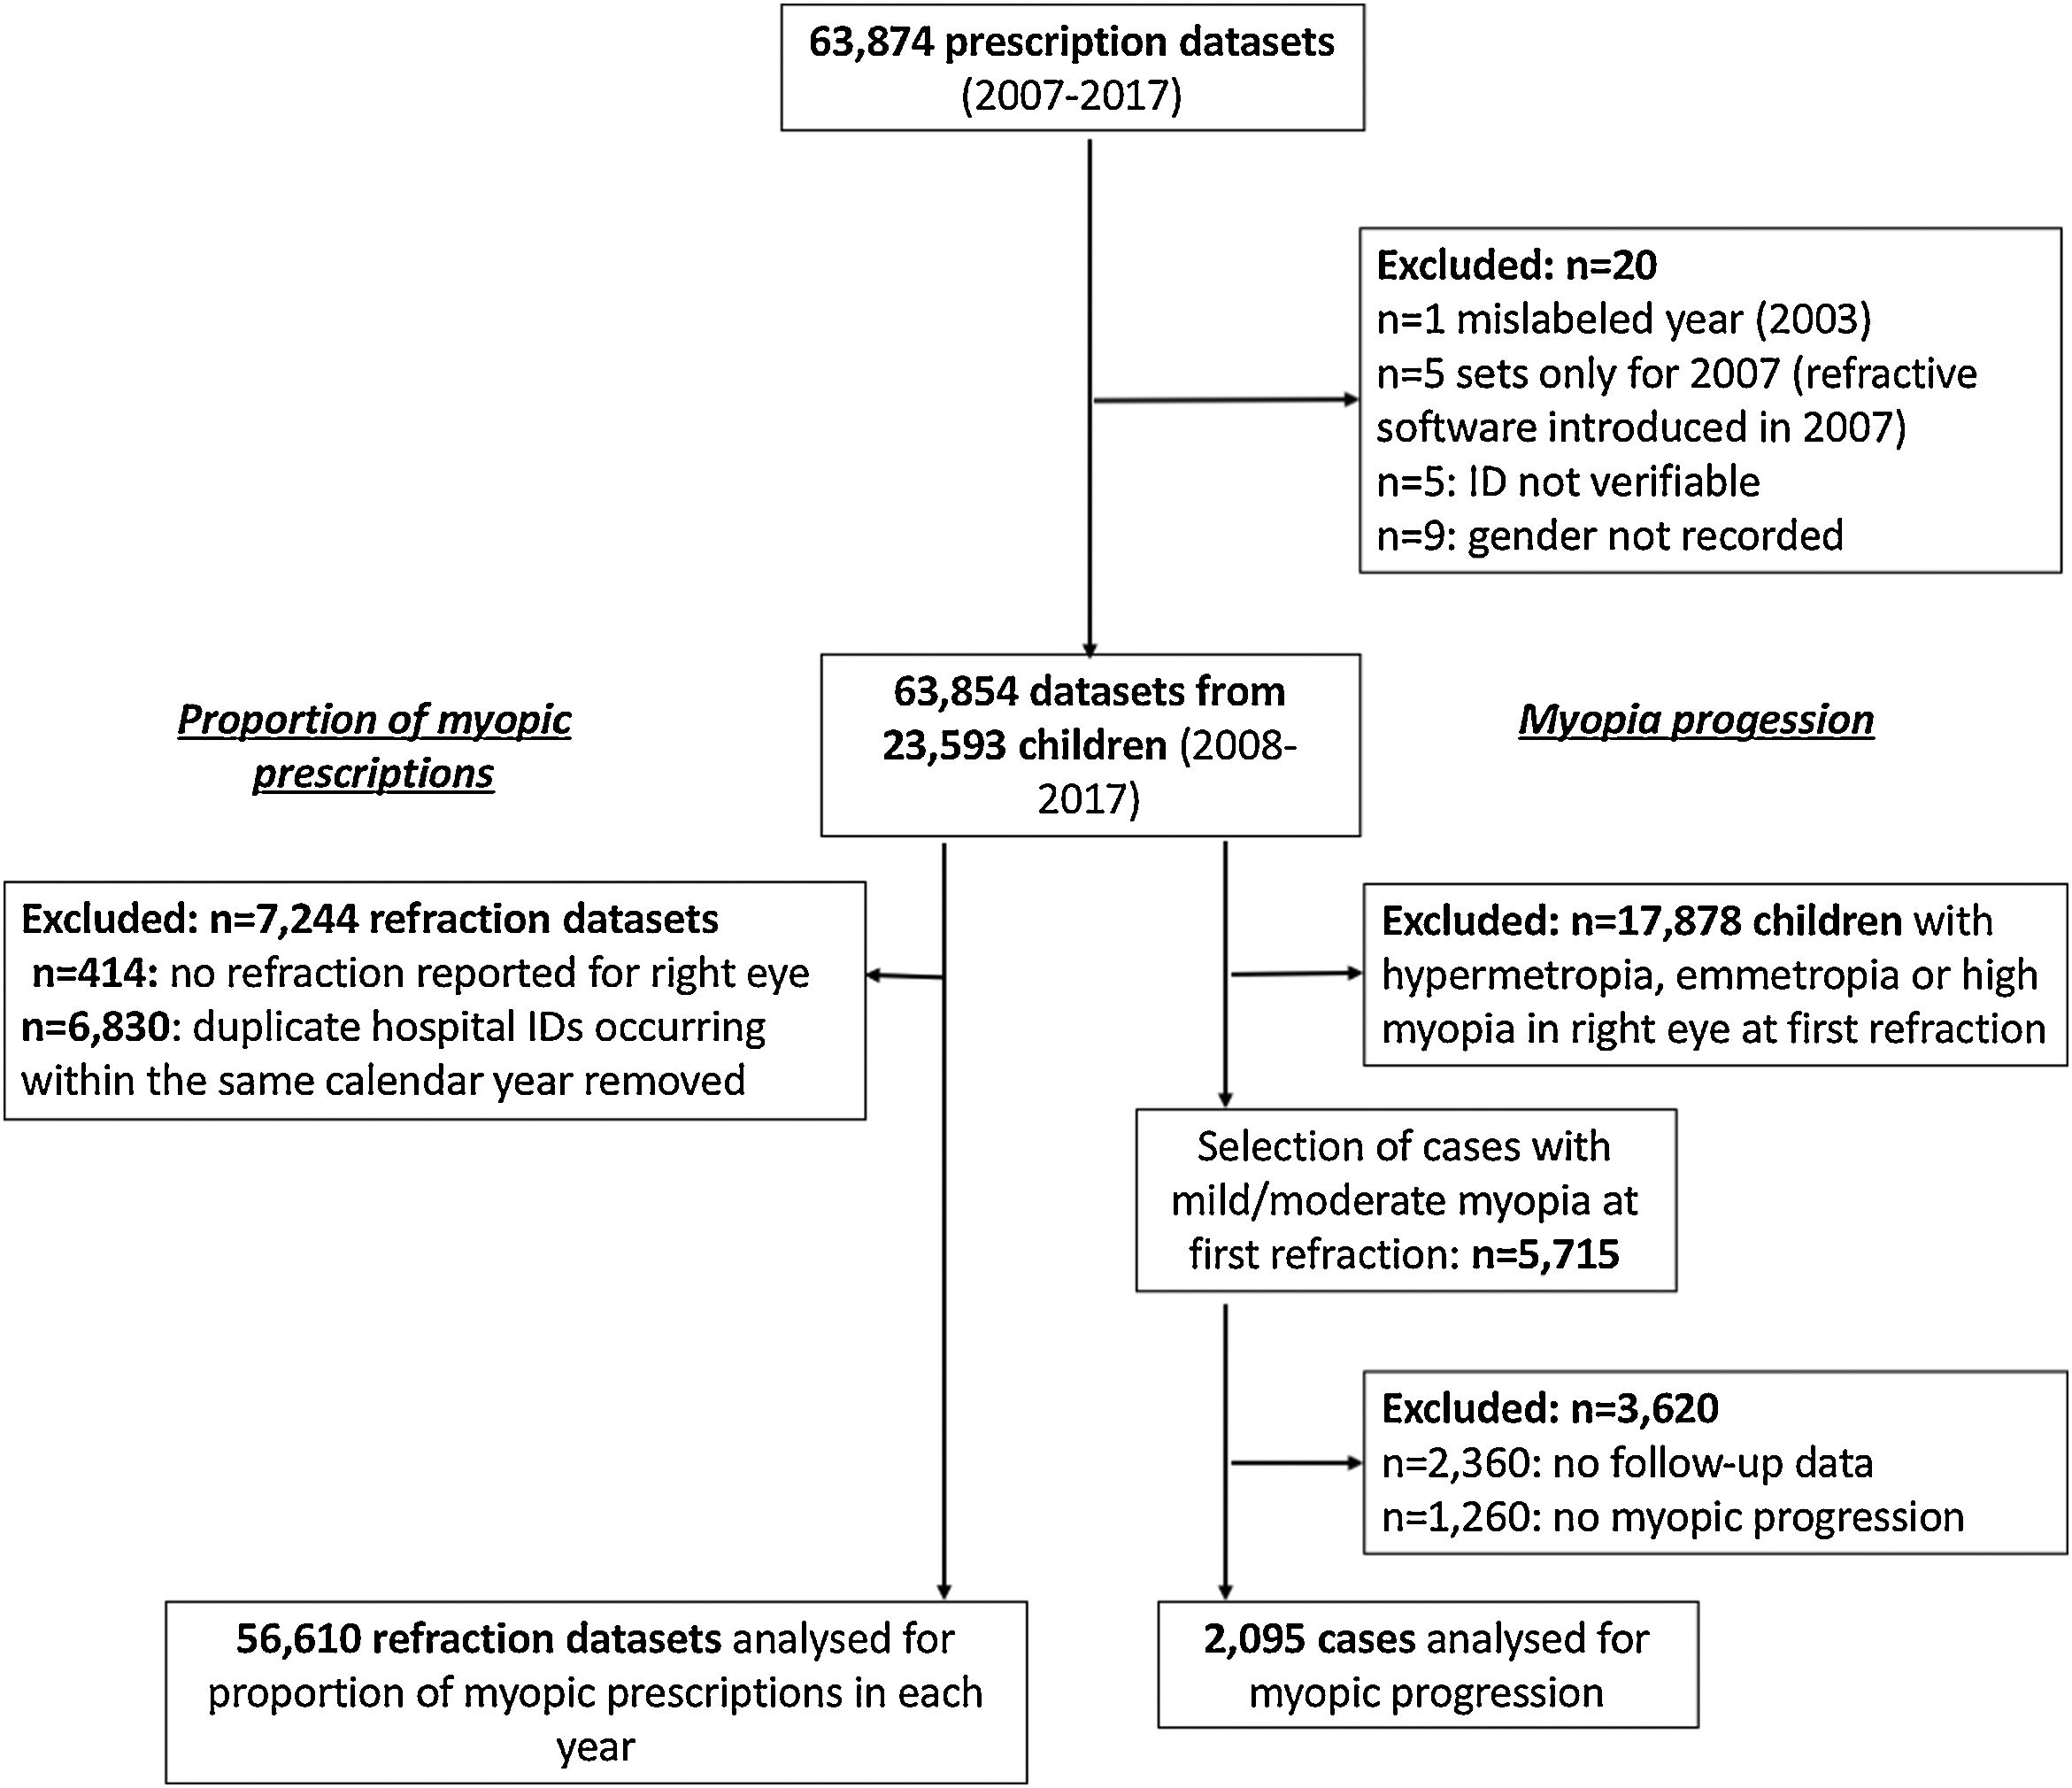
We excluded 7244 prescription datasets, as no refractive value had been entered for the right eye. We also removed 6830 datasets, as the same hospital ID occurred more than once within the same calendar year. We included 56,610 datasets in the analysis (Fig. 1).
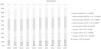
Between 2009 and 2017, the number of spectacles ordered increased from 3757 to 7907 per year. The proportion of myopic prescriptions increased from 24 to 32% (Fig. 2). Including all patients (i.e. those attending for the first time and those attending for follow-up appointments in subsequent years), the proportion of prescriptions for mild myopia increased from 15 to 18%, those for moderate myopia from 4 to 7%, and those for high myopia from 4 to 6% (Fig. 2). Including only children attending our hospital for the first time, the proportions were very similar: the proportion of prescriptions for mild myopia increased from 14 to 22%, those for moderate myopia from 4.5 to 5.4%, and those for high myopia remained at 4%.
Myopia progression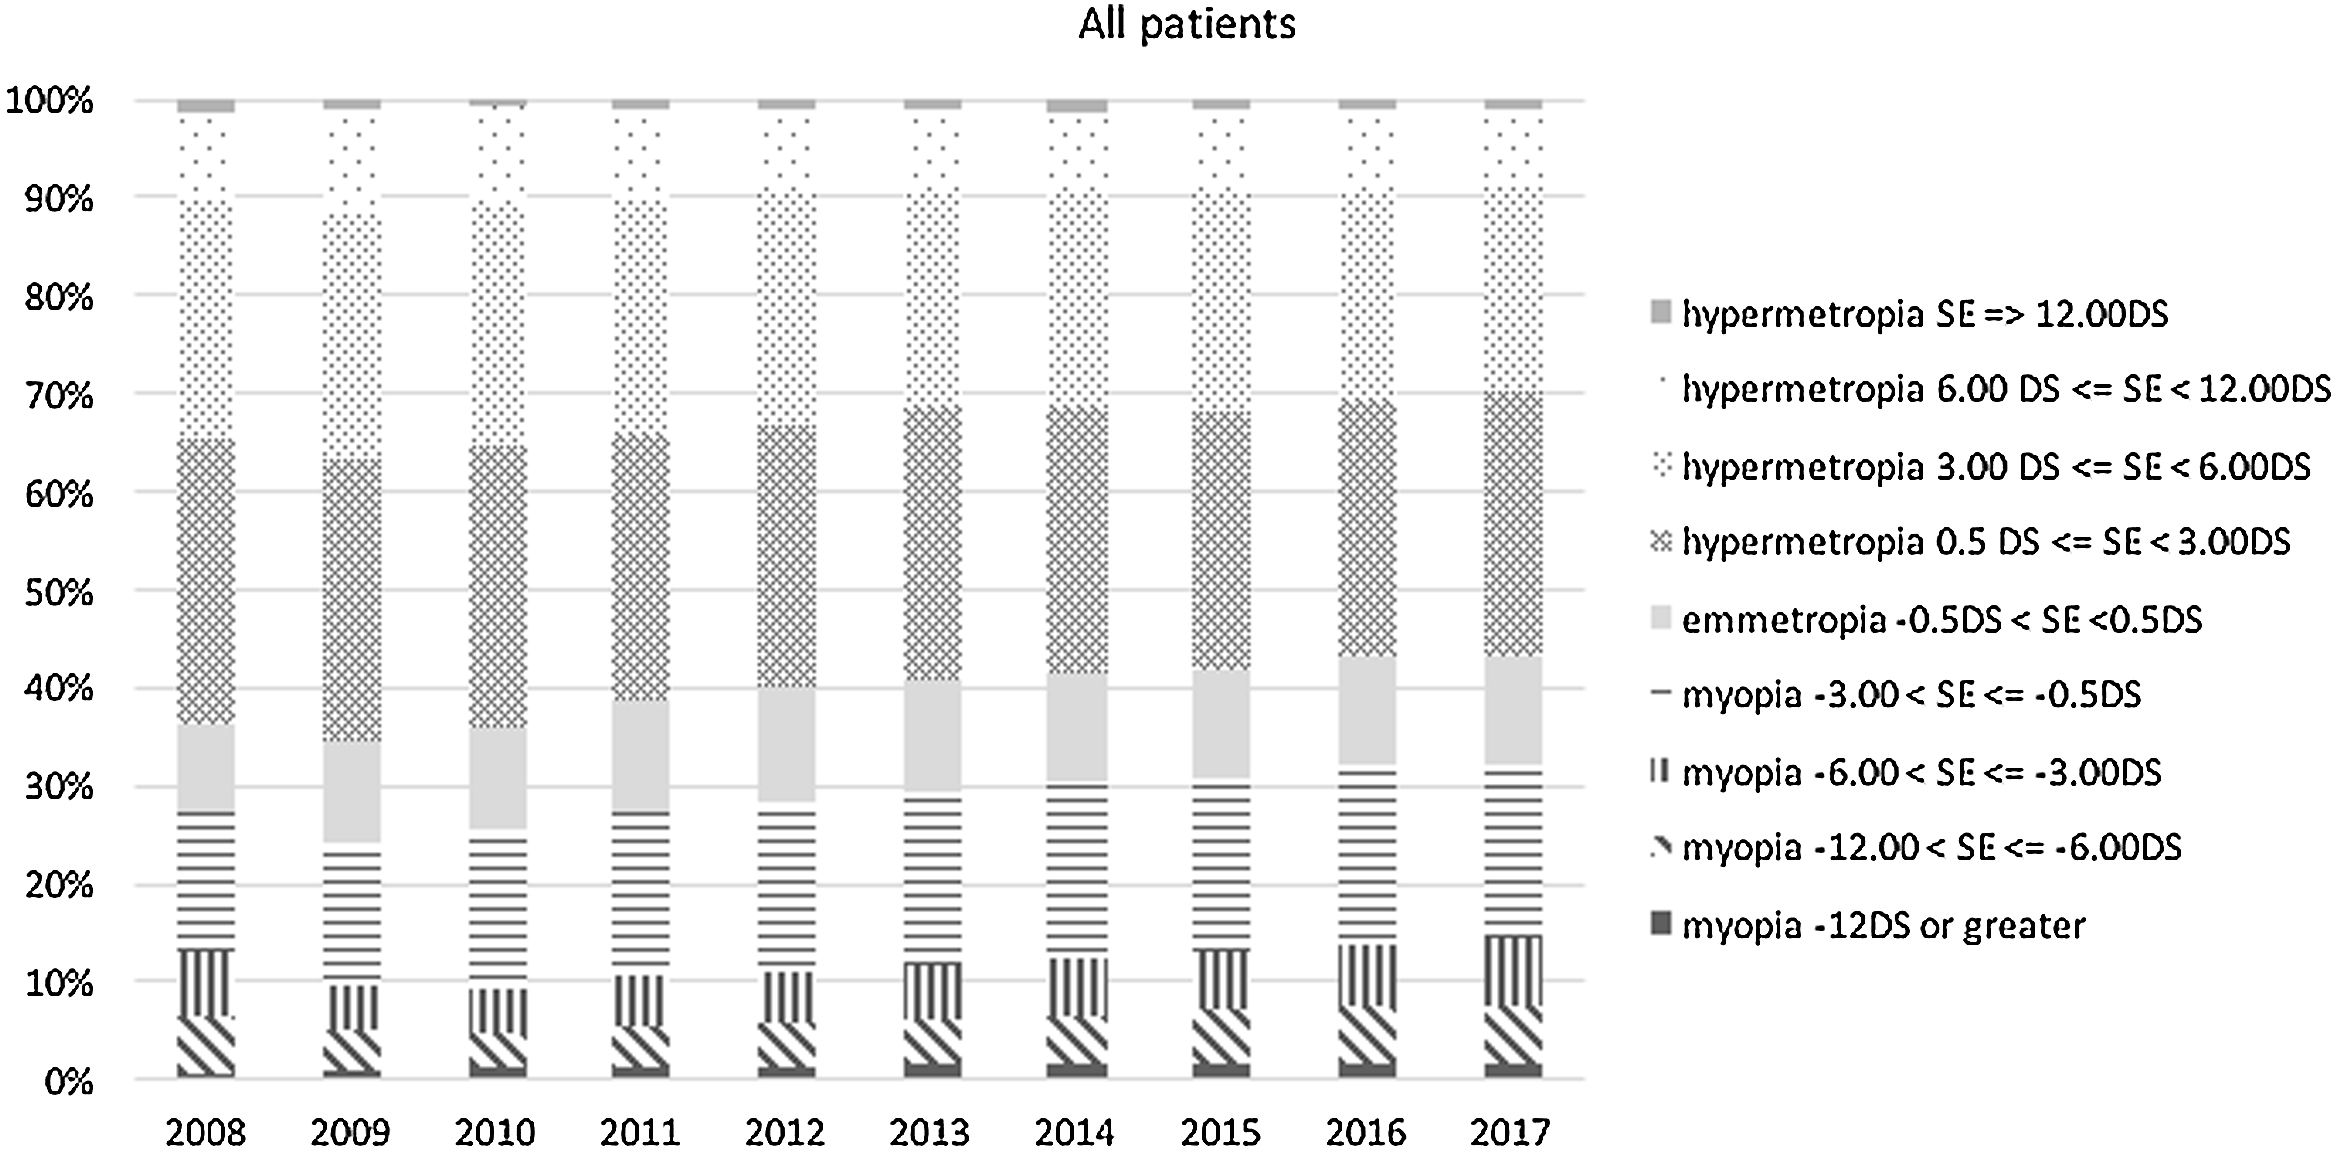
We excluded 17,878 children who at their first refraction had hypermetropia, emmetropia or high myopia. We identified those with mild and moderate myopia at the first refraction (n = 5715). Of these, 2360 only had one refraction at our hospital, and no follow-up data were available. In those with follow-up refractions (n = 3355), 2095 (62%) experienced progression of myopia, 1130 boys (54%) and 965 girls (46%). In 1260 children, there was no progression. Table 1 summarises the demographic details of those with and without progression of myopia. In those with progression, the median age at first refraction (IQR) was 5.6 (4.1–7.3) years; in those without progression, 4.8 (3.3–6.1) years (Table 2). In those with progression, the median duration of follow-up was 2 (1.1–3.7) years. At first refraction, 1599 children had mild, and 496 had moderate myopia.
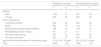
Demographic characteristics of n = 2095 children with and n = 1260 without myopia progression, who had mild (spherical equivalent less than −3.00D) or moderate myopia at first refraction (between −3.00D and less than −6.00D).
| Progressive myopia | Non-progressive myopia | |||
|---|---|---|---|---|
| n | % | n | % | |
| Gender | ||||
| Male | 1130 | 54 | 657 | 52 |
| Female | 965 | 46 | 603 | 48 |
| Ethnic background | ||||
| Asian/Asian British | 546 | 26 | 289 | 23 |
| White | 342 | 16 | 198 | 16 |
| Black/African/Caribbean/Black British | 198 | 10 | 146 | 12 |
| Mixed/Multiple Ethnic Groups | 56 | 3 | 31 | 3 |
| Any other ethnic group | 397 | 19 | 249 | 20 |
| Not stated/unknown | 556 | 27 | 347 | 28 |
| Age at first refraction (median, interquartile range) | 5.6 (4.1 to 7.3) years | 4.8 (3.3 to 6.1) years | ||
| Total | 2095 | 100 | 1260 | 100 |
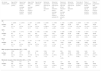
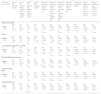
Age, spherical equivalent and rate of progression by gender and myopia severity at first prescription in 2095 children in whom myopia progressed. The rate of progression is slightly higher before the average age of onset of puberty, in girls, and in those with moderate myopia.
| all values median (IQR) | Age at first refraction (years) | Age at last refraction before average age at onset of puberty (years) | Age at first refraction after average age at onset of puberty (years) | Age at last refraction (years) | Spherical equivalent right eye at first refraction (D) | Spherical equivalent right eye at last refraction before average age at onset of puberty (D) | Spherical equivalent right eye at first refraction after average age at onset of puberty (D) | Spherical equivalent right eye at last refraction (D) | Total rate of progression (D/year) | Rate of progression before average age at onset of puberty (D/year) | Rate of progression after average age at onset of puberty (D/year) |
|---|---|---|---|---|---|---|---|---|---|---|---|
| All | |||||||||||
| n | n = 2095 | n = 2018 | n = 337 | n = 2095 | n = 2095 | n = 1990 | n = 406 | n = 2095 | n = 2095 | n = 1951 | n = 209 |
| median | 5.6 | 8 | 12.1 | 8.1 | −1.5 | −2.5 | −2.88 | −2.75 | −0.4 | −0.41 | −0.35 |
| IQR | (4.1 to 7.3) | (6.5 to 9.6) | (11.5 to 12.7) | (6.5 to 10.2) | (−0.88 to −2.75) | (−1.5 to −4.25) | (−1.5 to −4.63) | (−1.5 to −4.4) | (−0.19 to −0.74) | (−0.19 to −0.78) | (−0.14 to −0.63) |
| Girls | |||||||||||
| n | n = 965 | n = 910 | n = 196 | n = 965 | n = 965 | n = 882 | n = 266 | n = 965 | n = 965 | n = 870 | n = 129 |
| median | 5.7 | 8 | 11.6 | 8.2 | −1.5 | −2.5 | −2.69 | −2.75 | −0.42 | −0.44 | −0.34 |
| IQR | (4.1 to 7.6) | (6.5 to 9.5) | (11.2 to 12.1) | (6.6 to 10.3) | (-0.88 to -2.75) | (-1.47 to -4.03) | (-1.5 to -4.63) | (-1.5 to -4.38) | (-0.21 to -0.8) | (-0.21 to -0.83) | (-0.13 to -0.68) |
| Boys | |||||||||||
| n | n = 1130 | n = 1108 | n = 141 | n = 1130 | n = 1130 | n = 1108 | n = 140 | n = 1130 | n = 1130 | n = 1081 | n = 80 |
| median | 5.4 | 8 | 12.6 | 8 | −1.5 | −2.5 | −3.31 | −2.63 | −0.38 | −0.38 | −0.35 |
| IQR | (4.1 to 7.2) | (6.4 to 9.8) | (12.3 to 13) | (6.5 to 10.1) | (-1 to -2.91) | (-1.5 to -4.25) | (-1.66 to -4.75) | (-1.5 to -4.5) | (-0.18 to -0.72) | (-0.17 to -0.75) | (-0.18 to -0.55) |
| Mild myopia at first refraction (SE > −3 DS) | |||||||||||
| n | 1599 | 1547 | 246 | 1599 | 1599 | 1522 | 299 | 1599 | 1599 | 1489 | 151 |
| median | 5.5 | 7.8 | 12.1 | 8 | −1.25 | −2 | −2.25 | −2.13 | −0.37 | −0.37 | −0.31 |
| IQR | (4.2 to 7.3) | (6.4 to 9.6) | (11.5 to 12.5) | (6.4 to 10) | (-0.75 to -1.75) | (-1.25 to -3) | (-1.25 to -3.25) | (-1.38 to -3) | (-0.18 to -0.68) | (-0.17 to -0.71) | (-0.12 to -0.6) |
| Moderate myopia at first refraction (SE <= −3 DS) | |||||||||||
| n | 496 | 471 | 91 | 496 | 496 | 468 | 107 | 496 | 496 | 462 | 58 |
| median | 5.8 | 8.2 | 12.3 | 8.4 | −4 | −5.5 | −5.38 | −5.63 | −0.54 | −0.56 | −0.42 |
| IQR | (3.7 to 7.5) | (6.8 to 9.9) | (11.5 to 13.1) | (7 to 10.8) | (-3.5 to -4.88) | (-4.38 to -6.5) | (-4.25 to -6.38) | (-4.5 to -6.75) | (-0.26 to -0.95) | (-0.25 to -0.98) | (-0.21 to -0.71) |
In the overall sample for whom follow-up refraction data were available (n = 3355), the median progression rate was −0.16 (interquartile range, −0.5 to 0.04) D/year. In those who experienced progression (n = 2095), its median rate was −0.40 (−0.19 to −0.74) D/year. The progression rate was slightly higher in girls (−0.42 D/year, −0.21 to −0.8, n = 965) than in boys (−0.38 D/year, IQR −0.18 to −0.72, n = 1130); p = 0.02. Progression was faster in initial moderate than initial mild myopia, p < 0.001 (median −0.54 vs −0.37 D/year), and before than after average age of onset of puberty, p = 0.013 (median −0.41 vs −0.35 D/year, Table 2). There was no statistically significant difference between children of different ethnic backgrounds (Table 3).
Age, spherical equivalent and rate of progression by ethnic background in 2095 children in whom myopia progressed. There is no statistically significant difference in rate of progression between children of different ethnic backgrounds.
| all values median (IQR) | Age at first refraction (years) | Age at last refraction before average age at onset of puberty (years) | Age at first refraction after average age at onset of puberty (years) | Age at last refraction (years) | Spherical equivalent right eye at first refraction (D) | Spherical equivalent right eye at last refraction before average age at onset of puberty (D) | Spherical equivalent right eye at first refraction after average age at onset of puberty (D) | Spherical equivalent right eye at last refraction (D) | Total rate of progression (D/year) | Rate of progression before average age at onset of puberty (D/year) | Rate of progression after average age at onset of puberty (D/year) |
|---|---|---|---|---|---|---|---|---|---|---|---|
| Asian/Asian British | |||||||||||
| n | 546 | 539 | 80 | 546 | 546 | 530 | 104 | 546 | 546 | 520 | 50 |
| median | 5.5 | 8.1 | 12.0 | 8.1 | −1.50 | −2.44 | −3.00 | −2.63 | −0.40 | −0.41 | −0.19 |
| IQR | (4.1 to 7.2) | (6.5 to 9.9) | (11.4 to 12.6) | (6.5 to 10.2) | (−0.88 to −2.50) | (−1.5 to −4.13) | (−1.91 to −4.84) | (−1.5 to −4.38) | (−0.17 to −0.74) | (−0.18 to −0.78) | (-−0.06 to −0.43) |
| White | |||||||||||
| n | 342 | 325 | 75 | 342 | 342 | 322 | 85 | 342 | 342 | 316 | 47 |
| median | 5.8 | 8.4 | 12.2 | 8.9 | −1.50 | −2.75 | −2.63 | −3.00 | −0.42 | −0.45 | −0.39 |
| IQR | (3.8 to 7.6) | (7 to 10.1) | (11.3 to 12.6) | (7.1 to 11.1) | (−0.88 to −3.13) | (−1.5 to −5.03) | (−1.31 to −4.69) | (−1.72 to −5) | (−0.19 to −0.78) | (−0.18 to −0.83) | (−0.1 to −0.67) |
| Black/African/Caribbean/Black British | |||||||||||
| n | 198 | 193 | 27 | 198 | 198 | 189 | 38 | 198 | 198 | 187 | 17 |
| median | 5.5 | 8.0 | 12.4 | 8.1 | −1.69 | −2.75 | −2.81 | −2.88 | −0.38 | −0.38 | −0.27 |
| IQR | (3.8 to 7.3) | (6.6 to 9.9) | (11.7 to 12.9) | (6.7 to 10.2) | (−1 to −2.78) | (−1.75 to −4.13) | (−2.09 to −4.25) | (−1.75 to −4.25) | (−0.23 to −0.68) | (−0.23 to −0.75) | (0.02 to −0.5) |
| Mixed/Multiple Ethnic Groups | |||||||||||
| n | 56 | 56 | 12 | 56 | 56 | 55 | 12 | 56 | 56 | 56 | 7 |
| median | 5.3 | 8.2 | 12.3 | 8.3 | −1.75 | −3.00 | −4.00 | −3.13 | −0.46 | −0.48 | −0.24 |
| IQR | (4 to 6.9) | (6.5 to 9.8) | (11.5 to 12.9) | (6.5 to 10.6) | (−1.03 to −3.09) | (−2.25 to −4.25) | (−2.44 to −8.53) | (-−2.25 to −4.75) | (−0.2 to −0.79) | (−0.24 to −0.91) | (−0.19 to −0.5) |
| Any other ethnic group | |||||||||||
| n | 397 | 376 | 59 | 397 | 397 | 374 | 68 | 397 | 397 | 365 | 38 |
| median | 5.4 | 7.7 | 12.1 | 7.8 | −1.38 | −2.25 | −2.69 | −2.38 | −0.37 | −0.36 | −0.46 |
| IQR | (4.3 to 7.1) | (6.2 to 9.5) | (11.7 to 12.8) | (6.3 to 9.9) | (−0.88 to −2.56) | (−1.38 to −3.88) | (−1.38 to −4.63) | (−1.5 to −4) | (−0.18 to −0.7) | (−0.16 to −0.73) | (−0.2 to −0.7) |
| Not stated/unknown | |||||||||||
| n | 556 | 529 | 84 | 556 | 556 | 520 | 99 | 556 | 556 | 507 | 50 |
| median | 5.6 | 7.7 | 12.2 | 7.8 | −1.50 | −2.50 | −2.75 | −2.75 | −0.41 | −0.42 | −0.42 |
| IQR | (4.1 to 7.4) | (6.3 to 9.3) | (11.5 to 12.8) | (6.4 to 9.6) | (−0.88 to −3) | (−1.5 to −4.25) | (−1.5 to −4.25) | (−1.5 to −4.5) | (−0.2 to −0.78) | (−0.19 to −0.83) | (−0.31 to −0.69) |
This evaluation presents five key findings: between 2009 and 2017, the proportion of children with myopia in our paediatric population increased by 8%, or around 1% per year. Myopia progressed in 62% of those with initial mild or moderate myopia. The rate of progression was slightly higher in girls than in boys, faster before than after the average age of onset of puberty, but did not differ between children of different ethnic backgrounds.
The retrospective study design introduces a number of limitations. Principally, our data are affected by selection bias. Our institution provides secondary and tertiary eye care for children and young people. Primary eye care for children from the age of 7 years, the age group in whom myopia is most prevalent, is provided by community optometrists. Our clinic population includes a significant proportion of children with eye conditions which are associated with high myopia, such as certain retinal dystrophies and childhood onset glaucoma. We attempted to reduce this bias by including prescriptions issued at our satellite clinics at other hospitals and community clinics throughout London, and by limiting the analysis to those with mild and moderate myopia at presentation. The median age of the population of children presented here was 5.4 years, an age at which hypermetropia and emmetropia are expected to be more prevalent than myopia. We cannot comment on a possible increase in the prevalence of myopia in the general paediatric population, but findings in our hospital cohort may be representative of general trends, or may even underestimate the rise of myopia in children over the age of 7 years, and teenagers. We excluded children with high myopia, as they were more likely to have underlying or associated ocular morbidities, and may not be representative of the paediatric population with isolated myopia. However, they may be an important group to study the causes of high myopia at a young age, such as retinopathy of prematurity, childhood glaucoma or retinal dystrophies. Another limitation arises from the limited amount of individual data available. We did not have access to information about parental myopia, parents’ or children’s education, near-work load, outdoor activities time, all of which are known to be associated with myopia development and progression.17 None of the children and young people included in this analysis would have used optical or pharmacological treatments to slow down myopia progression, as these are not funded by the UK National Health Service. We set a cut-off age for the onset of puberty, 11 years in girls and 12 years in boys, but puberty begins within a range of ages, and we had no information about individual children’s general development. However, setting different age ranges for boys and girls may be important, as both growth spurts and myopia progression may be linked with puberty.18 Our observation that the proportion of children requiring glasses is increasing mirrors large epidemiological studies and predictions. An epidemiological study reported that in Northern Ireland, 1.9% of 6–7 year olds, and 16.4% of 12–13 year olds are myopic, more than double the prevalence in 50 years ago.10 In 2000, worldwide around 5% of children age 5–9 years, and over 10% of those age 10–14 years were estimated to have myopia, and these numbers are predicted to rise substantially over the next 30 years.1 As the onset of myopia affects younger children, and can progress into late adolescence, the proportion of adults with myopia and particularly those with high myopia will increase. High myopia is associated with sight-threatening complications such as choroidal neovascularisation, glaucoma and retinal detachment, and may therefore become an increasing public health problem.19,20 Our findings indicate that whilst the absolute numbers may be less than those reported in East Asian countries,21 the trend will be similar.
The reasons for the rise in myopia prevalence and progression during the childhood years are still not fully understood; parental myopia, educational demands, sustained near-work and accommodative effort, a reduction in time spend outdoors and reduced exposure to sunlight, gender, ethnicity, lifestyles, socioeconomic factors and family income may all play a part.17,22–24
It is generally considered that myopia progression is faster in children of East Asian ancestry. Our data, however, suggest that in urban London, children of different ethnic backgrounds show similar rates of progression, indicating that environmental factors may significantly modify the role of genetic factors. In particular, children in this study may share a similar learning environment, which may strongly influence the development of myopia.17 Our findings are consistent with those of the Generation R study in the Netherlands, which reported higher incidence of myopia in children of non-European ancestry, linked to environmental and lifestyle factors.25
The influence of gender is controversial, and differs between populations. Girls in urban China are more likely to have myopia than boys, whilst in Iran, myopia appears to affect boys more than girls.26,27 In our evaluation, there were slightly more boys in all groups: children with progressive and non-progressive myopia, as well as the overall population of children requiring glasses. Progression however was slightly faster in girls.
The median rate of progression in our cohort was 0.4D/year in those children who experienced progression, and 0.16D/year in the overall sample. This is higher than previously reported for White children taking part in an epidemiological study in Northern Ireland.10 In that study, the annual rate of progression was 0.09D/year in children between the ages of 6 and 13 years, and 0.18D/year in young people between 12 and 20 years.10 Two main factors are likely to contribute to the higher rate we observed: the multi-ethnic background of our cohort, and data collection within a hospital environment.
We found faster progression in those children with moderate than mild myopia at first prescription. This may reflect genetic predisposition or environmental factors.22–24,28 It is also possible that once it has reached a certain level, myopia is more likely to increase further, due to changes in the biomechanical properties of the scleral extracellular matrix.29
We did not observe significant differences in rate of myopia progression before and after our cut-off age for onset of puberty. A prospective study design, including data on overall growth and development, would be required to investigate the influence of growth hormones and environmental factors at different ages.
In summary, this evaluation observed an increase in the proportion of glasses prescriptions for myopia in children attending our facility, and indicates that in urban London, rates of progression are similar regardless of ethnic background. Further research is needed to unravel the factors affecting myopia onset and progression to avert the public health risk of increasing numbers of people suffering sight-threatening complications associated with high myopia. Future randomised controlled trials might best be set up at hospital eye clinics, where autorefractors and contact-free axial length measurements as well as expertise with investigational medicines are available, but with links to primary ophthalmic practitioners such as local optometrist, who at present manage the majority of children with myopia. Future research should also collect data about potential confounding factors, such as parental spectacle prescriptions, ethnic background, daily amount of near work and time spent outdoors. Bringing these data and facilities together will enable us to identify those children who will benefit most from new treatments to slow down myopia progression, whilst minimising their exposure to potential harm.
DisclosureNone of the authors has conflicts to declare with regards to this publication. This research received no specific grant from any funding agency in the public, commercial, or not-for-profit sectors. The research was supported by the National Institute for Health Research (NIHR) Moorfields Biomedical Research Centre. The views expressed are those of the authors and not necessarily those of the NHS, the NIHR or the Department of Health.
Conflicts of interestThe authors have no conflicts of interest to declare.
We thank Mr Mark Deaton (Ocuco Ltd.) for providing the refraction data, and Mr Menachem Katz (Moorfields Eye Hospital) for matching the refraction data with demographic data from the patient administration system.


