


To determine the influence of age and gender on macular sensitivity to light in healthy subjects of 4 age groups using the MP-1 microperimeter.
MethodsA prospective study was carried out on 50 healthy subjects (age range: 18–60 years) divided into 4 age groups; 18–30 years, 31–40 years, 41–50 years and 51–60 years. Full-threshold microperimetry of the central 10° of retina was performed utilizing 32 points with the MP-1. Macula area was divided into four quadrants, which were superior nasal (SN), inferior nasal (IN), inferior temporal (IT) and superior temporal (ST).
ResultsTotal mean sensitivity at 10° for age groups 18–30 years, 31–40 years, 41–50 years and 51–60 years were 19.46±0.30, 19.40±0.39, 19.47±0.35 and 18.73±0.75 (dB), respectively. There was a significant difference in total mean retinal sensitivity at 10° and at the four quadrants with age but not for gender. The retinal sensitivity was highest in the IT quadrant and lowest in the SN quadrant for all age groups. The linear regression analysis revealed that there was a 0.019dB, 0.016dB, 0.022dB, 0.029dB and 0.029dB per year age-related decline in mean macular sensitivity within the central 10° diameter in the SN, IN, IT and ST quadrants respectively.
ConclusionAmong normal healthy subjects, there was a linear decline in retinal light sensitivity with increasing age with the highest reduction in the superior nasal quadrant and lowest in the inferior temporal quadrant.
Determinar la influencia de la edad y el sexo en la sensibilidad macular a la luz en sujetos sanos de cuatro grupos de edad, utilizando el microperímetro MP-1.
MétodosSe llevó a cabo un estudio prospectivo en 50 sujetos sanos (rango de edad: 18-60 años), divididos en cuatro grupos de edad; 18-30 años, 31-40 años, 41-50 años y 51-60 años. Se realizó una microperimetría de umbral completo de los 10° centrales de la retina, utilizando 32 puntos con el sistema MP-1. El área macular se dividió en cuatro cuadrantes: superior nasal (SN), inferior nasal (IN), inferior temporal (IT) y superior temporal (ST).
ResultadosLa sensibilidad media total a los 10° para los grupos de edad de 18-30 años, 31-40 años, 41-50 años y 51-60 años fue de 19,46±0,30, 19,40±0,39, 19,47±0,35 y 18,73±0,75 (dB) respectivamente. Se produjo una diferencia significativa de la sensibilidad retiniana media total a los 10°, y en los cuatro cuadrantes, asociada a la edad pero no al sexo. La sensibilidad retiniana fue superior en el cuadrante IT y menor en el SN en todos los grupos de edad. El análisis de la regresión lineal reveló una disminución anual asociada a la edad de la sensibilidad macular media de 0,019dB, 0,016dB, 0,022dB, 0,029dB y 0,029dB dentro del diámetro central de 10° en los cuadrantes SN, IN, IT y ST respectivamente.
ConclusiónEntre los sujetos sanos normales, se produjo una disminución lineal de la sensibilidad retiniana a la luz al incrementar la edad, produciéndose la mayor reducción en el cuadrante superior nasal y la menor en el cuadrante inferior temporal.
Various conventional perimeters are currently used during clinical examination to map the central visual fields, which includes the macular area. However, the precision of evaluation of macular area by conventional perimeters is often insufficient. This is because the accuracy of the conventional visual field is based on the assumption that the patient's fixation during the examination time is always stable and located at the center of the fovea.
Although the Humphery Field Analyser (HFA) can be used to assess central macular sensitivity, it is unable to quantify retinal thresholds accurately over small and discrete retinal lesions. The scanning laser ophthalmoscope (SLO), instead, is able to achieve an exact correlation between macular and corresponding functional defects but it is very time consuming, cumbersome and does not facilitate automated follow-up examinations.1 The MP-1 microperimeter, however, measures accurately retinal sensitivity within the central field, even in patients with unstable or extrafoveal fixation, unlike other standard perimeters.2 A recent study has revealed that microperimetry can detect more retinal functional damage then standard automated perimetry.3
In patients with macular diseases, microperimetry allows precise mapping of the central visual sensitivity, and provides a good correlation between fundus pathology and the fundus abnormalities.4 Recent publications have shown that the MP-1 is clinically useful in various central retinal pathologies.5,6
However, normative data according to age for the retinal light sensitivity are limited. To date, four studies have reported data on normal subjects. One study7 reported the normative data for 37 healthy subjects (66 eyes) of age range 19–71 years. However, the age distribution of the subjects was not mentioned in their study. A recent study8 reported normative data in 190 healthy Italian subjects (190 eyes) between the ages of 20 and 75 years. There were another 2 studies9,10 which reported retinal sensitivity data in normal subjects although it was not the main objective of the study.
Histological and retinal image studies of the nerve fiber layer in eyes with increasing age suggest that the number of ganglion cells subserving macula function is reduced with increasing age.11 In addition, color perception and visual acuity seem to be reduced with increasing age.12,13
The aim of this study was to evaluate and compare the retinal light sensitivity in four age groups of healthy subjects using the MP-1 microperimeter and to investigate the influence of age and gender.
MethodsStudy design and ethicsThis prospective study was approved by the Universiti Kebangsaan Malaysia Research and Ethics Committee. Informed consent was obtained from all participants prior to the commencement of the study.
SubjectsThe study was performed on 50 healthy Malay individuals who came for a routine ocular examination at the Hospital Selayang, Selangor, Malaysia and volunteered to participate.
Each subject received a comprehensive optometric examination which included measurement of visual acuity, retinoscopy and subjective refraction, a slit-lamp examination, intraocular pressure (IOP) measurement and a fundus examination by an experienced optometrist. A detailed medical and ocular history was elicited from each patient.
Normal eyes were defined as those having best correct visual acuity (BCVA) of 6/9 or better. Refractive errors within ±3.00D sphere and less than or equal to ±1.0D cylinder were included. Eyes with any media opacities, significant ocular pathologies (cataract, glaucoma, etc.) and clinical evidence of macular diseases (age-related macular degeneration, diabetic retinopathy, vascular occlusions, etc.) were excluded. Subjects with any significant systemic problems such as diabetes and hypertension were also excluded from this study.
ProcedureThe fundus perimetry was performed using microperimetry MP-1 (Nidek Technologies, Padova, Italy) in a dark room by a trained optometrist. The subject was dark-adapted for 10min before the actual test was initiated.14 All subjects were given a test run of 5 stimulus presentations before starting the actual measurements in order to familiarize them with the protocol and minimize the learning effect on their performance.
The stimulus size used was Goldmann III (0.41° diameter) with a presentation time of 200ms and 1.27cd/m2 background illumination.2 The MP-1 threshold was performed within 10° of the retina central (1°=300μm, thus 10°=3000μm that encompasses the macular area) by using a 32-point strategy. The starting threshold value used in the study was 16dB, and the software then performed a staircase algorithm. Four out of 32 total points were tested on the 2° from center of fovea; whereas the 28 points were tested on 10° at the retina central (refer to Fig. 1a). The mean retinal sensitivity changes within 10° at the central retina were recorded and analyzed into four quadrants15 which were: superior nasal (SN), superior temporal (ST), inferior nasal (IN), and inferior temporal (IT) (refer Fig. 1b).
 MP-1 stimulation within 20° diameter of the retina central. (b) The four quadrant area within 20° of the retina central.")
The computer-controlled system includes an autotracking system (25times/s) for tracking the fundus movements during the examination. The tracking is performed on a black and white infrared image of the fundus (infrared image resolution: 768×576 pixels). The retinal autotracking was done by tagging a region of interest of the fundus. MP-1 calculates automatically the percentage of the number of times fixation was maintained within 20 degree diameter at the central retina.
The horizontal and vertical alignment shifts between subsequent frames due to the saccadic eye movements that are detected and compensated for by a correlation algorithm in real time. The system automatically adapts the projected stimuli to the fundus shifted. If the fundus is not aligned at a particular point in time, the microperimetry automatically recalibrates and realigns before resuming the test. The system also pauses and restarts when the eyes blink.
A color photograph (780×582 pixels) was captured by the corporate non-mydriatic fundus camera subsequent to the examination. The perimetry and fixation pattern maps are then superimposed on the color fundus image allowing simultaneous anatomical and functional correlation of the retinal pathology.
The intensity of the stimuli ranged from 0dB (1.27cd/m2) to 20dB (2.54cd/m2). The fixation target used for all the subjects was a 1° single cross. The 4-2-1 automated staircase threshold strategy for all eyes similar to the conventional computerized static perimeters was used.
The test commenced after the subject was comfortable with the procedure. False-positive responses were monitored by the machine by projecting a suprathreshold stimulus onto the blind spot, which is manually designated to the machine by the examiner over the optic nerve at the beginning of the test. Any test with even 1 false-positive error was excluded. The software (version: MP-1SW 1.4.1 SP1) automatically calculates the percentage of times fixation was maintained within 20° diameter at the point of fixation, which was noted for right eye. The total effective time (i.e. the time the microperimetry could track the fundus and project the point, which excludes the time the machine paused due to patient mobility or blinking) to measure the 32 points of the central retina sensitivity was also noted.
Statistical analysisStatistical analyses were performed using SPSS software version 20.0 (SPSS, Chicago, IL, USA). Differences in age and retinal light sensitivity were evaluated among the quadrants using one-way ANOVA statistical test. Linear regression analysis was used to measure the strength of the linear relationship between retinal light sensitivity and age. The distribution of gender in this study was evaluated by using the chi-squared analysis. Statistical significance was assumed to occur at p<0.05.
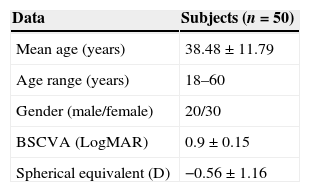
ResultsA total of 50 eyes of 50 healthy Malay subjects met the study's inclusion criteria and were prospectively enrolled. The demographic information such as mean age, age range, gender, best sphere corrected visual acuity (BSCVA) and the spherical equivalent of the subjects are shown in Table 1.
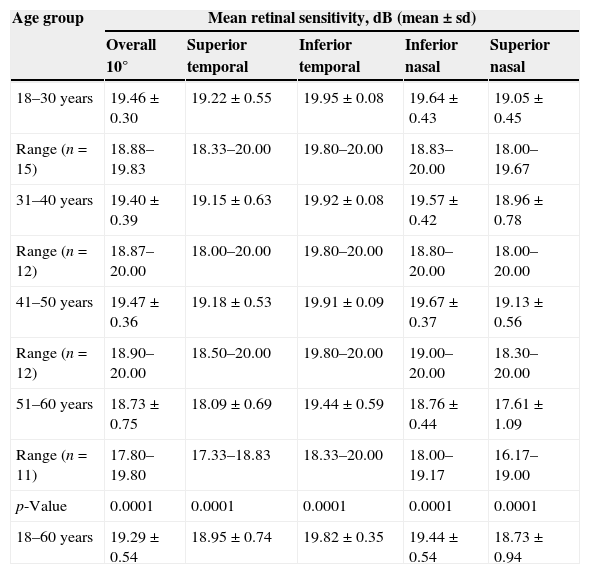
Table 2 shows the mean retinal light sensitivity in different age groups at different retinal areas. In this study the ages were divided into four 10-year age intervals. The total mean retinal sensitivity over all the points for age group 18–30 years, 31–40 years, 41–50 years and 51–60 years were 19.46±0.30dB, 19.40±0.39dB, 19.47±0.35dB and 18.73±0.75dB respectively. There was a statistically significant difference between age groups in total mean retinal sensitivity as determined by one-way ANOVA [F(3, 46)=6.819, p=0.001]. Similarly, there were significant effects of age on mean retinal sensitivity at the p<0.05 level for the 4 age groups in ST [F(3, 46)=9.546, p=0.000], IT [F(3, 46)=8.243, p=0.000], IN [F(3, 46)=12.481, p=0.000] and SN [F(3, 46)=11.007, p=0.000]. A Tukey post hoc test comparison of the 4 age groups indicate that there was a significant difference for age groups 18–30 years, 31–40 years and 41–50 years with 51–60 years in total mean retinal sensitivity (19.46±0.30dB p=0.001, 19.40±0.39dB p=0.006, 19.47±0.35dB p=0.002 respectively) and mean retinal sensitivity in all 4 quadrants (SN: 19.64±0.45dB p=0.000, 19.57±0.42dB p=0.000, 19.67±0.37dB p=0.000; IN: 19.64±0.43dB p=0.000, 19.57±0.42dB p=0.000, 19.67±0.37dB p=000; IT: 19.95±0.08dB p=0.000, 19.92±0.08dB p=0.001, 19.91±0.10dB p=0.002; ST: 19.22±0.55dB p=0.000, 19.15±0.63dB p=0.001, 19.18±0.53dB p=0.000 respectively)
Mean retinal light sensitivity (dB) in different age groups.
| Age group | Mean retinal sensitivity, dB (mean±sd) | ||||
|---|---|---|---|---|---|
| Overall 10° | Superior temporal | Inferior temporal | Inferior nasal | Superior nasal | |
| 18–30 years | 19.46±0.30 | 19.22±0.55 | 19.95±0.08 | 19.64±0.43 | 19.05±0.45 |
| Range (n=15) | 18.88–19.83 | 18.33–20.00 | 19.80–20.00 | 18.83–20.00 | 18.00–19.67 |
| 31–40 years | 19.40±0.39 | 19.15±0.63 | 19.92±0.08 | 19.57±0.42 | 18.96±0.78 |
| Range (n=12) | 18.87–20.00 | 18.00–20.00 | 19.80–20.00 | 18.80–20.00 | 18.00–20.00 |
| 41–50 years | 19.47±0.36 | 19.18±0.53 | 19.91±0.09 | 19.67±0.37 | 19.13±0.56 |
| Range (n=12) | 18.90–20.00 | 18.50–20.00 | 19.80–20.00 | 19.00–20.00 | 18.30–20.00 |
| 51–60 years | 18.73±0.75 | 18.09±0.69 | 19.44±0.59 | 18.76±0.44 | 17.61±1.09 |
| Range (n=11) | 17.80–19.80 | 17.33–18.83 | 18.33–20.00 | 18.00–19.17 | 16.17–19.00 |
| p-Value | 0.0001 | 0.0001 | 0.0001 | 0.0001 | 0.0001 |
| 18–60 years | 19.29±0.54 | 18.95±0.74 | 19.82±0.35 | 19.44±0.54 | 18.73±0.94 |
A repeated measures ANOVA showed that the mean scores for retinal sensitivity for age group 18–30 years were statistically significantly different between quadrants (F(3, 42)=21.443, p<0.0005). Post hoc tests using the Bonferroni correction revealed that the retinal sensitivity in the inferior nasal quadrant was significantly higher than the superior nasal quadrant (p=0.007), the inferior temporal quadrant was significantly higher than the superior nasal quadrant (p=0.000), the inferior nasal quadrant was significantly higher than the superior temporal quadrant (p=0.03) and the inferior temporal quadrant was significantly higher than the superior temporal quadrant (p=0.001).
Similarly, a repeated measures ANOVA showed that the mean scores for retinal sensitivity for age group 31–40 years were statistically significantly different between quadrants (F(3, 33)=12.038, p<0.0005). Post hoc tests using the Bonferroni correction revealed that the retinal sensitivity in the inferior nasal quadrant was significantly higher than the superior nasal quadrant (p=0.047), the inferior temporal quadrant was significantly higher than the superior nasal quadrant (p=0.005), the inferior temporal quadrant was significantly higher than the superior temporal quadrant (p=0.006) and the inferior temporal quadrant was significantly higher than the inferior nasal quadrant (p=0.039).
For the age group 41–50 years, a repeated measures ANOVA with a Greenhouse–Geisser correction showed that the mean scores for retinal sensitivity were statistically significantly different between quadrants (F(1.791, 19.702)=19.749, p<0.0005). Post hoc tests using the Bonferroni correction revealed that the retinal sensitivity in the inferior nasal quadrant was significantly higher than the superior nasal quadrant (p=0.005), the inferior temporal quadrant was significantly higher than the superior nasal quadrant (p=0.002), the inferior nasal quadrant was significantly higher than the superior temporal quadrant (p=0.014) and the inferior temporal quadrant was significantly higher than the superior temporal quadrant (p=0.002).
A repeated measures ANOVA with a Greenhouse–Geisser correction revealed that the mean scores for retinal sensitivity for age group 51–60 years were statistically significantly different between quadrants (F(1.623, 16.227)=18.234, p<0.0005). Post hoc tests using the Bonferroni correction revealed that the retinal sensitivity in the inferior nasal quadrant was significantly higher than the superior nasal quadrant (p=0.015), the inferior temporal quadrant was significantly higher than the superior nasal quadrant (p=0.006), the inferior nasal quadrant was significantly higher than the superior temporal quadrant (p=0.006) and the inferior temporal quadrant was significantly higher than the superior temporal quadrant (p=0.001).
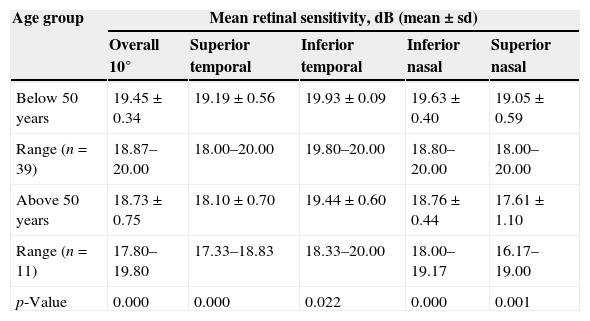
The data were then divided into 2 age groups of below 50 years and above 50 years of age. Table 3 shows the mean retinal sensitivity within the central 10° and the four quadrants.
Mean retinal light sensitivity (dB) in age groups below 50 years and above 50 years.
| Age group | Mean retinal sensitivity, dB (mean±sd) | ||||
|---|---|---|---|---|---|
| Overall 10° | Superior temporal | Inferior temporal | Inferior nasal | Superior nasal | |
| Below 50 years | 19.45±0.34 | 19.19±0.56 | 19.93±0.09 | 19.63±0.40 | 19.05±0.59 |
| Range (n=39) | 18.87–20.00 | 18.00–20.00 | 19.80–20.00 | 18.80–20.00 | 18.00–20.00 |
| Above 50 years | 18.73±0.75 | 18.10±0.70 | 19.44±0.60 | 18.76±0.44 | 17.61±1.10 |
| Range (n=11) | 17.80–19.80 | 17.33–18.83 | 18.33–20.00 | 18.00–19.17 | 16.17–19.00 |
| p-Value | 0.000 | 0.000 | 0.022 | 0.000 | 0.001 |
The mean retinal sensitivity is significantly different between the two age groups within the central 10° and all four quadrants of the retina. The retinal sensitivities are highest in the inferior temporal quadrant, followed by the inferior nasal, superior temporal and lowest in the superior nasal quadrant. The reduction in mean retinal sensitivity is 3.7%, 7.6%, 5.7%, 4.4% and 2.5% within the central 10° in superior nasal, superior temporal, inferior nasal and inferior temporal quadrants respectively.
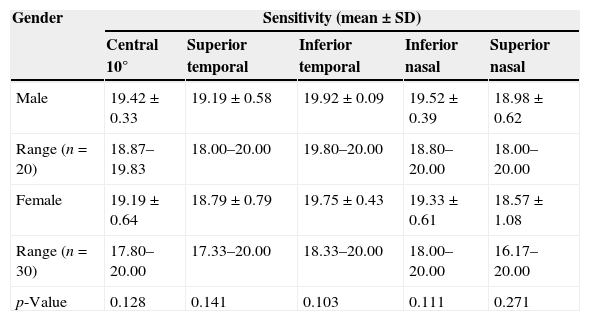
Table 4 shows the mean retinal light sensitivity in different quadrants with gender. There was no statistically significant difference in mean retinal light sensitivity within all quadrants (p-value >0.05) at confidence interval, CI 95%, between genders.
Mean retinal sensitivity (dB) with gender.
| Gender | Sensitivity (mean±SD) | ||||
|---|---|---|---|---|---|
| Central 10° | Superior temporal | Inferior temporal | Inferior nasal | Superior nasal | |
| Male | 19.42±0.33 | 19.19±0.58 | 19.92±0.09 | 19.52±0.39 | 18.98±0.62 |
| Range (n=20) | 18.87–19.83 | 18.00–20.00 | 19.80–20.00 | 18.80–20.00 | 18.00–20.00 |
| Female | 19.19±0.64 | 18.79±0.79 | 19.75±0.43 | 19.33±0.61 | 18.57±1.08 |
| Range (n=30) | 17.80–20.00 | 17.33–20.00 | 18.33–20.00 | 18.00–20.00 | 16.17–20.00 |
| p-Value | 0.128 | 0.141 | 0.103 | 0.111 | 0.271 |
There was a linear decline in retinal light sensitivity with age as seen in Fig. 2. The linear regression analysis revealed a 0.019dB per year age-related decline in retinal light sensitivity within the central 10°.

Fig. 3 shows the correlation between retinal sensitivity at quadrants ST, IT, IN and SN with age. The Pearson correlation of retinal sensitivity in all 4 quadrants shows a negative correlation with age. All quadrants show a decline in retinal sensitivity with increasing age. The inferior temporal, inferior nasal, superior temporal and superior nasal have a 0.016dB, 0.022dB, 0.029dB and 0.035dB per year decline in age-related retinal sensitivity, respectively.
Discussion
The microperimeter MP-1 is compact and easy to use. The clinical use of the microperimeter has increased in recent years in evaluating various central retinal pathologies.5,16–18 However, the identification and quantification of abnormalities rely on normative data. Currently, the normative and reference values according to age for the retinal light sensitivities have not been established. These are important to draw meaningful conclusions in a pathological setting where sensitivity losses are compared to normative data.
In the present study, the mean retinal sensitivity at quadrants ST, IT, IN and SN were 18.95±0.74, 19.82±0.35, 19.44±0.54 and 18.73±0.94dB, respectively. The mean retinal sensitivity within the overall 10° macular area was 19.29±0.54dB. An earlier study19 found the mean retinal sensitivity to be 14.6dB. Their results showed lower sensitivities probably because the measurements were made further away from the macula. A previous study using a 16-point strategy reported sensitivities of 18.4, 18.2 and 18.2dB at 2°, 4° and 6° respectively from the center of the macula in 37 healthy subjects aged between 19 and 71 years.7 Another study using a 37-point strategy reported sensitivity of 19.7±0.8dB in 9 healthy subjects.2 A recent study8 using a 77-point strategy found the mean retinal sensitivity of 19.30±0.90dB. These results are comparable to the present study.
Our results indicate that there is significant association between retinal light sensitivity and age. The retinal light sensitivity linearly reduced with age in our normal subjects (Fig. 3). The reduction in retinal sensitivity is highest in the superior nasal quadrant and lowest in the inferior temporal quadrant. The age-related reduction in retinal sensitivity has been attributed by various authors to a decrease in pupil size, decreasing transparency of the ocular media and age-related neural loss.20,21 It is unlikely that reduced pupil size with increasing age alters the retinal sensitivity because the threshold intensity is a fixed proportion of the background light on the retina. Although there are studies22,23 reporting age-related increases in scattering properties of the crystalline lens and thus reducing retinal sensitivity, this could not have caused a reduction in the retinal sensitivity in our study. First, all our subjects were carefully screened to exclude media opacities. Second, if the reduction were due to media opacities, then a uniform loss of sensitivities would have been exhibited throughout the 4 different quadrants. The results in our study show that loss of retinal sensitivity is largest in the superior nasal quadrant and least in the inferior temporal quadrant. Therefore, while lens scattering may have some influence on retinal sensitivity, it does not contribute largely to the age-related reduction in retinal sensitivity.
Many previous studies have reported a linear decrease in visual field sensitivity beyond the age of 20.24,25 Johnson and Choy,26 however, have found evidence that there is an accelerated sensitivity loss for normal subjects over the age of 55 years. Our results show that there is a significant reduction in retinal sensitivity around the age of 50 years. The reduction in sensitivity is also linear and is highest in the superior nasal quadrant.
This implies that the retinal sensitivity losses are probably due to age-related reductions in photopigment density,27,28 photoreceptor density and morphology,29,30 and ganglion cell density31,32 as has been shown by previous studies.
In conclusion, this study confirms a linear decline in retinal light sensitivity with increasing age as shown by previous studies. It also shows that retinal sensitivity reduction is different in different retinal quadrants with the highest reduction in the superior nasal quadrant.
Conflicts of interestThe authors have no conflicts of interest to declare.
The authors thank the ophthalmologists and staff of Selayang Hospital eye specialist clinic for the excellent cooperation during the study.


