


This project explored the relationship of the macular pigment optical density (MPOD) spatial profile with measures of glare disability (GD) across the macula.
MethodsA novel device was used to measure MPOD across the central 16° of retina along four radii using customized heterochromatic flicker photometry (cHFP)at eccentricities of 0°, 2°, 4°, 6° and 8°. MPOD was measured as discrete and integrated values at all measured retinal loci. GD was calculated as a difference in contrast sensitivity (CS) between no glare and glare conditions using identical stimuli presented at the same eccentricities. GD was defined as [(CSNo Glare−CSGlare)/CSNo Glare] in order to isolate the glare attenuation effects of MPOD by controlling for CS variability among the subject sample. Correlations of the discrete and integrated MPOD with GD were compared.
ResultsThe cHFP identified reliable MPOD spatial distribution maps demonstrating a 1st-order exponential decay as a function of increasing eccentricity. There was a significant negative correlation between both measures of foveal MPOD and GD using 6cycles per degree (cpd) and 9cpd stimuli. Significant correlations were found between corresponding parafoveal MPOD measures and GD at 2 and 4° of eccentricity using 9cpd stimuli with greater MPOD associated with less glare disability.
ConclusionsThese results are consistent with the glare attenuation effects of MP at higher spatial frequencies and support the hypothesis that discrete and integrated measures of MPOD have similar correlations with glare attenuation effects across the macula. Additionally, peak foveal MPOD appears to influence GD across the macula.
Este estudio analizó el perfil espacial de la relación entre la densidad óptica del pigmento macular (MPOD) y las mediciones de deslumbramiento (glare) discapacitante (GD) a lo largo de la mácula.
MétodosSe utilizó un nuevo dispositivo para medir la MPOD a lo largo de los 16 grados centrales de la retina, distribuidos en 4 radios, utilizando un fotómetro intermitente heterocromático personalizado (cHFP) a excentricidades de 0, 2, 4, 6 y 8 grados. Se midió la MPOD como valores discretos e integrados, en todas las localizaciones retinianas medidas. Se calculó el GD como diferencia de sensibilidad al contraste (CS) entre las condiciones sin y con deslumbramiento, utilizando estímulos iguales, presentados en las mismas excentricidades. El GD se definió como [(CSNo Glare - CSGlare)/CSNo Glare] a fin de aislar los efectos de la MPOD en la atenuación del deslumbramiento mediante el control de la variabilidad de CS en la muestra de sujetos. Se compararon las mediciones de la MPOD discreta e integrada con GD.
ResultadosEl cHFP identificó unos mapas de distribución espacial fiables de la MPOD, que demostraron un deterioro exponencial de 1er orden, como función del incremento de la excentricidad. Se produjo una importante correlación negativa entre las mediciones de la MPOD foveal y el GD, utilizando estímulos de 6 ciclos por grado (cpd) y 9cpd. Se hallaron correlaciones significativas entre las mediciones correspondientes de la MPOD parafoveal y el GD a 2 y 4 grados de excentricidad, utilizando estímulos de 9cpd, siendo menor la discapacidad por deslumbramiento a mayor MPOD.
ConclusionesEstos resultados son consistentes con los efectos de del pigmento macular en la atenuación del deslumbramiento discapacitante para frecuencias espaciales altas, apoyando la hipótesis relativa a que las mediciones discretas e integradas de la MPOD tienen correlaciones similares con los efectos de atenuación del deslumbramiento a través de la mácula. Además, el pico foveal de MOPD parece influir en el GD macular.
Previous research has identified lutein (L) and zeaxanthin (Z) as two primary constituents of human macular pigment (MP).1–3 Within the retina, MP can be found as a membrane-bound compound primarily within the photoreceptor axons (Henle fiber layer in macular region) and the inner plexiform layer4 and, to a lesser extent, at the level of the retinal pigmented epithelium (RPE)5 and photoreceptor outer segments.6
Macular pigment optical density (MPOD) is highest in the central retina peaking at the foveal center and falling to optically negligible levels outside of 7° of eccentricity from the fovea.7L is found in greater levels within the peripheral retina as the ratio of L:Z changes from approximately 1:2.4 at the fovea to 1.8:1 in the parafovea, and to 2.7:1 in the peripheral retina.8,9 Bone found that MP spatial distribution is highly correlated with cone photoreceptor distribution possibly indicating a role in cone function.10 Nolan et al. proposed that foveal anatomical structure directly influences L and Z distribution.11 They found that integrated foveal levels of MP were significantly correlated with foveal width measured as both foveal crest to foveal crest (r=0.32, p<0.05) and absence of nerve fiber layer (r=0.41, p<0.01).
A majority of previous studies have focused on the relationship of central visual function with foveal MPOD measurement.12–14 To date, no studies have explored the role of parafoveal MPOD and its relation to visual performance. It is also important for understanding the role of parafoveal MPOD to know the relationship between visual performance and discrete versus integrated measures of MPOD. Robson et al. and Trieschmann et al. reported that foveal measures of MPOD showed low correlations with integrated MPOD measured across the spatial distribution.15,16 Wenzel et al. also hypothesized that an integrated measure of MPOD is potentially a better measure than a measure at a single eccentricity in terms of glare discomfort.17
The aim of this study is to determine the role of both discrete and integrated parafoveal measures of MPOD on underlying glare disability (GD) across the macula. Correlations of discrete and integrated MPOD values with GD corresponding to the same retinal loci for three different spatial frequencies (3, 6 and 9cpd) were calculated. For all three spatial frequencies, the relationship between MPOD and GD was evaluated using both foveal MPOD correlations with retinal eccentricities of GD at 0°, 2°, 4° and 6° and correlations of corresponding eccentricities of MPOD and GD (i.e. stimulus center at 2° MPOD with 2° GD, stimulus center at 4° MPOD with 4° GD and stimulus center at 6° MPOD with 6° GD).
MethodsAn a priori power analysis using an 80% power estimate and a Cohen's effect size of 0.5 determined a study sample size of 33 subjects assuming statistical significance at a p≤0.05.18 Study inclusion criteria required no evidence of ocular pathology and best corrected visual acuity of 20/25 in the right eye and age less than 35 in order to avoid the interference of any presbyopic effect. Volunteer subjects were recruited from students enrolled at the University of Missouri – St. Louis (UMSL). All subjects were familiarized with the devices and completed at least 60min of testing practice before data collection began. The study sample included 11 males and 22 females with a mean age of 24.2 years (standard deviation=2.7 years). Subjects performed all testing over a 12-week period. All procedures were approved by the UMSL Institutional Review Board and followed the tenets of the Declaration of Helsinki.
This study utilized a novel device based on the Wooten et al. heterochromatic flicker photometer (HFP).19 However, our device incorporated customized heterochromatic flicker photometry (cHFP) using each subject's individual foveal CFF to model the spatial distribution of MP across the central 16° of the retina. The device was designed to measure MPOD along four radii (0°, 90°, 180°, 270°) with a stimulus centered at 0°, 2°, 4°, 6°, and 8° eccentricities. This radial pattern was used to generate a spatial profile of an individual subject's MPOD that was then compared to a spatial distribution of contrast sensitivity and glare sensitivity at the corresponding degrees of eccentricity.
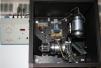
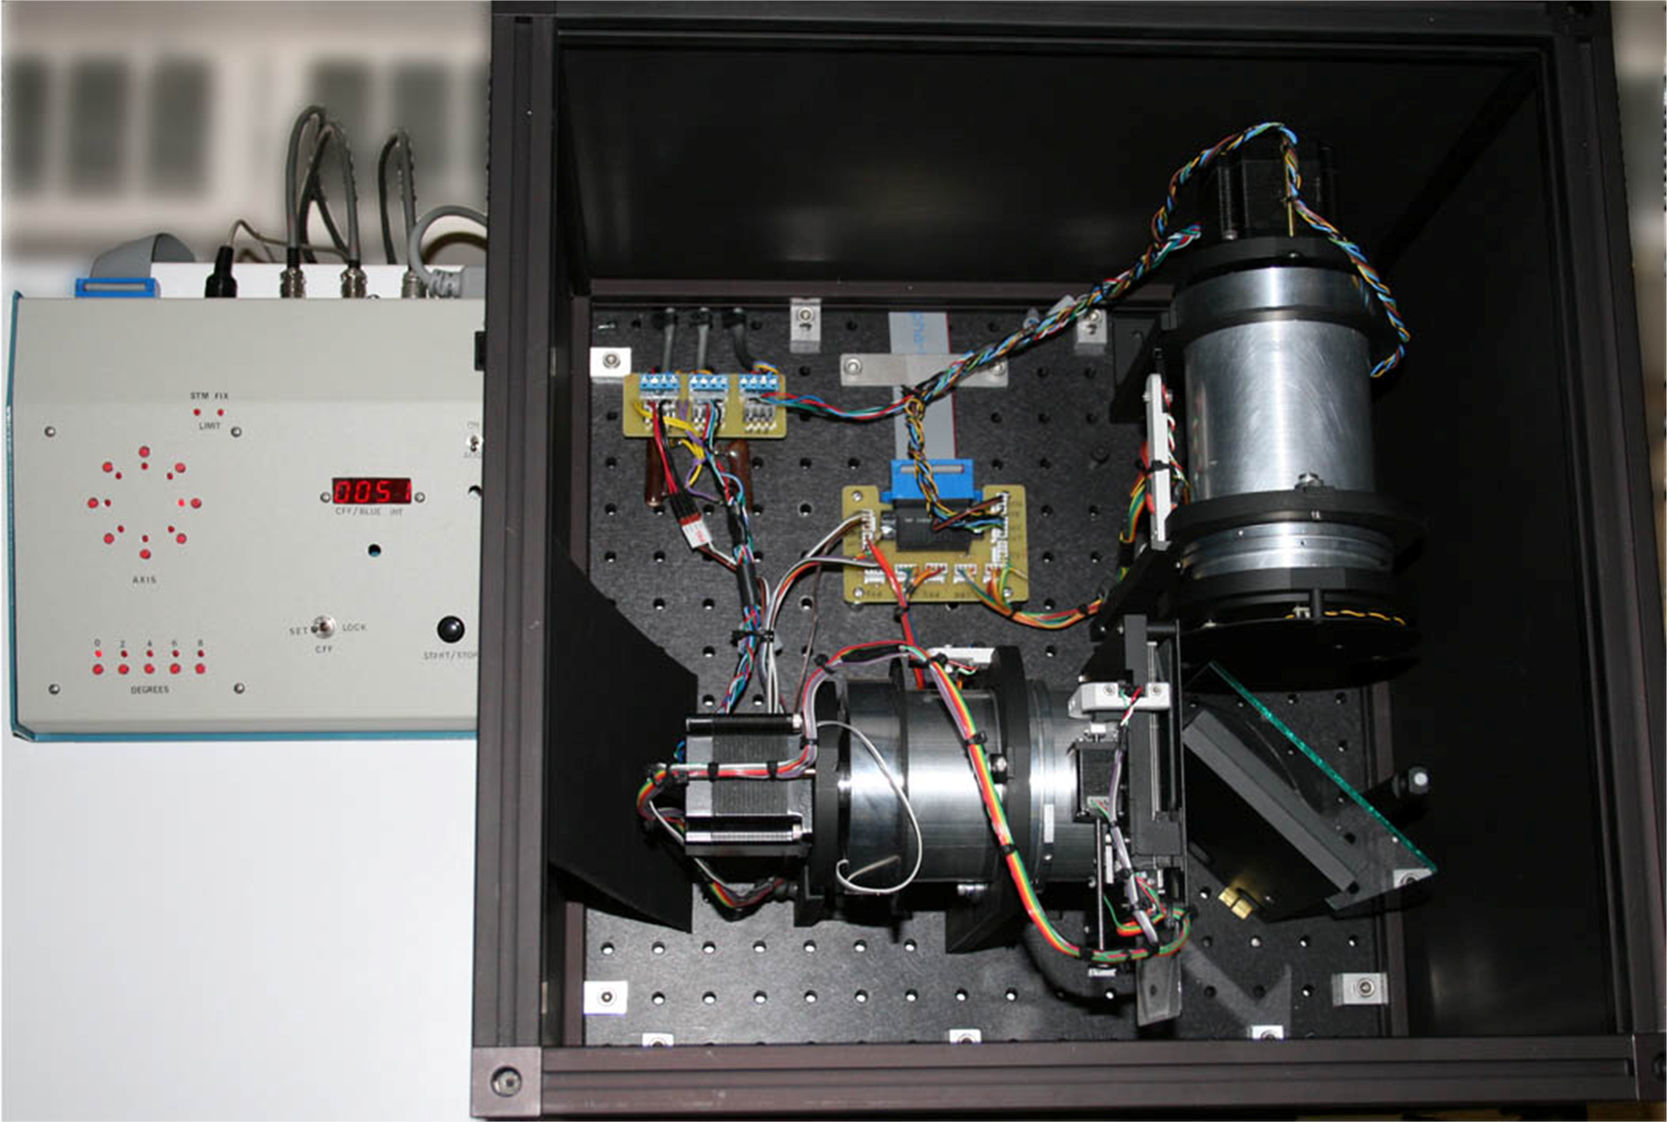
The cHFP device is a free-view device using a chin rest with a fixed 40cm testing distance from a 10° background field generated by a LED (472nm peak) and a holographic diffuser (85% transmission with 20° viewing angle) measuring 2.75cd/m2. A 1° stimulus is superimposed on the background field using a beamsplitter and a triad arrangement consisting of two 460nm LEDs and one 564nm LED with half-bandwidths of 10nm. The measured peak output of the superimposed stimulus was 5.20cd/m2 for the 564nm LED and 21.2cd/m2 for the 460nm LEDs. The LED triad utilized a pulse-width modulation (PWM) frequency control. PWM was chosen to regulate frequency which allows use of continuous current control of the LED input and strict control of spectral output. The triad array created a peak wavelength of 460nm and 564nm LEDs to flicker in counterphase to one another and an inverse yoked luminance control set at 0.10cd/m2 for each detent of the subject control knob. A 5arcmin fixation dot was printed on a transparent thin film and controlled by a step-motor which allowed precise positioning at eccentricities relative to the center of the 1° stimulus target. An optical schematic of the device is provided below (Fig. 1) accompanied by an image of the device (Fig. 2).
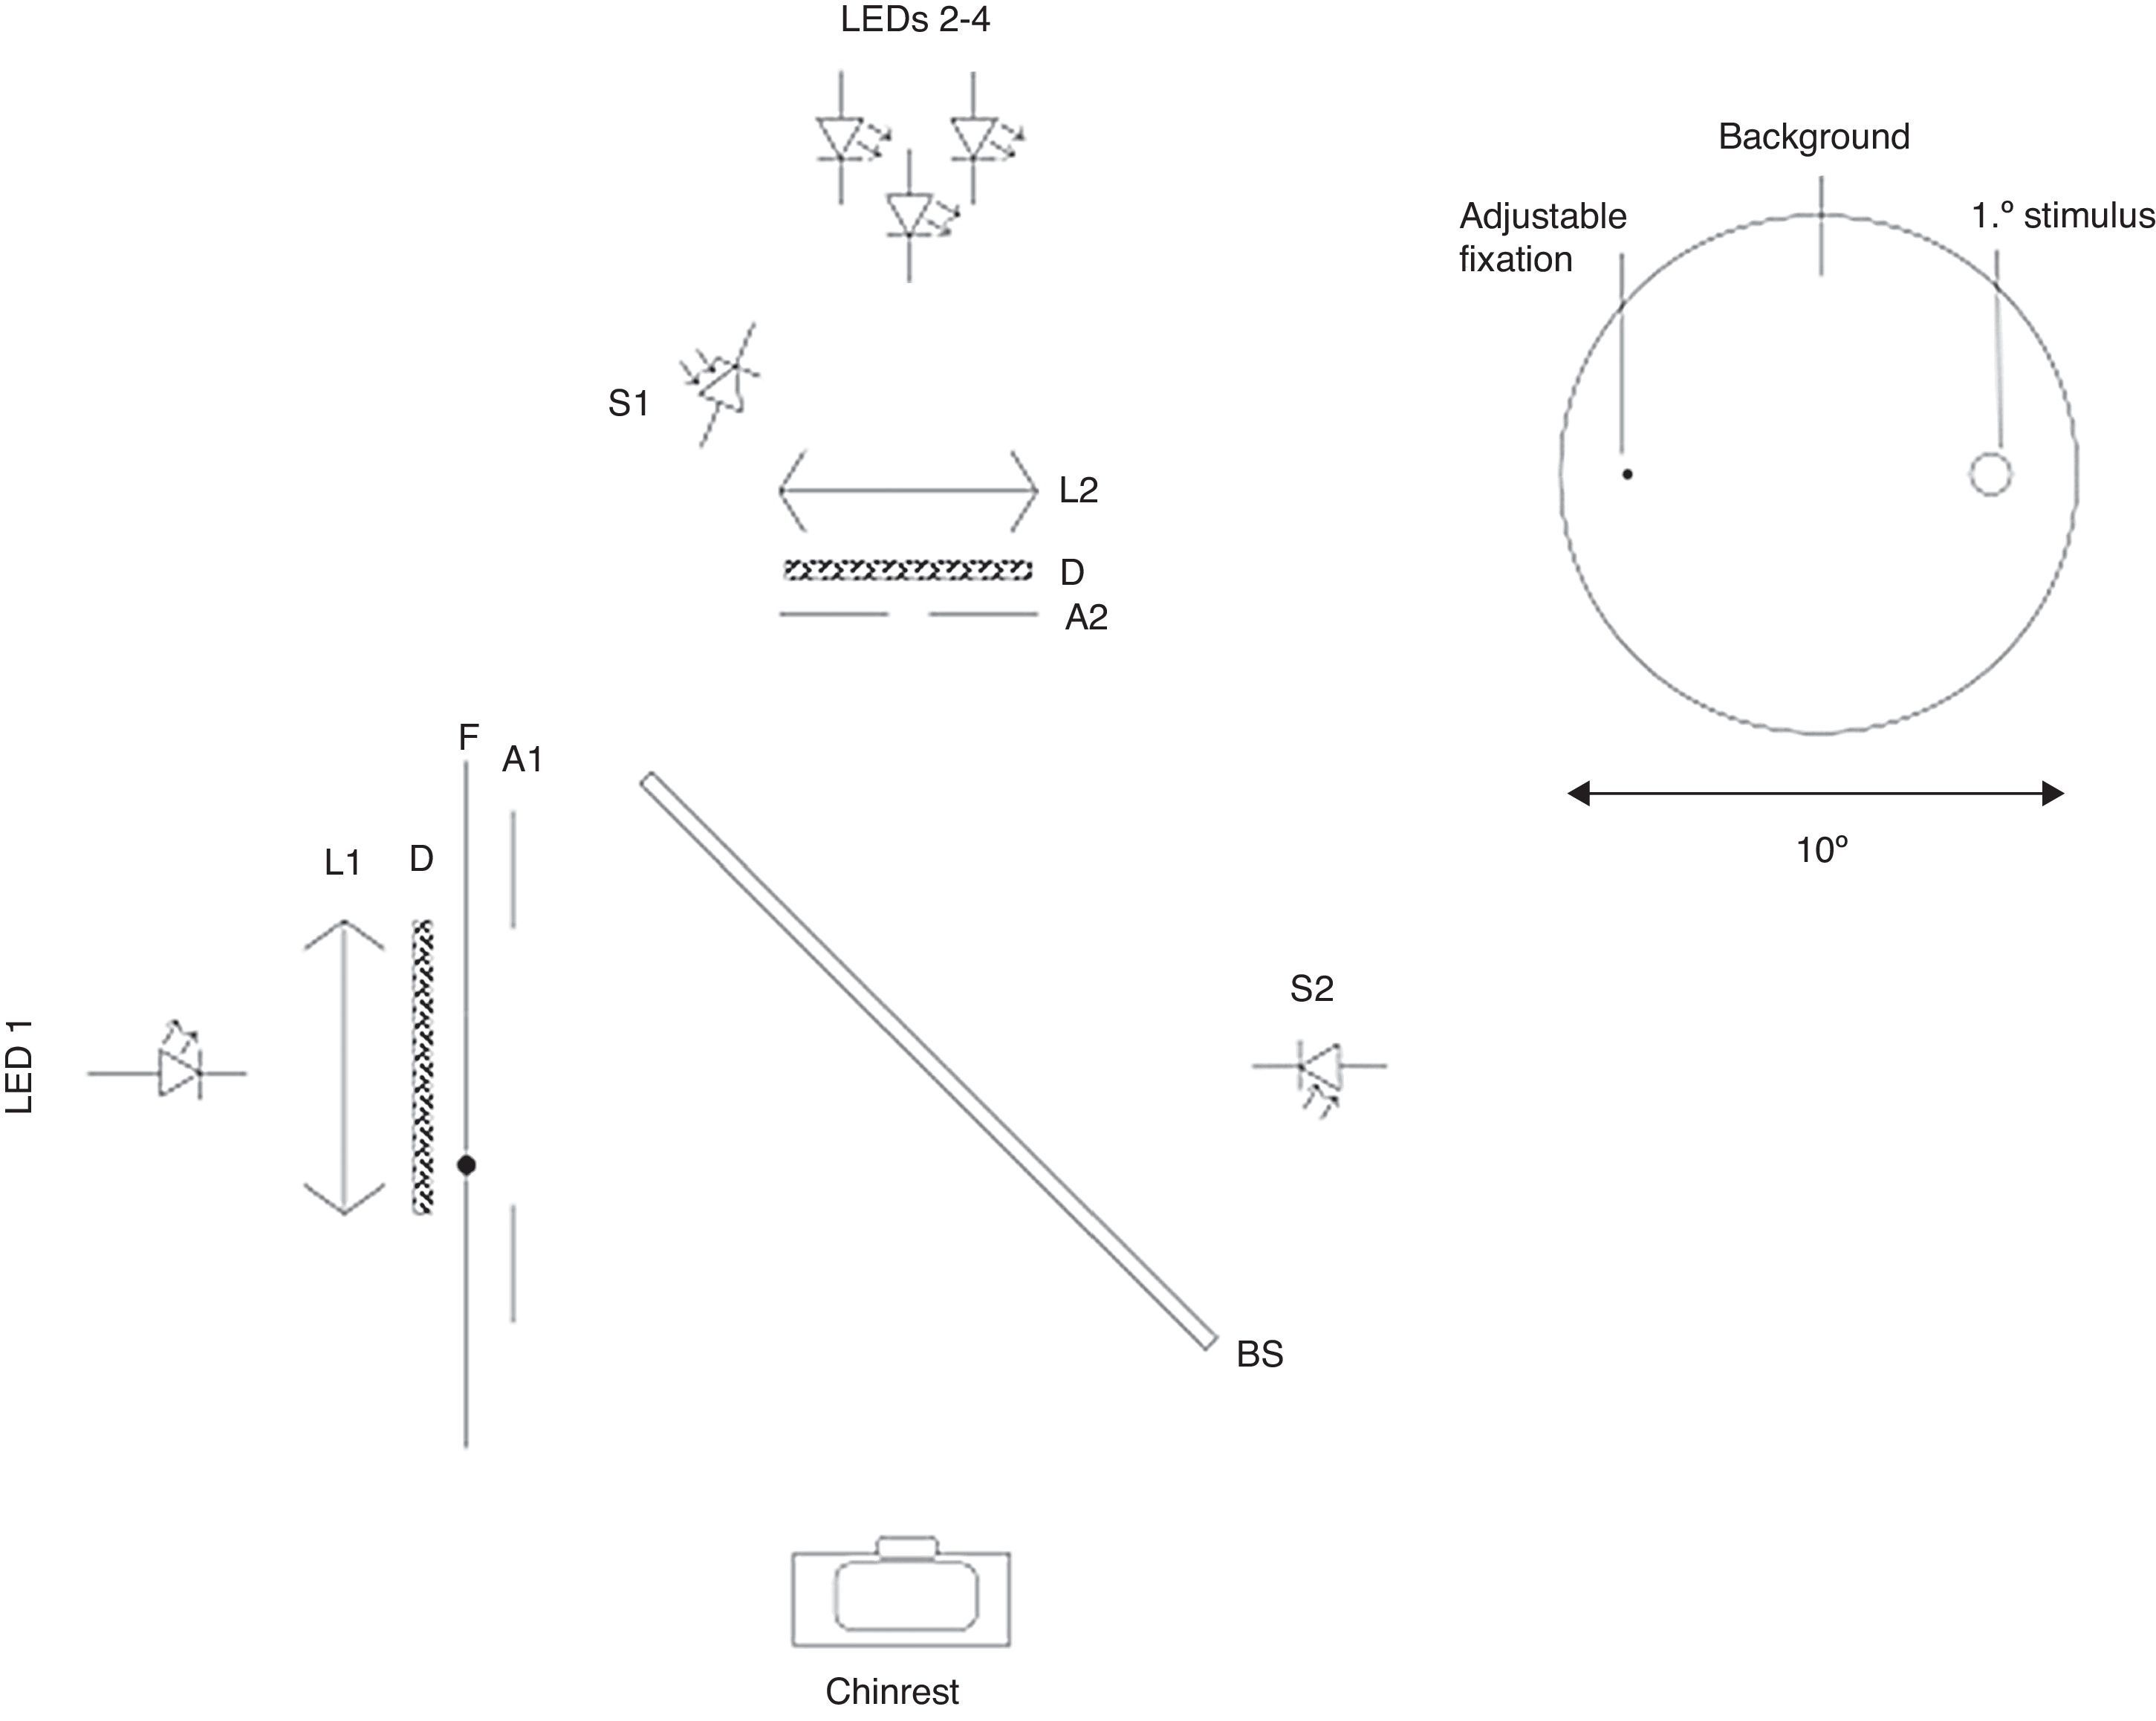
Left: optical schematic for MPOD measurement device consisting of LED 1-Background (472nm peak) LED; LEDs 2–4 Stimulus triad consisting of two (peak 460nm) and one (peak 564nm) LEDs; L1 and L2 collimating lenses; D Holographic diffuser; BS Beam splitter; A1 10° aperture; A2 1° aperture; S1 sensor for stimulus; S2 sensor for background. Right: schematic view to patient.
The luminance value of the blue light (460nm) was used to calculate MPOD using a log function of luminance at the measured eccentricity (stimulus center at 0°, 2°, 4° and 6° in this study) divided by the luminance of stimulus center at the 8° reference eccentricity outside the zone of primary MP deposition (MPOD=log [Lfov/Lreference]). For a full review of the cHFP method, see Bone et al.20
In order to optimize the accuracy of the MPOD measurements, each subject was required to identify their central CFF that determined all stimulus flicker rates at each retinal eccentricity. Subjects were adapted in a dark room for 5min prior to beginning the testing with a patch over their left eye and chin in a fixed chin rest. The CFF was determined by isolating the 564nm LED as the flickering stimulus superimposed on the 472nm background. Five consecutive measures were taken and all values were verified to be within 1Hz of one another or the testing was stopped, the subject was allowed to rest, and the CFF procedure was started from the beginning. A mean value of the five repeated CFF measures were used to calculate the customized central flicker rate for each subject. Consistent with Snodderly et al.21, Hammond et al.22 and Stringham et al.23 the subject's central CFF was applied to an algorithm lookup table within the device programming to determine the fixed stimulus flicker rate centered at 0°, 2°, 4°, 6° and 8° eccentricities.
Each session included five 0° and 8° eccentricity measurement values. The first session assessed the 2° eccentricity, the second session assessed the 4° eccentricity, and the third session included the 6° eccentricity. Retinal eccentricities were assessed using the same procedure as the foveal measurement with the exception of the point of fixation. The examiner set the fixation dot to the corresponding eccentricity relative to the stimulus center. Each subject began with a different meridian to control for order effects. Sessions were designed to last no longer that 45min with most subjects finishing in 30min as their proficiency with the cHFP procedure improved.
MPOD mean values for each retinal locus (stimulus center at 0°, 2°, 4° and 6°) were fit to an exponential decay function for a stimulus centered at each foveal eccentricity using OriginPro9 (Northhampton, MA) software. For the resulting distribution, MPOD values at each retinal locus were determined by two separate methods: (1) MPOD discrete value and (2) MPOD integrated across 1°. Each distribution would have 4 discrete MPOD values and 4 integrated MPOD values from −0.5° to 0.5°, 1.5° to 2.5°, 3.5° to 4.5° and 5.5° to 6.5°.
Glare disability measurementsGD stimuli were generated with the Psykinematics program (Kybervision, Montreal, Canada) to create a vertical sinusoidal spatial grating pattern. Grating stimuli were presented on a 19″-CRT monitor (EIZO, Inc., CA) using gamma correction of existing non-linearity. Display calibration of the CRT monitor was assessed using a Spyder 3 (Datacolor, Lawrenceville, NJ) device recognized and incorporated into the Psykinematics program. The stimuli were presented on a background with a mean luminance of 20cd/m2. The vertical sinusoidal spatial grating pattern was displayed with a 200ms duration in order to control for fixation loss during stimulus presentation. The stimulus subtended a visual angle of 1° with a spatial Gaussian envelope and a sigma value of 0.3°. A method of limits with an adaptive staircase was utilized to determine contrast sensitivity (CS) values at 0°, 2°, 4° and 6° eccentricity. A mean value was calculated from 6 reversals and recorded as a CS estimation. CS values were recorded for three spatial frequencies (3/6/9cpd) at each eccentric point along the principal meridians. GD was determined as the difference in contrast sensitivity between glare conditions and no glare conditions [(CSNoGlare−CSGlare)/CSNoGlare] at each retinal locus.
The glare device utilized in this study was built based on a previous design described in a Stringham et al. study.14 The glare apparatus consisted of two 5° glare sources produced by two achromatic LEDs (Luxeon model LXHL LW6C, Luxeon Corp., Randoph, VT) located in 1″ diameter optical tubes. Each LED was attached to the base of a 6″ tube in conjunction with 3 other optical system elements: (1) a 10° holographic diffuser (used to make the glare image uniform, (2) an adjustable circular iris (used to define the glare circle size of 5°), and (3) a convex lens (used to focus the glare source at the distance of the CRT monitor). The two tubes were positioned below the subject's line of sight, directed vertically and reflected from a beam splitter oriented at 45° into the subject's line of sight. Based on the optical system, each glare source created a luminance of 1500cd/m2 with a color temperature of 6500K. Measurement of the glare sources was taken with a spectrophotometer (model 650; Photo Research Inc., Chatsworth, CA). The two glare sources were aligned horizontally for the vertical meridian and vertically for the horizontal meridian and each source was centered 5° from the midpoint of the 1° sinusoidal grating pattern. Infra-red camera focus and subject feedback were employed through a precise alignment via transparency overlay ensuring that the glare circles were accurately positioned within the correct 0.5° distance from the midpoint of the grating pattern. Subjects were presented the same stimuli as used during the contrast sensitivity function testing described above. Subjects viewed the grating targets through a beam splitter that reflected the superimposed glare sources on the CRT background. Each trial required approximately 45–60s to complete with a mandatory 60s rest cycle between trials.
Subjects were adapted at mesopic (<3cd/m2) conditions for 5min preceding each session. Five (5) measurements were conducted in total in order to maximize validity and repeatability. Single sessions included: (1) foveal threshold determinations for all three spatial frequencies and (2) All eccentricity measurements at each meridian (0°, 90°, 180°, 270°) for each spatial frequency. Each session was performed under no glare and glare conditions. Initial starting spatial frequency was randomized to control for order effects. Optional breaks were given at subjects request and mandatory breaks of 5min were given at the completion of each eccentricity.
Correlations of discrete MPOD values along with the integrated values across the 1° stimulus for each distribution with GD of the 1° grating target corresponding to the same retinal loci at three separate spatial frequencies (3cpd, 6cpd and 9cpd) were calculated. At all three spatial frequencies, MPOD correlations with GD were evaluated using foveal MPOD measurements and corresponding eccentricities of MPOD and GD were also performed (i.e. stimulus center at 2° MPOD with 2° GD, stimulus center at 4° MPOD with 4° GD and stimulus center at 6° MPOD with 6° GD). Due to the a priori nature of the experimental design, Bonferroni corrections were not utilized.
ResultsMPOD measurements were highly reliable. Standard error of the mean MPOD measured for 0° eccentricity was less than 0.01 log unit, 2° eccentricity was 0.01, 4° eccentricity was 0.01 and 6° eccentricity was 0.02 log unit. Correlations of MPOD at each eccentricity were performed among the superior, inferior, temporal, and nasal locations. Correlation values among the four measured meridians at 2° eccentricity range between 0.955 and 0.968 providing support of a high level of symmetry among measured meridians when MPOD is fit to a 1st order exponential function at each of the measured meridians. Correlations among the four measured meridians at 4° eccentricity range between 0.928 and 0.947 and correlations among the four measured meridians at 6° eccentricity range between 0.875 and 0.929 supporting the symmetry of MPOD spatial distribution among the four measured meridians along with increased variability in MPOD assessment with increasing eccentricity.
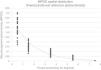
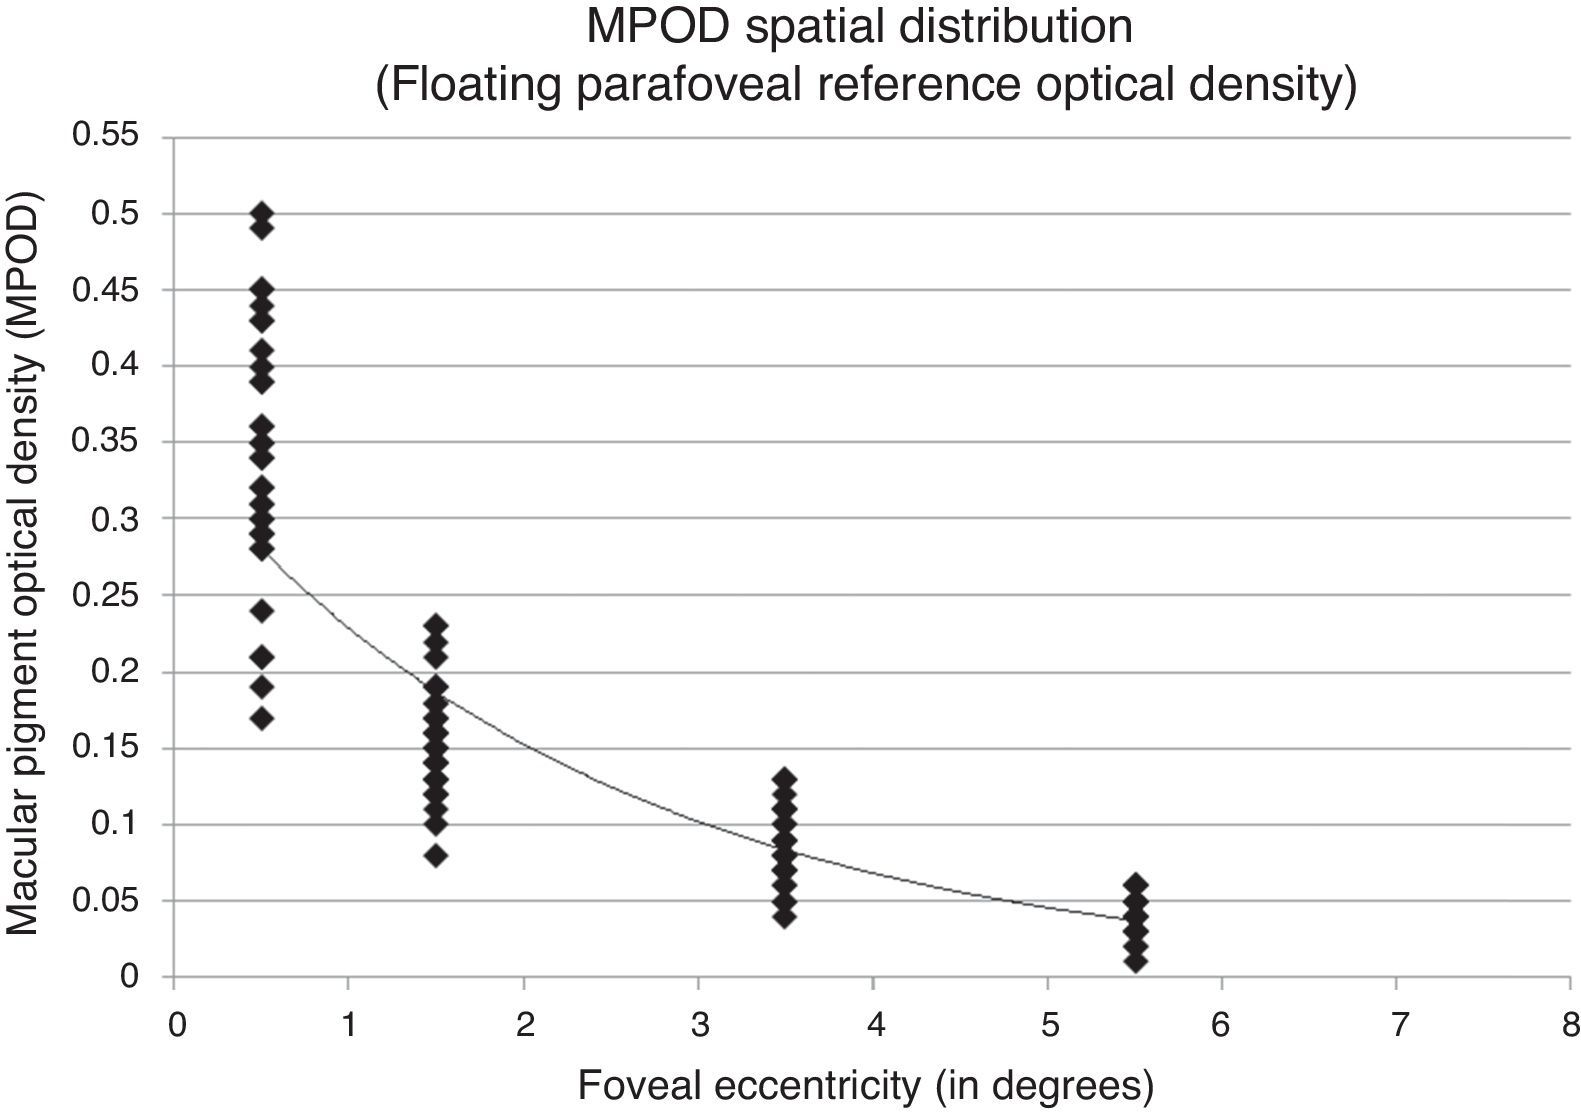
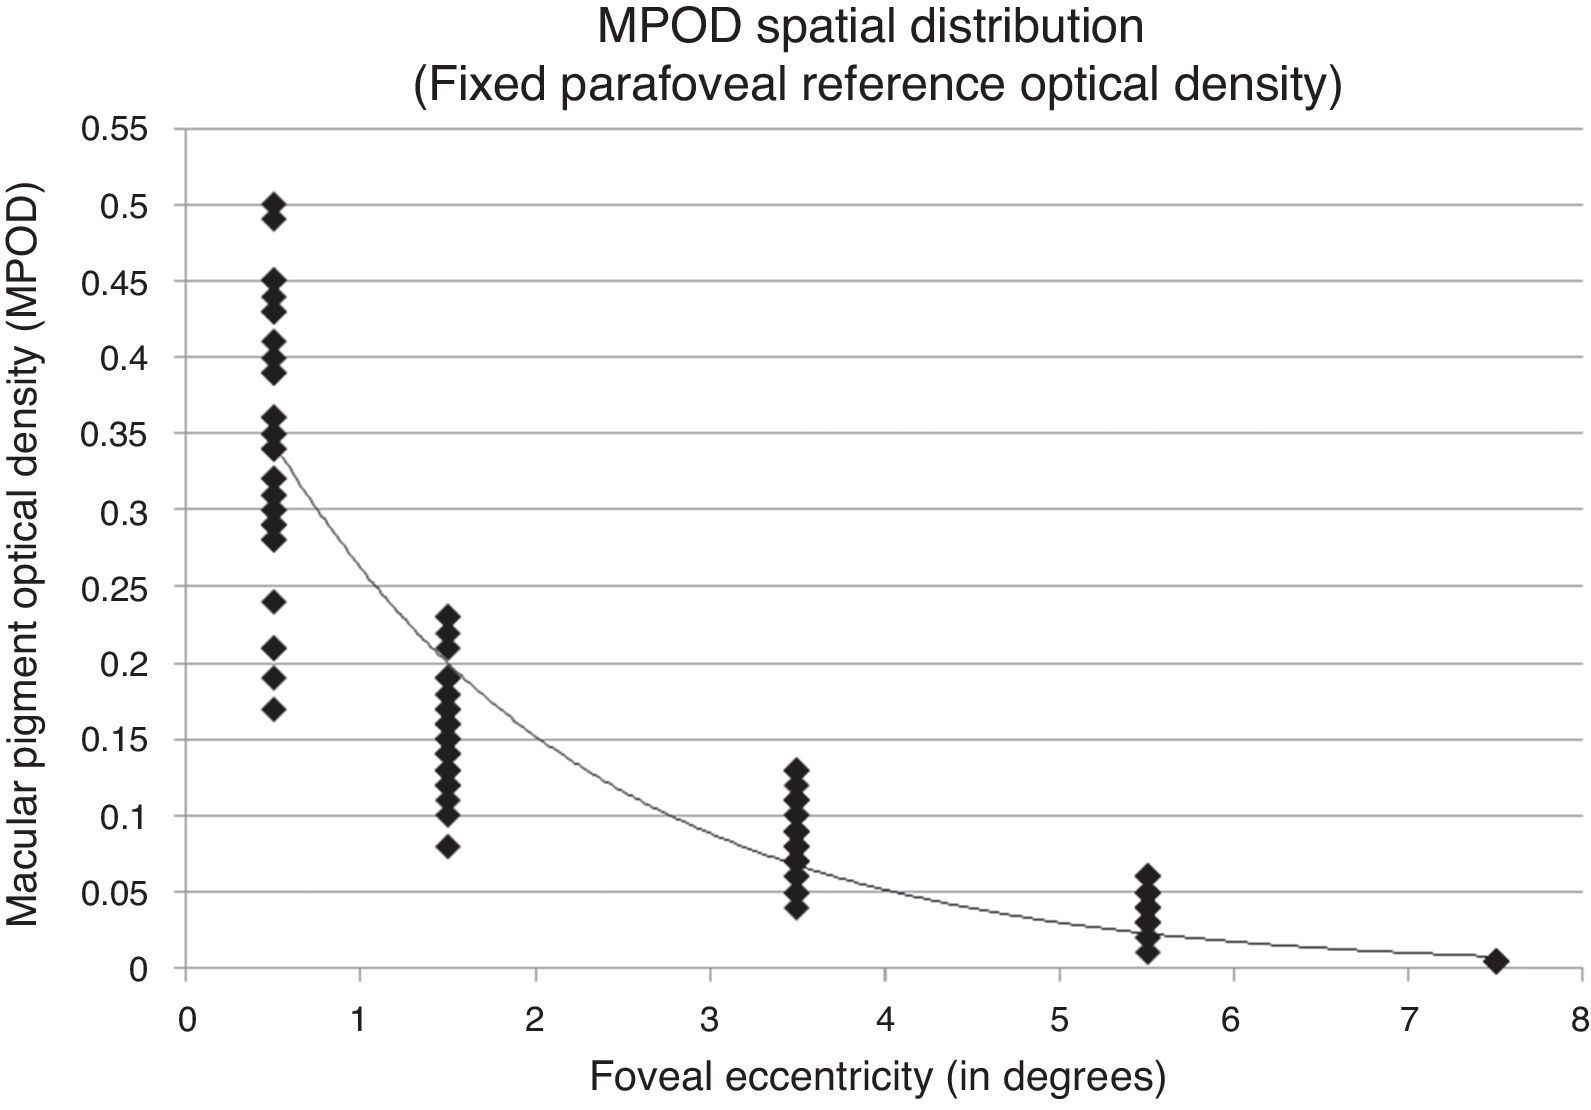
Fitting the exponential decay function to a retinal point of fixed, negligible MPOD may distort the function and corresponding covariance measures. To evaluate this, the sample MPOD spatial distribution was fit using only the measured retinal eccentricities allowing the exponential function to float and fit assuming a fixed, negligible MPOD. MPOD spatial distribution of the subject sample fit allowing the function to float showed an r2=0.853 with a y-intercept of 0.343 corresponding to peak foveal density (Fig. 2). The same MPOD values fit assuming a fixed, negligible MPOD showed an r2=0.912 with a y-intercept of 0.451 corresponding to peak foveal density (Figs. 3 and 4).
Non-significant correlations between both horizontal and vertical meridian CS with MPOD allowed the use of a mean GD value incorporating all four meridians. GD is a component of the SW attenuation property exhibited by MP. This attenuation should be exhibited in the same symmetric pattern as MPOD spatial distribution indicated by the highly correlated MPOD values among the four meridians at each eccentricity.
At 3cpd, GD correlations at all eccentricities with foveal MPOD measured as a discrete point and as a 1° integrated area were non-significant. GD correlations with both measures of MPOD at corresponding eccentricities were also non-significant.
At 6cpd, foveal GD correlations with foveal MPOD measured as a discrete point and as a 1° integrated area were significant at 0° and 2° and non-significant at 4° and 6°. GD correlations with both discrete and 1° integrated measures of MPOD at corresponding eccentricities were non-significant.
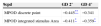
At 9cpd, correlations between discrete and integrated foveal MPOD measurements with GD at 0°, 2° and 4° eccentricity were significant. However, 6° GD correlations with discrete and integrated measures of foveal MPOD were non-significant. Additionally, correlations between GD with both discrete and 1° integrated corresponding MPOD measurements at 2° and 4° were significant (Table 1). Six-degree GD correlations with discrete and integrated measures of MPOD at 6° eccentricity were non-significant.
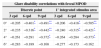
Table 2 provides a summary of correlations between foveal MPOD measured as a discrete point and as a 1° integrated area with GD at all measured retinal eccentricities (stimulus centered at 0°, 2°, 4° and 6°) and at all measured spatial frequencies (3, 6, 9cpd).
Pearson correlation coefficients for glare disability and foveal MPOD measured as a discrete point and a 1° integrated stimulus area centered 0°, 2°, 4° and 6° of eccentricity for 3, 6 and 9cpd grating targets.
| Glare disability correlations with foveal MPOD | ||||||
|---|---|---|---|---|---|---|
| Discrete point | 1° integrated stimulus area | |||||
| 3cpd | 6cpd | 9cpd | 3cpd | 6cpd | 9cpd | |
| 0° | −0.205 | −0.401* | −0.491** | −0.206 | −0.418* | −0.505** |
| 2° | −0.235 | −0.316* | −0.442** | −0.240 | −0.315* | −0.421* |
| 4° | −0.261 | −0.291 | −0.372* | −0.264 | −0.284 | −0.373* |
| 6° | −0.283 | −0.189 | −0.168 | −0.277 | −0.173 | −0.162 |
The mean spatial distribution of MP in this 33 subject sample as measured by cHFP was best fit by an exponential decay function originating at the foveal center consistent with previous psychophysical studies.24–26 The overall distribution measure of MPOD showed an inverse association with retinal eccentricity. The trend of decreasing MPOD as a function of eccentricity has been documented by both ex vivo studies1,2 and in vivo studies24,26 of the MP spatial distribution. The results of this experiment support and confirm the previously identified first order exponential decay curve exhibited by MP as a function of retinal eccentricity. Several studies have described a secondary peak or ring-like structure of MPOD that is found between approximately 0.50° and 0.85° eccentric to fovea in 10–20% of the general population.27,28 The cHFP device designed and built for this project focused on the overall spatial distribution from 0° to 8° eccentricity measured with a 1° stimulus at 2° intervals. Due to this device design, measurement and verification of predicted ring-like MPOD findings is not within the scope of the current project but design modifications to the existing cHFP device would allow such a measurement.
Spatial distribution results from this experiment show differing covariance values when MPOD is measured allowing the exponential function to float (r2=0.853) versus assuming fixed, negligible parafoveal reference point (r2=0.912). Although the study sample distribution was best fit by a 1st order exponential decay function across the macula, large individual differences in distribution among the sample subjects were observed.
Relationship between MPOD and glare disabilityResults from this study found when underlying CS was controlled for by calculating GD as (CSNoGlare−CSGlare)/CSNoGlare results supported a significant inverse relationship between foveal MPOD and GD out to 4° eccentricity using 9cpd targets. Results also demonstrated similar significant correlations when MPOD measurements assumed either an integrated measure or a discrete measure. These similarities may be due to relatively small differences in corresponding integrated and discrete MPOD measures within an individual subject. Our findings support the hypothesis that increased MPOD is associated with decreased RGD at higher spatial frequencies. This inverse association is most apparent near the foveal center where MPOD is highest. Similar to Stringham et al.29 and Hammond et al.30, our results identified a significant correlation between both foveal and parafoveal MPOD and central GD. However, several important differences can be found in our design. First, our design used stimuli with multiple spatial frequencies rather than a fixed 4cpd stimuli. Secondly, our design used direct measurements of CS under glare conditions opposed to a fixed CS with a variable glare intensity. Most importantly, the results from this study were the first to show a significant correlation between corresponding parafoveal MPOD and parafoval GD.
The hypothesized role of MP influences on GD has been attributed to SW attenuation effects of chromatic aberration and intraocular scatter leading to retinal image resolution increases through reduced lateral inhibition and enhanced receptive field responses.12 A lack of significance between MPOD and CS in our study was expected due to the spectral composition and the predominance of LW light contained within the stimuli and background. Spectral analysis of the CRT display used in stimuli generation was performed using the same spectrophotometer (model 650; Photo Research Inc., Chatsworth, CA) used in calibration of the glare sources and the cHFP stimuli. Spectrophotometer results for the CRT used showed a luminance output of 20cd/m2 with a peak wavelength of 624nm. The absorption bandwidth of MP extends from approximately 410nm to 520nm with a peak absorbance of 460nm. The peak spectral output of the stimuli and background produced by the CRT display used in the study is far outside the absorption spectrum of MP. The CRT background and grating stimuli would share the same wavelength composition therefore the influence of MPOD on CS would be expected to be minimal.
A number of authors have demonstrated the greatest levels of visual impairment secondary to glare occur within the low spatial frequency spectrum where CS is at its peak.31–33 MPOD influences on glare attenuation may be more pronounced at higher spatial frequencies. The grating pattern stimulus for each spatial frequency (3, 6 and 9cpd) was a fixed 1° diameter creating more visible edges for 9cpd targets relative to 3cpd targets. To isolate the glare attenuation effects of MPOD free from spatial frequency influences, further investigation using scaled stimuli with equal numbers of visible cycles/degree within the 1° stimulus is warranted.
It is also important to discern is whether the similarities between discrete and integrated measures of MPOD is real or a limitation of the measurement resolution of a 1° stimulus. Further investigation using an objective measurement such as autofluorescence or fundus reflectometry may allow more precise measures of MPOD within a 1° diameter. Results also demonstrated significant relationships between MPOD and glare attenuation at 0°, 2° and 4° of eccentricity but not at 6° where MPOD is at very low levels. Further study is required to determine if this lack of significance with GD indicates a minimum MPOD necessary to confer glare attenuation effects. In other words, what minimum foveal MPOD level must be present to decrease GD.
Consistent with previous studies, we found that higher levels of MPOD were significantly correlated with better performance on a GD task at higher spatial frequencies (9cpd versus 3cpd) out to 4° from the center of the fovea. Correlations were similar using integrated and single point measurements of MPOD across the stimulus supporting the hypothesis both measures of MPOD are equivalent when assessing GD. A number of current studies support the hypothesis of increased MPOD leading to reduced GD but still to be understood is a quantitative determination of a minimum foveal MPOD necessary to confer potential GD benefits.
Conflicts of interestThe authors have no conflicts of interest to declare.
The authors want to thank Wayne Garver and Michael Howe for their engineering and mechanical expertise during the development of the UMSL heterochromatic flicker photometer. ZeaVision donated some of the LEDs used in the construction of the cHFP device. Dr. Chris Putnam was supported by the USAF AFIT program.


