


There is robust evidence that higher macular pigment concentrations help reduce both veiling and discomfort glare in patients with or without ocular disease. We investigated whether there was also a relationship between macular pigment optical density (MPOD) and patient surveys about glare or ocular discomfort.
MethodsWe measured MPOD psychophysically in 23 healthy subjects and administered the National Eye Institute Visual Functioning Questionnaire (VFQ-25). Responses for each survey question were sorted from low (no limitation) to high (very severe limitation). The median response for each question was determined, and independent t-tests were performed on the mean MPOD values for survey responses above and below the median. We also performed a non-parametric correlation analysis between MPOD and survey responses.
ResultsWhile the median response was “no limitation” for most (22 of 25) survey questions, responses were slightly higher for two questions concerning ocular discomfort and one question related to driving at night. MPOD levels were significantly higher in subjects that reported no discomfort in or around their eyes than in those that reported mild discomfort. There was also a trend toward higher MPOD levels in subjects who reported that pain in or around their eyes never limited their activity as well as in subjects who reported no difficulty driving at night.
ConclusionThese preliminary findings are consistent with the well-established discomfort and glare hypotheses for MPOD. The current findings on subjective ocular discomfort in the absence of glare deserve further study.
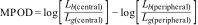
The yellow coloration of the human macula is due to the presence of macular pigment (MP), comprised mainly of the carotenoids lutein and zeaxanthin.1 MP is concentrated in the fovea (or central 1.5mm of the macula) and decreases exponentially to nearly zero concentration with 6–8 degrees of eccentricity.2 There is no universally accepted technique to measure MP levels,3 but psychophysical measures have included spectral sensitivity, minimum motion detection, color matching, and heterochromatic flicker photometry (HFP).4 Commercial devices generally used by clinicians have been available for 15 years and utilize flicker photometry to measure macular pigment optical density (MPOD).3 As MPOD is basically a measure of blue light attenuation by macular pigment, HFP involves detecting flicker when temporally alternating two spatially superimposed blue and green lights on one another. Observers cannot detect brightness differences of different colored lights when they alternate quickly (usually>7Hz).5 However, flicker is just seen when the perceived luminance of the two stimuli is different. Since MP has a peak absorption at around 460nm, it absorbs blue light more than green light. The relative sensitivity at each measured point is then calculated as the ratio of blue to green luminance (L) values that just produce flicker (i.e., Lb/Lg). MPOD is then derived by taking the difference between the logarithm of the relative sensitivities measured centrally (where MP is maximal) and peripherally (where MP is minimal) as shown in Eq. (1):
MPOD values typically range from 0 to 1 in the human macula.6 MPOD levels are linearly related to the amount of macular pigment,7 and higher MPOD levels have also been positively associated with reduced levels of age-related maculopathies and cataracts,8 reduced discomfort from and susceptibility to glare,9 and higher overall levels of health.10
While commercially available MPOD testing can usually be accomplished in less than ten minutes, there would be barriers to its routine administration in healthy patients. The testing is not currently covered by third-party insurance entities for healthy patients without significant risk-factors for maculopathies (such as smoking or family history) or observed macular disease.11 Uncompensated provider time and out-of-pocket patient costs have both been shown to reduce screening compliance in healthy populations.12 While family history is the current best clinical practice in guiding risk assessment,13 many patients are unaware of a positive family history for macular disease. These barriers create a gap in adequately assessing the risk of health and visual consequences from lower MPOD levels.
Clinical surveys add very little time to the examination and can even be completed prior to presenting in the clinic and could provide the necessary information to close that risk-assessment gap. Such surveys are currently used to guide further evaluation of dry eye,14 convergence insufficiency,15 and traumatic brain injury visual symptoms.16
There is no current survey dedicated to the symptoms associated with low MPOD. The 25-question National Eye Institute Visual Functioning Questionnaire (NEI VFQ-25) was developed from responses of those with and without known ocular disease and has been validated, showing lower scores in those with visual impairment than reference groups without known impairments.17 The goal of the current study was to determine if the results of the VFQ-25 – particularly responses to questions concerning visual glare or discomfort – were related to MPOD levels in a single cohort of healthy subjects. We predicted that participants with lower MPOD would report more visual issues than those with higher MPOD levels. If such a relationship were established, abnormal survey results could be used to prompt the efficient investigation of MPOD levels.
MethodsSubjectsTwenty-three subjects (12 females, 11 males) participated, and the ages ranged from 24 to 55 years. Exclusion criteria included visual acuity not correctable to 20/20 in each eye or any clinical history of ocular disease or surgery. The protocol was approved by the Institutional Review Board at the University of the Incarnate Word (UIW Protocol #17-09-003), and informed consent was obtained from each subject. All subjects were naïve to all techniques and measures which were completed in a single session.
Determining MPODWe measured MPOD in a single session with the QuantifEye MPS II (EyePromise, Chesterfield, MO, USA), a commercially available heterochromatic flicker photometer (HFP). Subjects were required to respond when they first detected a flicker sensation when superimposed light of blue and green light were temporally modulated. In this instrument (QuantifEye), the first wavelength is 465nm (blue hue), which is optimally absorbed by the macular pigment (peak absorption ∼460nm),2 and the other is 530nm (green hue), which is minimally absorbed. Flicker detection is measured centrally (i.e., using the macula) and at a more peripheral point (6 degrees temporally from the macula). MPOD is calculated as in Eq. (1) and is expressed here as arbitrary density units (DU).
Visual quality of life measuresWe administered the VFQ-25 (RAND Corporation, Santa Monica, CA), which is the short, 25-item version of the National Eye Institute Visual Functioning Questionnaire (NEI VFQ), a 51-item questionnaire originally devised to yield a self-reported measure of visual functioning in patients with ocular disease.18 The NEI VFQ was shortened into the VFQ-25 based on input from patients with and without ocular disease and is divided into three main parts.17 The first part is general health (items 1 and 2). Part 2 is difficulty with activities (items 3–16; items 15 and 16 have three and two sub-items, respectively), and part 3 is responses to vision problems (items 17–25). The VFQ-25 items can be further broken down into sub-groups or scales, shown in Table 1. It is important to note here that we did not inform subjects that their responses regarding pain, discomfort, driving at night, etc. would be serving as surrogates for subjective MPOD levels, nor did we inform them of previous glare or discomfort hypotheses associated with low MPOD levels. Rather, all subjects self-administered the survey while an investigator was present and available for questions.
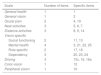
Scales represented by items in the VFQ-25.
| Scale | Number of items | Specific items |
|---|---|---|
| General health | 1 | 1 |
| General vision | 1 | 2 |
| Ocular pain | 2 | 4, 19 |
| Near activities | 3 | 5, 6, 7 |
| Distance activities | 3 | 8, 9, 14 |
| Vision specific | ||
| Social functioning | 2 | 11, 13 |
| Mental health | 4 | 3, 21, 22, 25 |
| Role specific | 2 | 17, 18 |
| Dependency | 3 | 20, 23, 24 |
| Driving | 3 | 15c, 16, 16a |
| Color vision | 1 | 12 |
| Peripheral vision | 1 | 10 |
Our planned analyses were straightforward. We first determined whether our mean MPOD levels by sex, iris color, and race/ethnicity were consistent with previously published trends. We next determined the median response for all 25 survey questions and compared mean MPOD levels between subjects above and below the median response for questions where the median response represented at least some difficulty or limitation. As we expected higher MPOD to correlate with less difficulty, mean MPOD measures were compared using one-tailed (directional) t-tests. Lastly, to better understand the potential associations, we performed a correlation analysis between ranked MPOD and ranked survey responses for those same questions. Since the survey questions were ordinal and not distributed normally, we used non-parametric analyses with Spearman's correlation coefficient (ρ) reported. We used SPSS (IBM, Chicago, IL) for all statistical analyses.
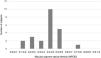
ResultsMPOD resultsMPOD measures were distributed with a mean (±SD) of 0.42±0.14DU and a range of 0.12–0.72DU. These values are consistent with previous observations of macular pigment levels.3 The distribution of MPOD is shown in Fig. 1. Despite the slight platykurtosis (kurtosis=−0.11) and negative skew (−0.33), MPOD was distributed normally (Kolmogorov–Smirnov test, p>0.05).
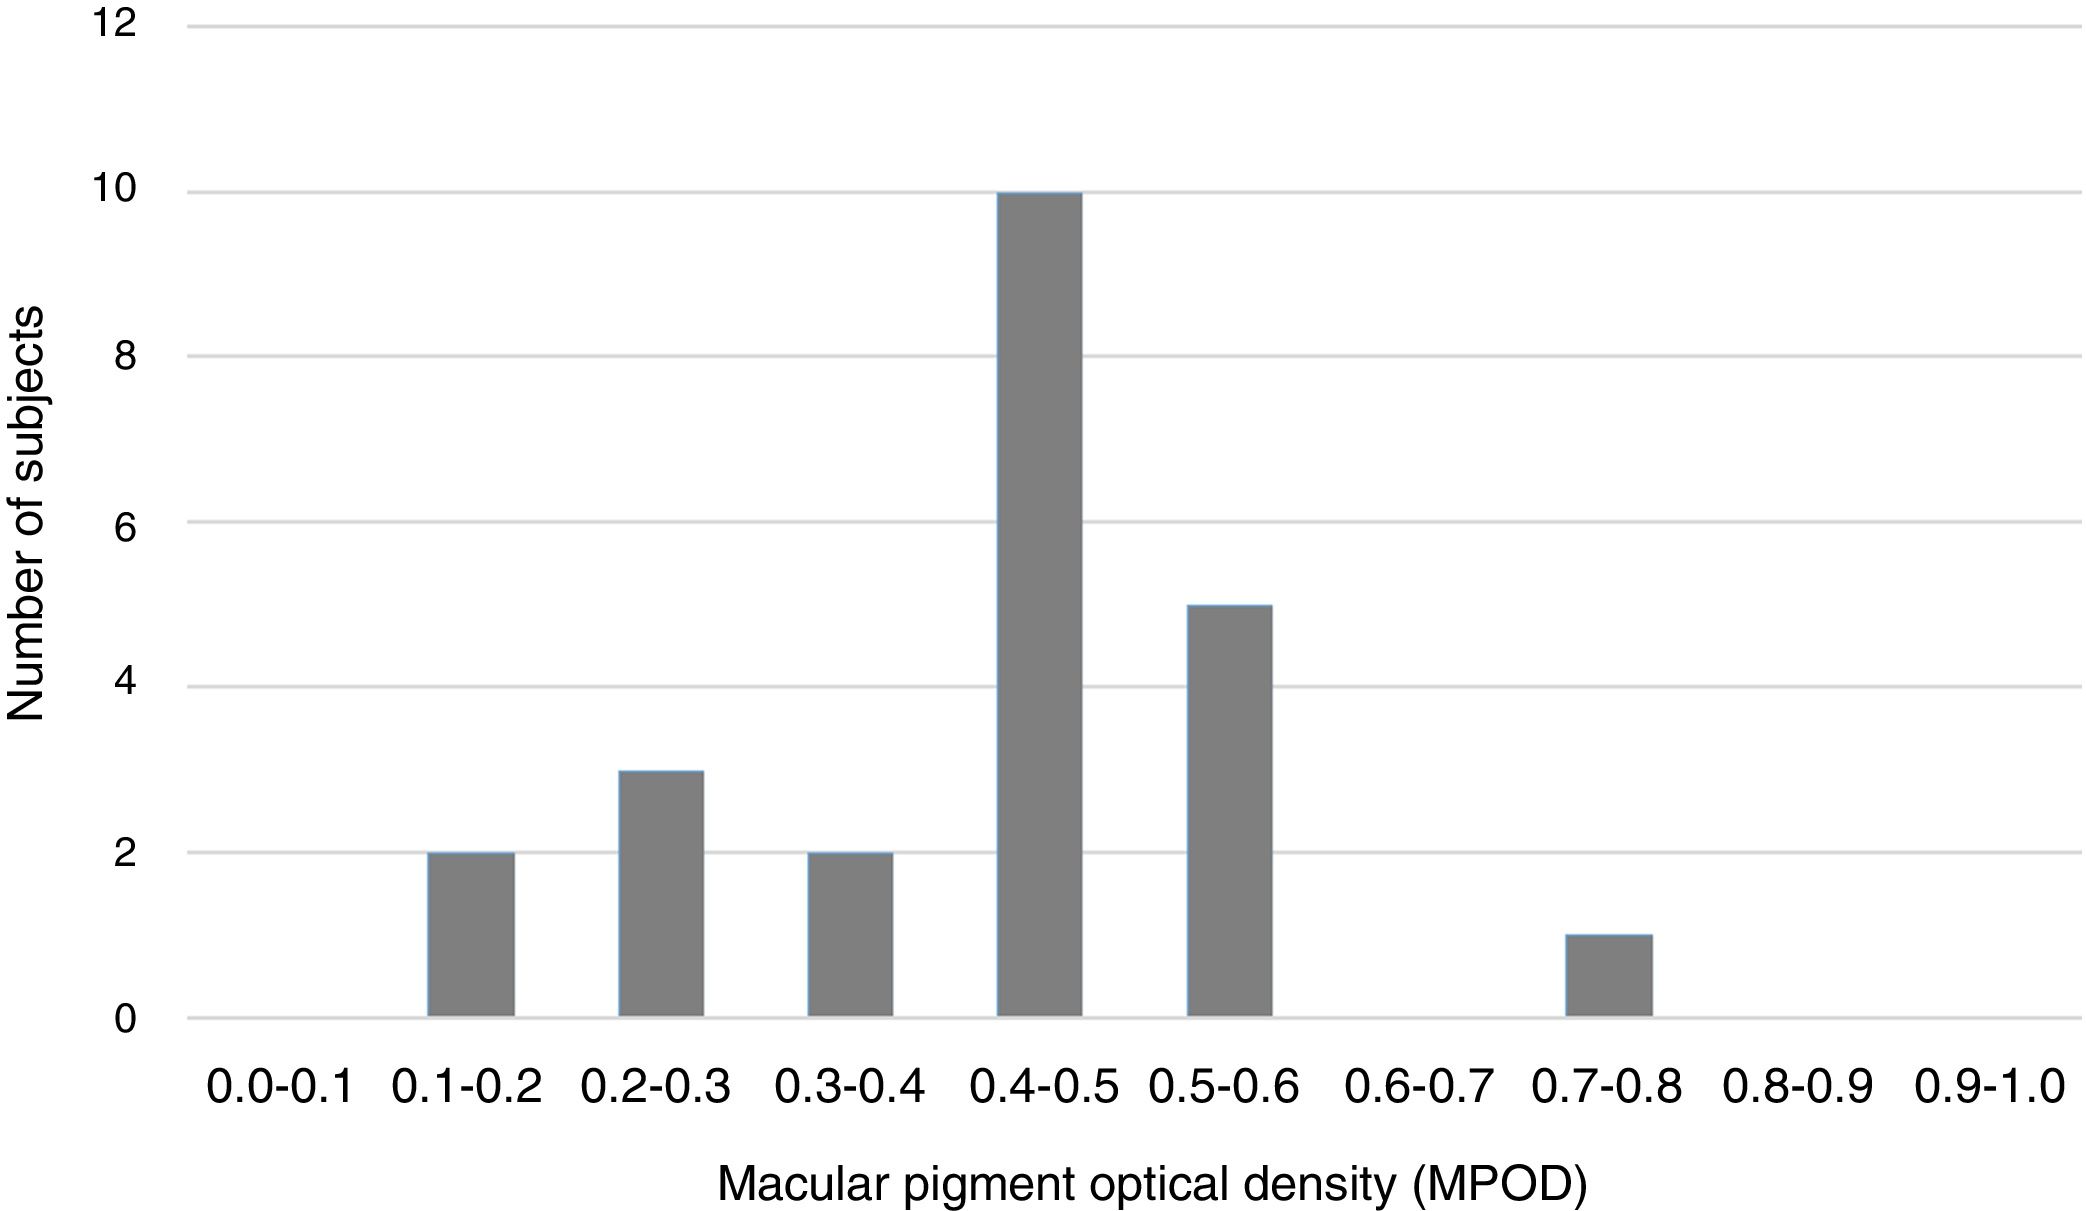
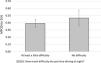
MPOD comparisons by sex, iris color, or race/ethnicity – while too statistically under-powered to find significant differences – are shown in Fig. 2. As seen in Fig. 2a, MPOD was slightly higher for men (0.44±0.12DU) in our study than women (0.41±0.14DU; t[21]=0.404, p=0.690). MPOD was essentially equivalent between subjects with blue irises (0.39±0.19DU) and hazel or green irises (0.40±0.07; t[11]=0.148, p=0.885). Subjects with brown irises had trends for higher MPOD (0.47±0.13DU) than subjects with blue (t[16]=1.145, p=0.269) or hazel/green (t[13]=1.152, p=0.270) irises (see Fig. 2b). Lastly, mean MPOD in subjects self-reporting to be “Other than White/non-Hispanic” (0.46±0.15DU) were slightly higher than in those reporting to be “White/non-Hispanic” (0.40±0.14DU; t[21]=0.917, p=0.369; see Fig. 2c). None of these findings approached significance, but the directions of the findings were as expected from previous investigations.19–21
Survey results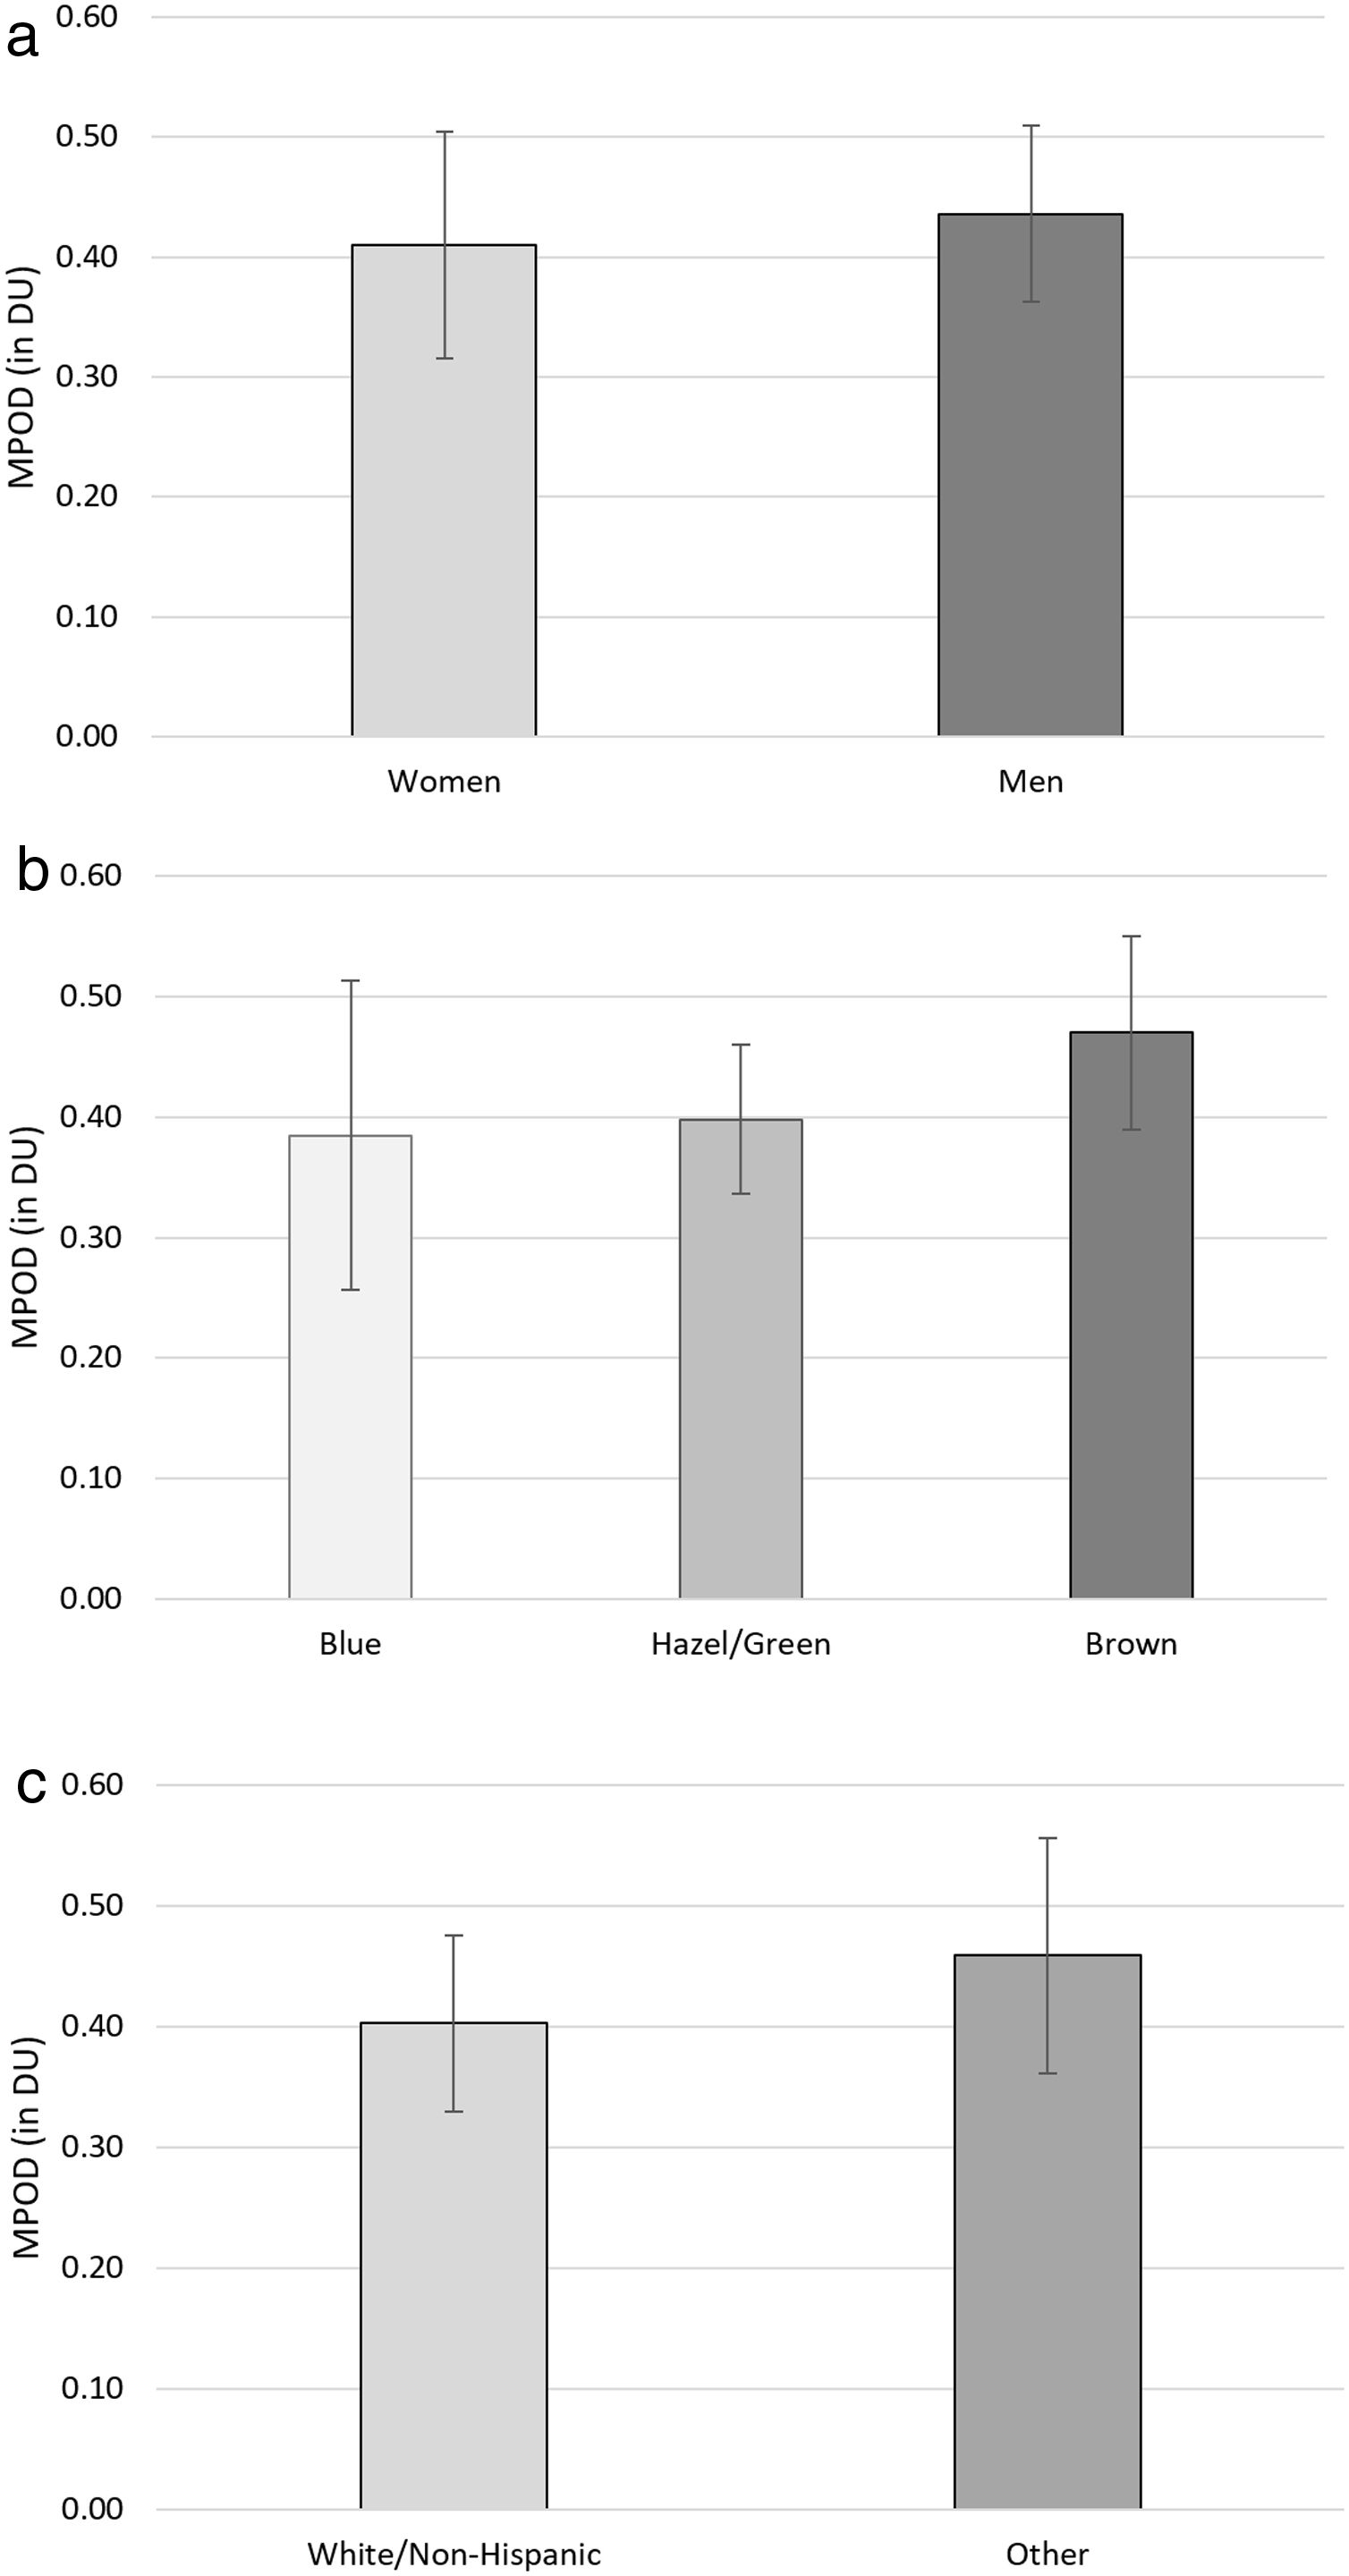
Of the 25 survey item responses, 22 had a median response representing no limitation or difficulty. There were four questions for which every subject recorded zero limitation. These items were: Item 12 – Because of your eyesight, do you have any difficulty matching or picking out clothes? Item 13 – Because of your eyesight, do you have any difficulty visiting with people socially? Item 15 – Do you drive? Item 23 – Because of your eyesight, do you have to rely too much on what other people tell you?
On the other hand, there were three questions where the median response represented at least some difficulty or limitation. These items were: Item 4 – How much pain or discomfort have you had in or around your eyes? Item 16 – How much difficulty do you have driving at night? Item 19 – How much does pain in or around your eyes keep you from doing what you want to be doing? While items 4 and 19 are typically summed into a total ocular pain score when grading the VFQ-25,17 we have constrained our analysis to the mean MPOD for individual items. These results are shown for items 4 and 19 separately in Fig. 3. Subjects who reported no discomfort in item 4 had significantly higher mean MPOD (0.51±0.12DU) than those reporting at least mild pain (0.39±0.17DU; t[21]=2.065, p=0.026). There was also a trend toward higher MPOD in subjects reporting that ocular discomfort never kept them from doing what they would like (0.48±0.15DU) than those who reported that occurred at least a little of the time (0.38±0.13DU; t[21]=1.648, p=0.057).
Comparison of mean MPOD in subjects reporting some discomfort (i.e., “mild or worse” or “at least a little of the time”) versus no discomfort (i.e., “none” or “none of the time”). Subjects who reported no discomfort had significantly higher MPOD (*p<0.05). There was also a trend toward higher MPOD in subjects reporting that ocular discomfort never kept them from doing what they would like to be doing (†p=0.057). Error bars represent±95% confidence intervals.
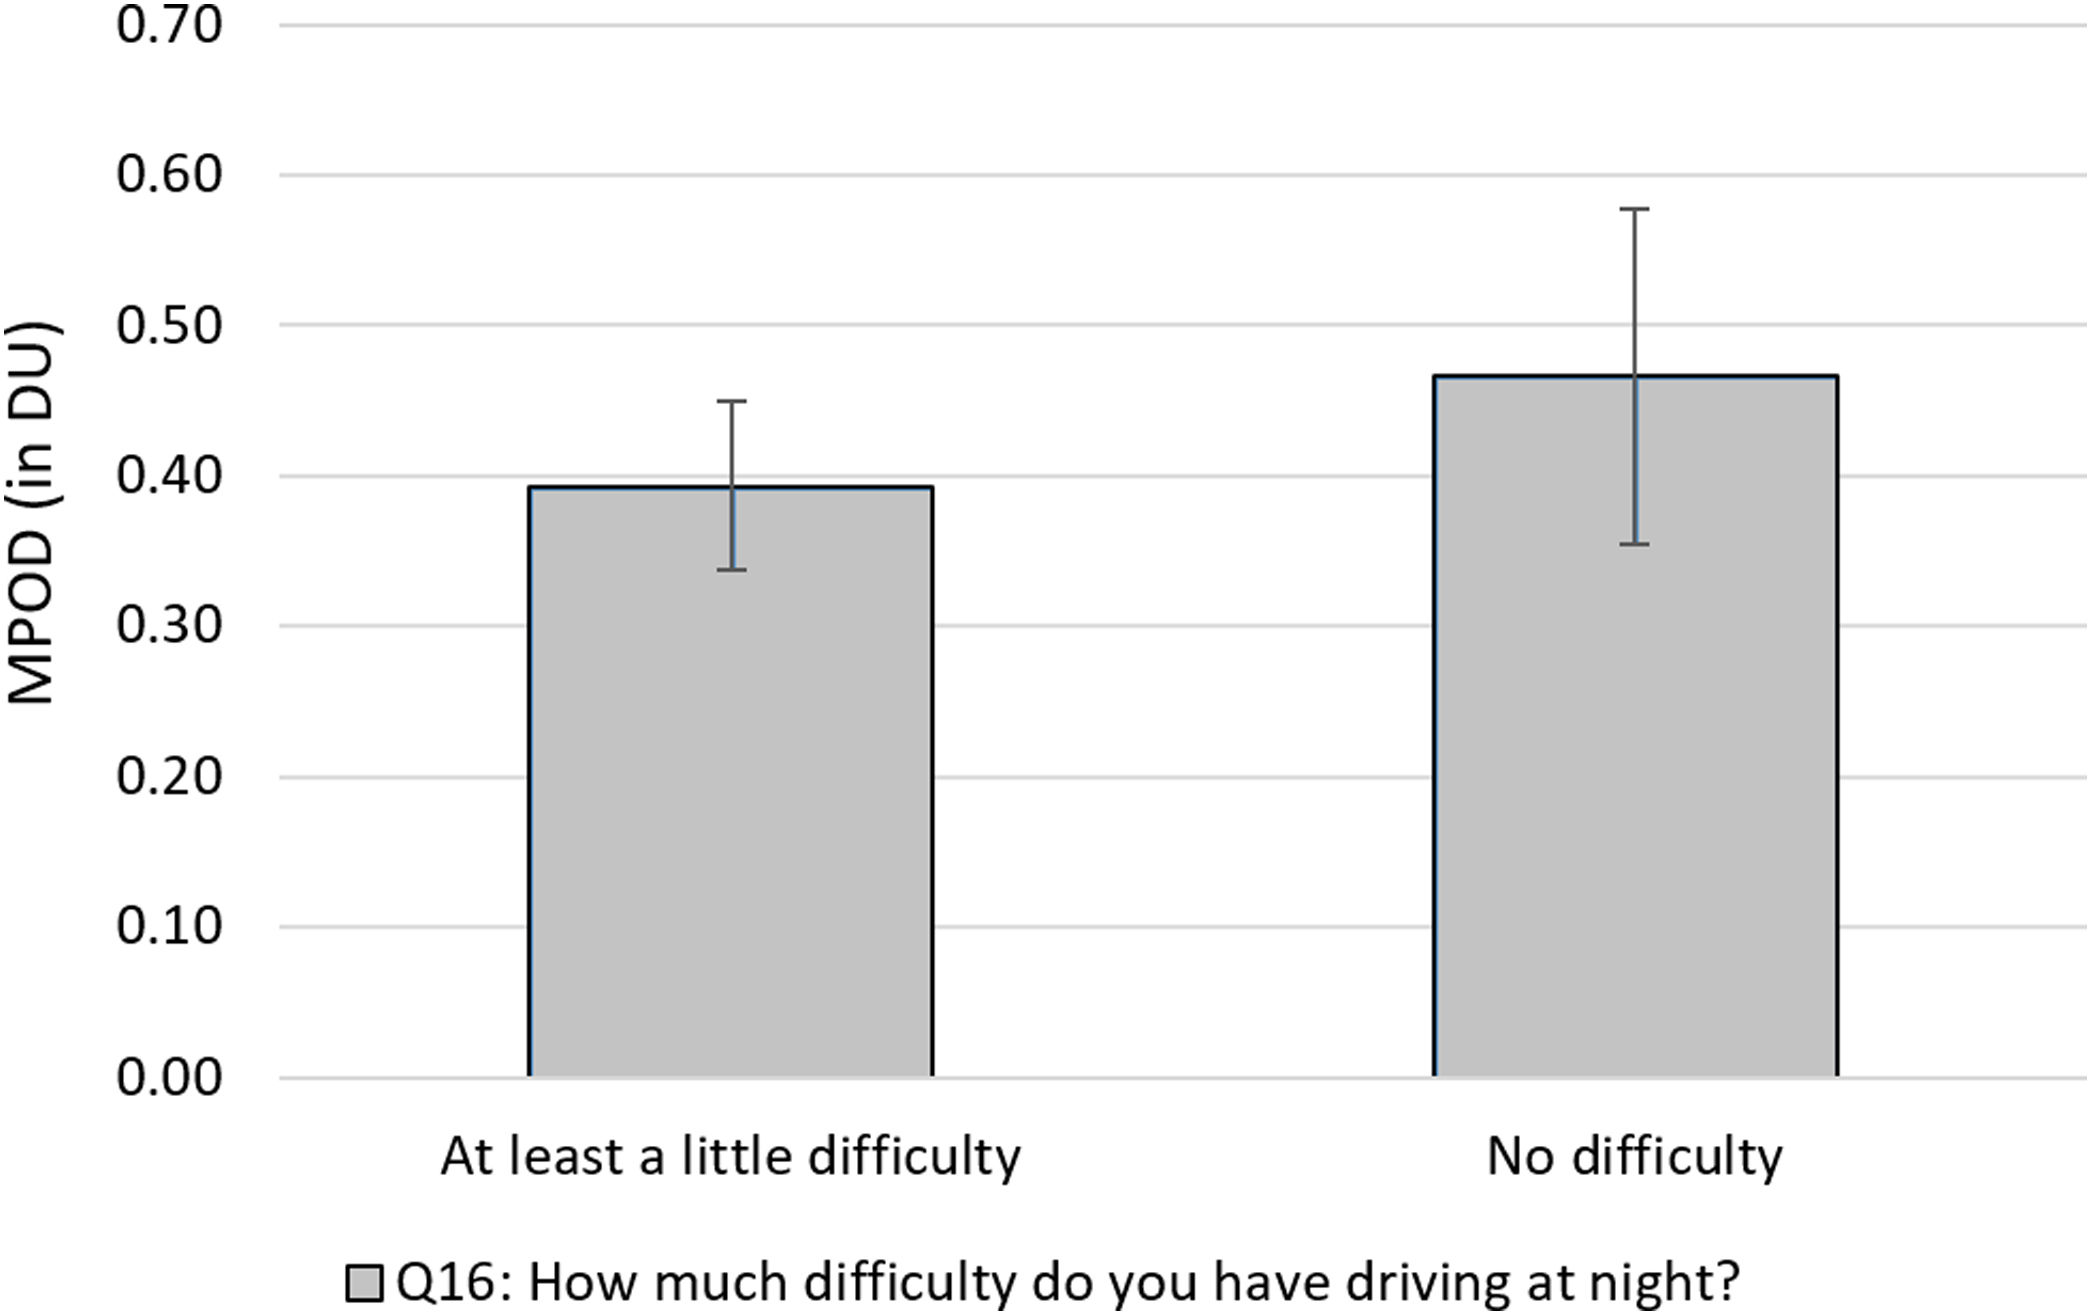
The results for item 16 are shown in Fig. 4. While not statistically significant, there was a mild trend toward higher MPOD levels in subjects who reported no difficulty driving at night (0.47±0.18DU) than in those who reported at least a little difficulty (0.39±0.13DU; 0.10; t[21]=1.229, p=0.116).
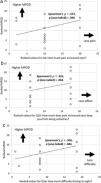
The results of our correlation analyses are similar, and scatterplots of ranked MPOD versus ranked survey responses are shown in Fig. 5. As with our parametric comparisons, the relationship between ranked MPOD and ranked responses to “How much pain or discomfort in or around your eyes?” was significant (ρ=0.373, p=0.040; see Fig. 5a). The relationship was also marginally significant for men (ρ=0.474, p=0.070) but not for women (ρ=0.247, p=0.220). The relationships were also positive and significant in subjects with brown irises (ρ=0.747, 0.007) and of race/ethnicity “other than White/non-Hispanic” (ρ=0.833, p=0.003). This is somewhat paradoxical, as there were trends for MPOD to be higher in these groups. There was also a marginally significant association between ranked MPOD and ranked responses to “How much does pain in/around your eyes keep you from doing activities?” (ρ=0.325, p=0.066; see Fig. 5b). This relationship also held in men (ρ=0.549, p=0.040) but not when considered separately for any other subgroup. Lastly, there was a significant association between ranked MPOD and survey responses to “How much difficulty do you have driving at night?” (ρ=0.360, p=0.046; see Fig. 5c). Unlike for the pain/discomfort survey questions, this relationship was also significant in women (ρ=0.699, p=0.006) and marginally significant in white/non-Hispanic subjects (ρ=0.415, p=0.070).
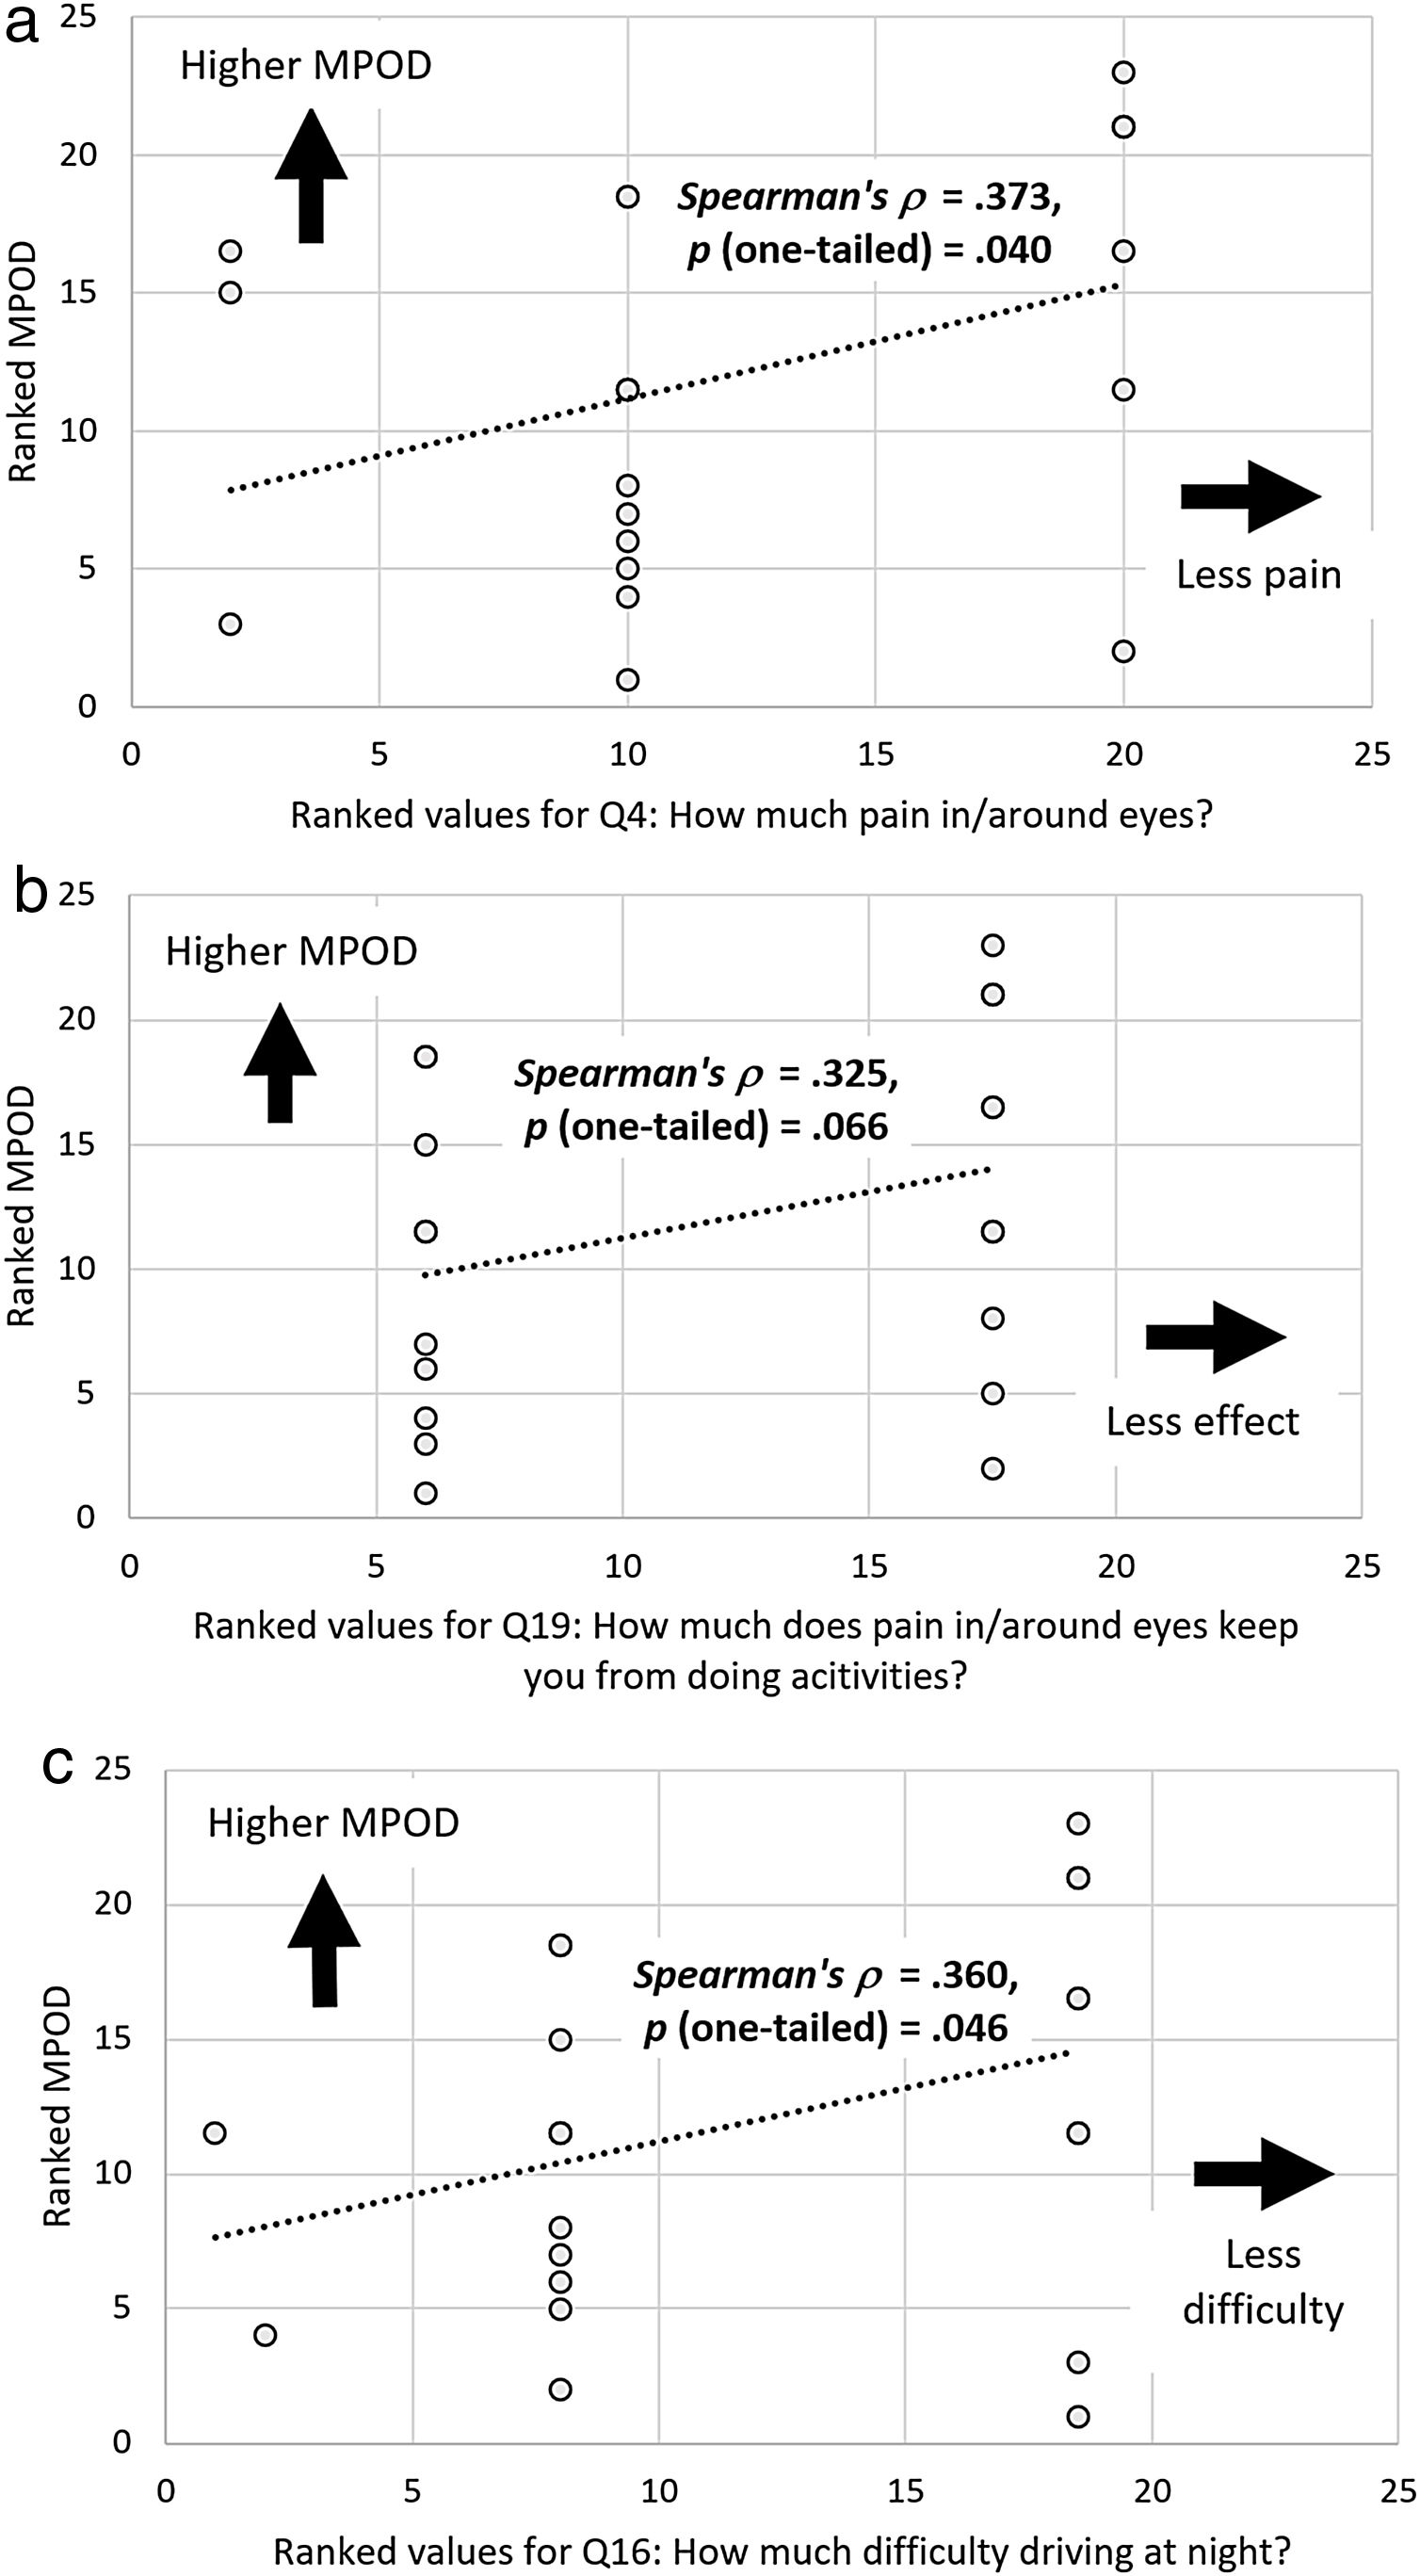
Scatter plots showing associations between ranked MPOD levels and (a) ranked responses for Q4: How much pain in/around eyes? (b) Q19: How much does pain in/around eyes limit activities, and (c) Q16: How much difficulty driving at night? These plots all further demonstrate associations between higher MPOD levels and less negative impact.
This study looked to correlate visual function as determined by a publicly available symptom survey (VFQ-25) and macular pigment optical density (MPOD) as measured by heterochromatic flicker photometry (HFP). The value in comparing these data is that subjective patient complaints can be used to drive clinical decision making in the use of MPOD testing. This concept in clinical care is not foreign to most practitioners in the evaluation and management of common conditions such as dry eye. However, there is minimal evidence in the literature that supports MPOD evaluations based on symptom surveys. MPOD testing can be easily added to the average eye care practice, as studies have shown that it is reliable, quick, and easily administered by non-professional staff.22 Further, there is evidence that dietary supplementation can improve macular pigment and visual function, offering the clinician intervention options for patients with MPOD deficiencies.22
Our findings suggest there may be value in evaluating MPOD in healthy patients that are symptomatic for increased ocular discomfort and difficulty driving at night. Even within our cohort of healthy subjects, MPOD was higher in subjects who reported no ocular discomfort (t[21]=2.065, p=0.026). There was also a statistically significant association between increased MPOD and lower reports of discomfort (ρ=0.373, p=.040). Any inferences made from these items are limited by the survey questions, where pain and discomfort are used synonymously and lumped together as “ocular pain” items (see questions 4 and 19 in Table 1). While we acknowledge this, it is still unclear why lower MPOD levels would translate to external ocular pain/discomfort or how that discomfort would limit a patient's activities. It has been demonstrated that higher levels of dietary lutein and zeaxanthin contribute to increases in MPOD, and these same nutrients are commonly found in healthy diets.23 Further, it has been well established that ocular surface disease and therefore, ocular discomfort is less prevalent in individuals who maintain a healthy diet.24 Therefore, it may be reasonable to associate higher MPOD with better ocular comfort through a correlate of healthy diet. This association between lower MPOD and ocular pain or discomfort “in or around the eye” has not been reported to our knowledge and represents an area that warrants further investigation.
Subjective complaints of difficulty driving at night showed an interesting trend within our study group. There has been ample evidence that the primary factor in difficulty driving at night is associated with glare disability and loss of contrast.25–27 There is also robust evidence that patients with diagnosed macular disease have decreased MPOD.22,28–31 Akuffo and colleagues further demonstrated a significant increase in mesopic and photopic glare disability as well as a loss in letter contrast sensitivity and mesopic and photopic contrast sensitivity in a cohort of AMD patients even when controlled for age and cataract severity.28 Others have shown that glare disability and contrast are enhanced by increasing MPOD levels, even in normal populations.30 Glare disability and contrast loss have a logical association with difficulty driving at night. The trend toward lower mean MPOD in our symptomatic subjects suggests that there may be value in directly assessing MPOD in those with some level of night driving complaint. Although there was only a trend toward higher MPOD levels in subjects reporting no difficult driving at night (t[21]=1.229, p=0.116), our correlation findings associating night driving and MPOD were statistically significant (ρ=0.360, p=0.046) – a finding that others have also demonstrated in a healthy population.32 The trend showing lower MPOD in symptomatic subjects suggests that subclinical macular dysfunction may be present and therefore, ancillary MPOD evaluation may be appropriate in these subjects. As previously mentioned, these otherwise healthy patients may benefit from intervention in the form of supplemental carotenoids, an area of investigation that deserves further study.
LimitationsThere are limitations that may limit inferences from our study. Perhaps the most obvious is the low number of subjects (n=23). We performed an a priori power analysis of independent t-tests using a large effect size (i.e., d=0.6; based on previous glare and discomfort findings9,25,26,30) and one-sided significance level (p-value) of 0.05. We found that we required 35 subjects for a power (1−β) of 0.80. We recruited 32 subjects, but – due to the limited length of the investigation, limited availability of clinical equipment, and lack of positive responses to the VFQ-25 survey questions – we decided to end data collection after 23 subjects completed the single session. Consequently, our comparisons were under-powered for the limitations of pain/discomfort (d=0.65; 1−β=0.70) and difficulty driving at night (d=0.4; 1−β=0.38), requiring 30 and 78 subjects, respectively. Interestingly, the MPOD comparisons for pain/discomfort in or around eyes were sufficiently powered (d=0.73, 1−β=0.79), and they represent the most significant finding of this pilot report. Regardless of our significant findings, a natural extension of this study would be to expand the number of subjects to strengthen our inferences.
Our assessment of MPOD with the QuantifEye MPS II device may also represent a research limitation when compared to custom densitometry measures of MPOD.22,31 However, our primary goal was to investigate the clinical relevance of using additional history questions to drive testing that would most likely be accomplished with a commercial – not custom – instrument. In addition, many of our inferences are based on subjective survey findings and previous studies correlating low MPOD with glare susceptibility.30,32 Future investigations should consider directly measuring glare in the survey cohort.
In the current study, survey data collection was not masked resulting in a potential reporting bias. The length of the survey and the depth of topics it addresses can vary. We chose to utilize the VFQ-25 as opposed to the longer, 51 item NEI VFQ; the former being preferred by the authors as well as most clinicians due to its relative brevity. However, we recognize that a more robust questionnaire may have yielded additional symptoms that could reveal further relationships with MPOD measurements.
The lack of objective clinical measurements investigating the source of complaints are a limitation here as well. Identifying the basis for ocular discomfort or pain as well as measurement of factors that are known contributors to difficulty with night driving may have led to a deeper understanding of our findings. Any expansion of this research with this or another group of subjects should also include objective measures of MPOD and macular thickness by optical coherence tomography (OCT). Other opportunities for further investigation include follow up with subjects that had abnormal VFQ-25 responses in our study to track development of macular dysfunction and the addition of an intervention arm to track resolution of symptoms. Further, a cohort of subjects with known macular dysfunction for comparison against our normal subjects is an area for additional research.
Clinical extensionsSurveys contribute to thorough patient history and overall assessment in that they have the potential to uncover problems that providers may not otherwise address. Valikodath and colleagues found that only 23% of medical records showed exact agreement in symptomology with pre-visit patient surveys.33 They further reported that 91% of patients reporting glare on their surveys did not have it recorded in their records; a potentially relevant extension to our inference that clinicians should directly ask these questions about glare and discomfort. In our study, all the subjects were in good health, and symptoms such as ocular pain/discomfort and trouble driving at night run the risk of not routinely being uncovered since they fell in the “mild” category. A purposeful inquiry into those symptoms helps to reveal their existence and perhaps prompt further investigation by the clinician. The use of symptom surveys in the clinic has initial challenges such as patient compliance, as well as additional time and administrative investment, but incorporation of such surveys and the use of their outcomes to drive appropriate ancillary testing may ultimately lead to earlier diagnosis and treatment of ocular conditions.
HFP has offered clinicians a tool for measuring and tracking patient MPOD. While it is currently a Category III Code and therefore, unlikely to be reimbursed by insurance carriers, there is ongoing study utilizing the technology in many areas.24 Once federal approval drives routine reimbursement for MPOD evaluation, the use of these instruments in the average practice is likely to increase. Our findings provide justification to run these evaluations on individuals who exhibit specific symptoms but are otherwise healthy.
ConclusionsThis study suggests that there may be significant clinical value in the incorporation of MPOD testing in healthy patients. The value may be further enhanced in practices that choose to incorporate patient surveys on a routine basis. Ancillary testing has the most value when applied to populations in a directed manner, and we identified a previously unreported relationship between MPOD and ocular discomfort in the absence of glare. While further investigation is warranted, this finding should prompt clinicians to consider MPOD evaluation in healthy patients with specific complaints.
FundingThis research received no external funding.
Conflicts of interestNone declared.
Portions of this manuscript were presented as a scientific poster at the October 2019 meeting of the American Academy of Optometry in Orlando, FL.


