


There have been several studies investigating static, baseline pupil diameter in visually-normal individuals across refractive error. However, none have assessed the dynamic pupillary light reflex (PLR). In the present study, both static and dynamic pupillary parameters of the PLR were assessed in both the visually-normal (VN) and the mild traumatic brain injury (mTBI) populations and compared as a function of refractive error.
MethodsThe VN population comprised 40 adults (22–56 years of age), while the mTBI population comprised 32 adults (21–60 years of age) over a range of refractive errors (−9.00D to +1.25D). Seven pupillary parameters (baseline static diameter, latency, amplitude, and peak and average constriction and dilation velocities) were assessed and compared under four white-light stimulus conditions (dim pulse, dim step, bright pulse, and bright step). The Neuroptics, infrared, DP-2000 binocular pupillometer (30Hz sampling rate; 0.05mm resolution) was used in the monocular (right eye) stimulation mode.
ResultsFor the majority of pupillary parameters and stimulus conditions, a Gaussian distribution best fit the data, with the apex centered in the low myopic range (−2.3 to −4.9D). Responsivity was reduced to either side of the apex.
ConclusionsOver a range of dynamic and static pupillary parameters, the PLR was influenced by refractive error in both populations. In cases of high refractive error, the PLR parameters may need to be compensated for this factor for proper categorization and diagnosis.
Existen diversos estudios que han investigado el diámetro pupilar estático y basal en individuos con visión normal en todo el espectro de errores refractivos. Sin embargo, ninguno de ellos ha evaluado el reflejo dinámico pupilar a la luz (RPL). En el presente estudio, se evaluaron tanto los parámetros pupilares estáticos como los dinámicos en poblaciones con visión normal (VN) y en las afectadas de lesiones cerebrales traumáticas leves (mTBI), comparándolos en función del error refractivo.
MétodosLa población VN incluyó a 40 adultos (de 22 a 56 años de edad), mientras que el grupo de mTBI incluyó a 32 adultos (de 21 a 60 años de edad) para un rango de errores refractivos (de -9D a+1,25D). Se valoraron siete parámetros pupilares (diámetro estático basal, latencia, amplitud, constricción máxima y media, y velocidades de dilatación), comparándose bajo cuatro situaciones de estímulo con luz blanca (pulso tenue, punto tenue, pulso brillante, y punto brillante). Se utilizó el pupilómetro binocular con infrarrojos DP-200 de Neuroptics (30Hz de muestreo; 0,05mm de resolución) en el modo de estimulación monocular (ojo derecho).
ResultadosPara la mayoría de los parámetros pupilares y situaciones de estímulo, los datos se ajustaron a una distribución gausiana, centrándose el ápex en el rango miópico bajo (−2,3 to −4,9D). La respuesta se redujo a ambos extremos del ápex.
ConclusionesPara un rango de parámetros pupilares dinámicos y estáticos, el RPL se vio influenciado por el error refractivo en ambas poblaciones. En casos de error refractivo elevado, los parámetros de RPL pueden necesitar compensarse por este factor, para su debida categorización y diagnóstico.
The technology to assess and quantify human pupillary response dynamics, such as the pupillary light reflex (PLR), has greater resolution and precision than ever before.1,2 Hence, there are many pupillometric studies which have investigated ways to exploit pupillary dynamics as a potential, objective diagnostic tool, as well as a possible biomarker for a variety of clinical conditions, such as glaucoma,3,4 amblyopia,5 and mild traumatic brain injury (mTBI).2,6,7
However, underlying all clinical conditions are basic physiological and biological factors that may influence the PLR. These must first be elucidated, and then perhaps factored in for a clearer and more accurate understanding of the findings, and in addition, their possible basic and clinical ramifications. For example, it is well known that the steady-state, baseline pupillary diameter progressively decreases with age.8,9 Another factor that is germane to the present study is that of refractive error (RE), which has been investigated in a few studies, but only with regard to steady-state (i.e., static), baseline pupillary diameter, with equivocal findings.10–13 Some studies found a significant relation with refractive error,10,11 while others12,13 did not. However, dynamic pupillary parameters, such as peak constriction velocity and latency, have never been studied as a function of refractive error. This may be important, as this factor may have to be taken into account in its quantification and diagnostic categorization of ‘normal versus abnormal’.
The present study was part of a larger investigation of pupillary responsivity in mild traumatic brain injury (mTBI), in which the static and dynamic responses have been found to be reduced, slowed, and delayed, as well as symmetrical between the two eyes.1,2,6,7 mTBI is caused by a “bump, blow, or jolt to the head, or a penetrating head injury, that disrupts normal function of the brain”.1 This may result in a constellation of sensory, motor, perceptual, cognitive, linguistic, and behavioral problems1 of a non-visual (e.g., disrupted sleep, nausea, confusion, etc.) and visual (e.g., vergence dysfunction, photosensitivity, visual motion sensitivity, etc.) nature, including adversely affecting the pupillary system (i.e., the pupillary light reflex, PLR).1,2,6,7
Thus, the purpose of the present investigation was to answer the following important basic and clinical question, that is, “What influence does refractive error have, if any, on dynamic pupillary responsivity”. Furthermore, if there is an effect of refractive error on pupillary dynamics, does that effect also apply to the mTBI population, whose pupillary dynamics have been shown through objectively-based, infrared pupillometry to be adversely affected by the mTBI, i.e., slowed and delayed, and having a smaller baseline diameter.2,6,7 This information is critical in the differential diagnosis between the two populations, as detailed in the Discussion section.
MethodsSubjectsForty visually-normal adult individuals without mTBI (mean age: 33±12 years, range 22–56 years) and 32 with mTBI (mean age: 37±11 years, range 21–60 years) participated in the study. The mean age of the two groups was not statistically different (p>0.05), and the age ranges were similar. In the normal group, the mean non-cycloplegic, manifest refractive error was −2.33±2.85 diopters (D) spherical equivalent (SE) with a range from −9.00 to +1.25D SE. In the mTBI group, it was −1.42±2.42D SE with a range from −8.50 to +1.25D SE. All subjects were in stable general health and were able to participate in the test sessions without difficulty. None had ocular opacities, were taking any medications, or had any systemic or neurological diseases that could adversely affect the pupillary response. Furthermore, none had a relative afferent pupillary defect (RAPD) as assessed clinically with the swinging flashlight test,14 as well as in the laboratory using objective recording techniques.14,15 All had received a comprehensive vision examination (i.e., refractive, binocular/motility, and ocular health status) within the previous year prior to participation in the study. A power analysis (ClinCalc.com) was performed for all parameters to determine the appropriate sample size (beta=0.80), which was exceeded in the study in both groups.
Those with mTBI were documented and medically diagnosed in local New York City hospitals (e.g., NYU Medical) by licensed practitioners (e.g., neurologists and physiatrists) using standard clinical criteria (e.g., Glasgow Coma Scale). Their visual symptoms were typical of those with mTBI,16 including oculomotor insufficiencies, blur, headaches, and photosensitivity, to name a few. They were then referred to the Raymond J. Greenwald Vision Rehabilitation Center at the State University of New York (SUNY), College of Optometry, University Optometric Center of New York (OCNY) for evaluation and remediation of their visual symptoms. All were in the chronic (>45 days post injury) mTBI phase17 when tested.
All normal subjects were recruited from the population at the college, which included students, staff members, and their family and friends. None had a history of concussion/mTBI, or blunt eye trauma, nor any ocular opacity (e.g., cataract) that could reduce the amount of light impinging on the retina.
The study was approved by the SUNY Institutional Review Board (IRB). It was in accordance with The Code of Ethics of the World Medical Association (Declaration of Helsinki). Written informed consent was obtained from all subjects prior to their participation.
ApparatusThe Neuroptics DP-2000 human pupillometer with a resolution of 0.05mm and a sampling rate of 30Hz was used to assess the pupillary light response (PLR) (http://www.neuroptics.com). This system is commercially-available and is FDA waived for research. This research-based system is comprised of an infrared optical scanner, various light emitted diode (LED) illumination sources, a computer, and dual cameras which can track, record, and analyze pupillary responses either monocularly or binocularly (Fig. 1). The device's stimulus characteristics are easily customizable, thereby allowing for a wide-range of combinations of intensity, duration, and chromatic composition.2
.")
Seven aspects of the pupil were assessed: (1) maximum diameter (i.e., baseline “static”, or steady-state diameter, prior to the light stimulus); (2) constriction latency (i.e., the time between the stimulus onset and initiation of the constriction response; reaction time); (3) average constriction velocity; (4) maximum (or “peak”) constriction velocity; (5) average dilation velocity; (6) maximum (or “peak”) dilation velocity; and (7) constriction amplitude (i.e., the difference between the maximum and the minimum pupillary diameters following light stimulation). See Fig. 2. All parameters were automatically obtained by the pupillometer's inherent analysis software, except for maximum dilation velocity which was calculated using the raw numeric data stream of pupillary diameter over time provided by the recordings.1,2 Sigmaplot (version 10) and Microsoft Excel (2010) were used for all calculations and graphical display.

Top: schematic representation of a pupil response profile and the associated pupil parameters assessed as indicated by the open circles. The prestimulus time is 0.5s, and the post-stimulus time is 6.0s. Bottom: schematic representation of the four experimental test stimulus conditions. The x-axis represents the relative time, and the y-axis represents the relative stimulus intensity. Dim=4lx, bright=251lx, pulse=100ms, and step=1000ms.
The stimulus test light was emitted through a diffusing screen with a large visual angle of 50° horizontally and 35° vertically. Since the stimulus was diffuse (i.e., non-patterned) and encompassed a large retinal area, wearing of a refractive correction was not critical.12 Thus, subjects did not wear their spectacle correction during testing. This also allowed for an easier and a more accurately aligned fit of the subject's head/eyes into the binocular pupillometer, hence allowing for better quality recordings. Contact lenses were also removed prior to testing to reduce the occurrence of dry eye that could impair the quality of recordings.
Experimental proceduresThere were four steps to the experimental procedure.2 They are described below. The entire test time was typically 1.5h or less.
First, subjects sat in the dim laboratory room (5lx) for 10min to allow for visual adaptation to occur.18 This low illumination also allowed the pupils to dilate to a considerable diameter, and hence result in a large, dynamic pupillary response subsequent to the light stimulation.
Second, the subject was aligned within the pupillometer and was instructed to gaze straight ahead. They were also directed to blink minimally to reduce response artifacts during the recording period, which if present were deleted from the data analysis; this accounted for less than 5% of the test trials. Blinking was also controlled by the experimenter as needed during testing.
Third, the test trials were then initiated. The stimulus was presented to the right eye, and the response of the right eye was recorded, with both eyes open. It has been demonstrated that the static and dynamic aspects of the pupillary response are highly correlated between the two eyes.1 Thus, the stimulus was always presented to the right eye for simplicity. In total, there were four stimulus conditions: dim white pulse, dim white step, bright white pulse, and bright white step. Stimulus intensity was: dim=4lx, bright=251lx, and stimulus duration was: pulse=100ms, and step=1000ms. See Fig. 2. The sequence of stimulus presentation was randomized to minimize response order effects. There were three trials for each stimulus condition, which were first averaged in the analysis for each subject, and then averaged across subjects in each diagnostic group. A labeled schematic pupillary response is presented in Fig. 2 depicting (A) the tested pupillary parameters and (B) the four stimulus conditions.
Lastly, after each individual test trial, the subject rested and remained in the dim illumination of the laboratory room to regain and obtain a similar pre-test visual adaptation level and baseline/maximum pupil diameter. Duration of this inter-trial period was 1min. This inter-trial period of visual re-adaptation was found to be more than sufficient for the present test conditions.2,19 Additional rest periods were incorporated as requested by the subject.
Data analysisThe data for the 28 test/parameter conditions (i.e., seven pupillary parameters and four test conditions) were assessed using Sigmaplot version 10 program. They were initially fit with either a linear or Gaussian profile. The best fit using a root mean square error (RMSE) analysis criterion was used for response quantification and categorization. RMSE quantifies the difference between values predicted between a model, or an estimator, and the values actually observed. RMSE analysis seeks the best fit to minimize these differences, and furthermore provides information as to significance level of the fit (i.e., p-value). Slope differences were assessed with the t-test.
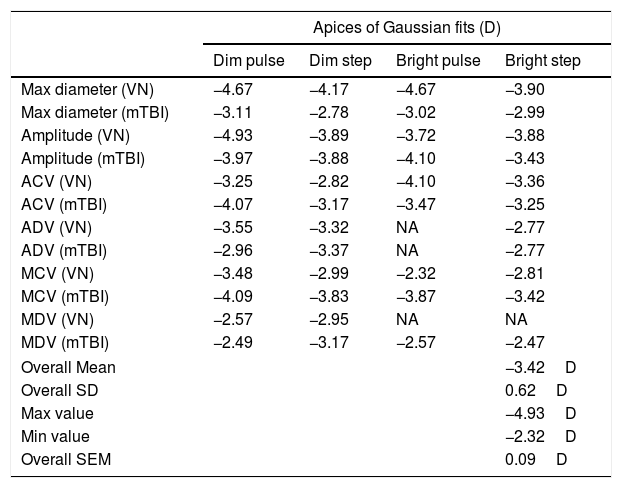
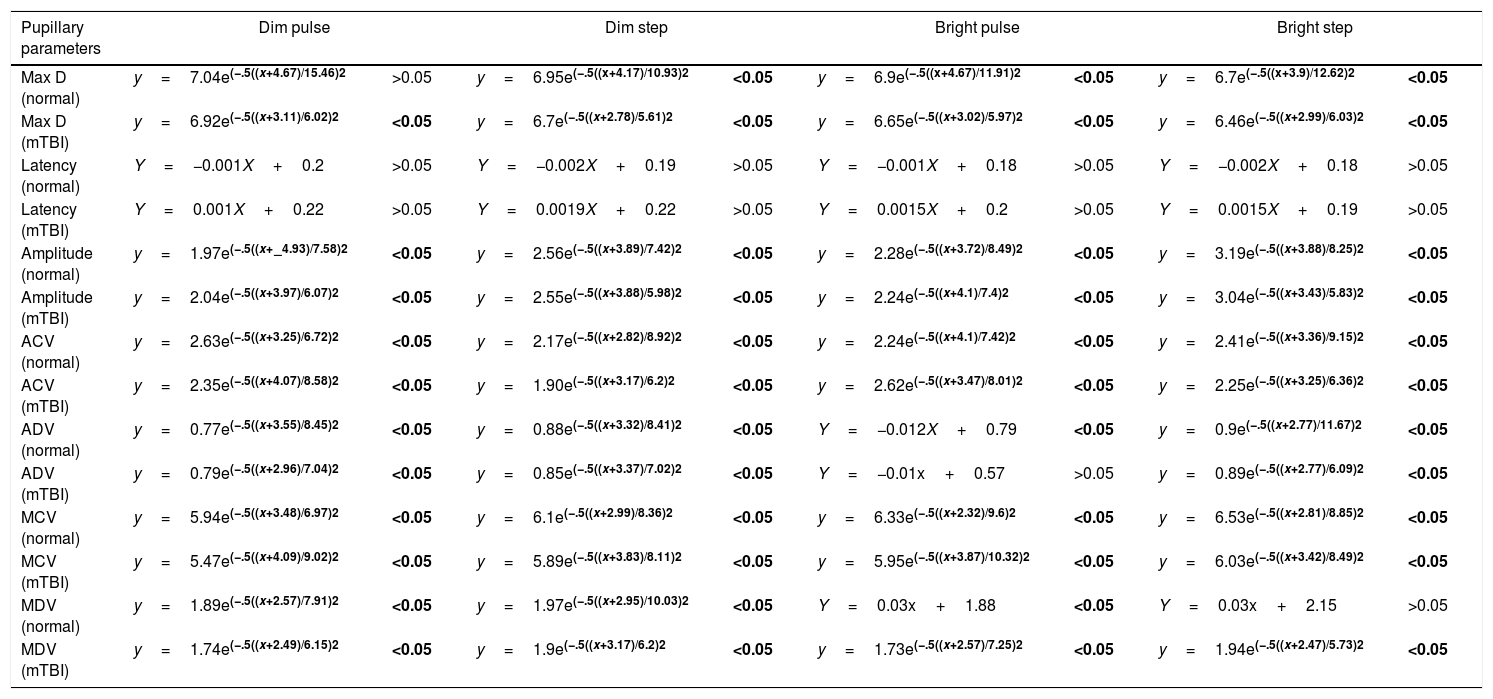
ResultsThere were three different response profiles found in each group as categorized in Fig. 3(a–c). The first was best fit with a Gaussian profile in both groups. See Fig. 3a. This was found for the majority of parameters and conditions in both groups. The exception was dilation velocity under the bright pulse condition, in both groups. The apices (i.e., peaks) of the Gaussian fits are presented in Table 1 for all applicable parameters and stimulus conditions. The myopic peak ranged from 2.3 to 4.9D. The second profile was linear in each group. See Fig. 3b. This only occurred for latency across all four conditions in both groups. The slope for the regression line did not differ statistically from zero, however, thus revealing lack of a relation to refractive error in each group. Lastly, the third profile exhibited a linear profile/relationship in one group and a Gaussian one in the fellow group. See Fig. 3c. This was only found for maximum dilation velocity under both the bright pulse and bright step conditions. A summary of these 28 responses for each group for the four test conditions and seven pupillary parameters are presented in the Appendix – Table A1 and Fig. A1. Table A1 presents the Gaussian and linear equations, and related p-values, that best fit each group/condition/parameter. Fig. A1 presents a summary of the 28 responses in graphical form in both groups.
 in diopters, showing the three general response categories. Data points represent the mean value for each subject. Closed circles represent the normals, and open circles represent those with mTBI. Solid lines represent the best fit for the normals, and dashed lines represent the best fit for those with mTBI. Avg DV=average dilation velocity in mm/s. Max DV=maximum dilation velocity in mm/s. Time is in s.")
Selected representative pupillary parameter profiles as a function of refractive error (RE) in diopters, showing the three general response categories. Data points represent the mean value for each subject. Closed circles represent the normals, and open circles represent those with mTBI. Solid lines represent the best fit for the normals, and dashed lines represent the best fit for those with mTBI. Avg DV=average dilation velocity in mm/s. Max DV=maximum dilation velocity in mm/s. Time is in s.
Apices and related information for Gaussian curve fits for the different stimulus conditions and pupillary parameters combined for the two populations.
| Apices of Gaussian fits (D) | ||||
|---|---|---|---|---|
| Dim pulse | Dim step | Bright pulse | Bright step | |
| Max diameter (VN) | −4.67 | −4.17 | −4.67 | −3.90 |
| Max diameter (mTBI) | −3.11 | −2.78 | −3.02 | −2.99 |
| Amplitude (VN) | −4.93 | −3.89 | −3.72 | −3.88 |
| Amplitude (mTBI) | −3.97 | −3.88 | −4.10 | −3.43 |
| ACV (VN) | −3.25 | −2.82 | −4.10 | −3.36 |
| ACV (mTBI) | −4.07 | −3.17 | −3.47 | −3.25 |
| ADV (VN) | −3.55 | −3.32 | NA | −2.77 |
| ADV (mTBI) | −2.96 | −3.37 | NA | −2.77 |
| MCV (VN) | −3.48 | −2.99 | −2.32 | −2.81 |
| MCV (mTBI) | −4.09 | −3.83 | −3.87 | −3.42 |
| MDV (VN) | −2.57 | −2.95 | NA | NA |
| MDV (mTBI) | −2.49 | −3.17 | −2.57 | −2.47 |
| Overall Mean | −3.42D | |||
| Overall SD | 0.62D | |||
| Max value | −4.93D | |||
| Min value | −2.32D | |||
| Overall SEM | 0.09D | |||
Related to the above, for the visually-normal population, there were several important findings. First, 21 out of the 28 comparisons had significant fits, and thus exhibited a refractive-based response profile, with 20 of the 21 fits being Gaussian. Second, the four most consistent parameters, with all having a Gaussian fit, were average constriction velocity, average dilation velocity, maximum/peak constriction velocity, and dynamic response amplitude. Third, the two test conditions demonstrating the most consistent fits (i.e., 6 out of the 7 parameters), with most being Gaussian, were for the bright pulse and dim step stimuli.
Related to the above, for the mTBI population, there were several important findings. First, 22 out of the 28 comparisons had significant fits, and thus exhibited a refractive-based response profile, with 22 out of the 22 being Gaussian. Second, the four most consistent parameters, with all having a Gaussian fit, were average constriction velocity, maximum/peak constriction velocity, maximum/peak dilation velocity, and maximum diameter. Third, all but the bright pulse test stimulus condition gave the most consistent fits (i.e., 6 out of 7 parameters).
DiscussionOverviewThis is the first time dynamic pupillary responsivity has been assessed with respect to refractive state. The present findings revealed that, in general, most of the PLR dynamic parameters across the four stimulus conditions were best fit with a Gaussian, or bell curve, distribution with its maxima centered at −2.3 to −4.9D in our two age-matched samples covering a relatively wide distribution of refractive errors. That is, dynamic responsivity was non-monotonic in nature, being highest for the low myopes, and considerably slower, for example, in the high myopes (e.g., −7D). This is consistent with the clinical observation that high myopes have ‘sluggish’ pupils.20 In a few cases, however, the data were best fit either linearly (e.g., average dilation velocity for a bright pulse) or revealed no trend (i.e., latency) with refractive state.
Comparison with previous studies and observationsThe present findings are consistent with three of the five studies which assessed the static, baseline/maximum pupillary diameter over a wide range of illumination levels10,11,13 for large samples (n=304–600, ages 10–78 years) of visually-normal individuals for a wide range of refractive errors (−14.13 to +10.13D). Myopes always had the numerically largest pupillary diameter. However, two studies revealed lack of relation to refractive state when age (range 17–83 years) was factored in with their ANOVA statistical analysis.12,21 In the present investigation, the two groups were statistically age-matched, so the possible confound of age was effectively negated. Second, and perhaps more importantly, we too did not find any relation between pupil diameter and refractive state using a linear fit, but did so with a Gaussian fit. Thus, a different analysis resulted in a different outcome and interpretation.
Possible etiologies to explain the present findingsThe present findings revealed that in many cases, dynamic pupillary responsivity was related to the individual's refractive state, with a maximum at 2.3–4.9D of myopia depending on the specific pupillary parameter. We speculate that there may be at least two possible mechanisms in play.
The first involves the underlying anatomy and related biomechanical aspects. There are size and/or shape differences in the pupil and contiguous anterior segment of the eye (e.g., anterior chamber depth) as a function of refractive state.22,23 Such changes could result in refractive-dependent, ‘optimal’ biomechanical properties (e.g., modulus of elasticity and geometric architecture), with correlated optimization of the dynamic response. For example, this is true for accommodative oscillations.24,25 The amplitude and frequency of the objectively-recorded accommodative oscillations varied considerably in young subjects with changes in the accommodative stimulus level and resulting accommodative steady-state response, as quantified via power spectrum analysis: the oscillations were maximum at intermediate and relatively near distances, and they reduced considerably at very far and very near distances. The argument is that over this optimal range where the modulus of elasticity is most efficient, and thus most responsive, the lens zonules can maximally transmit the small neural pertubations primarily arising from the brain and ciliary nerve, whereas at far the zonules are too stretched (‘taut’) to do so effectively, and at very near distances they are too loose (‘flaccid’) to transmit them faithfully.
The second involves the underlying pharmacology. Data26 suggest that the pharmacological control of accommodation may be different over the range of refractive groups, but especially in myopes: for example, many myopes appear not to have full access to the sympathetic system which influences one's refractive state.26 Furthermore, there is convincing data showing that the amplitude of accommodation is greatest in 2D myopes, with fall-off to either side of the range, similar to that found in the present study.27 Future investigations should perform laboratory experiments (e.g., fMRI in humans) and also bioengineering control system modeling of the pupil and surrounding anatomy to gain further insight into the reasons for this refractive-related, response variation.
Clinical implicationsThe present findings are important clinically in the differential diagnosis, as they offer a baseline metric by which to assess all other dynamic pupillometric findings in the normal population, as well as in the mTBI population with its smaller pupils and slower dynamics.1,2,6,7 Both between and within these two tested clinical groups, and likely in other clinical populations, the refractive error may need to be factored in before differentiating between ‘normal versus abnormal’. This is especially true for patients with refractive errors deviating considerably from the −2.3 to −4.9D maximum dynamic response range. For example, for the parameter of peak constriction velocity, an 8D myope would have approximately a 20% reduction in value as compared to that of a 4D myope. Hence, in a patient whose pupil values are ‘borderline’, this difference might change the diagnosis from normal to abnormal, but incorrectly so. For refractive errors in the −2.3 to −4.9D range, such a compensation may not be warranted, as the differences and influences are small.
For the static parameter of baseline pupil diameter assessed under a constant level of illumination, the factor of age must be considered. As has been found in many studies, there is a small, progressive decrease in baseline diameter with increased age (0.045mm/yr over the age range of 15–80 years.9 This is also true in the normal population and extended to the mTBI population per the present investigation. See Fig. 4. In the clinic setting, for every decade of increased age, there would be predicted, on average, approximately a 0.5mm reduction in maximum baseline pupillary diameter.
 as a function of increasing age in years (x-axis) and diagnostic group.")
The lack of relation between refractive error and pupillary latency is an interesting and important one. For the most part, responsivity of the other pupillary parameters appears to have a biomechanical and/or pharmacological basis. In contrast, latency cannot, as it reflects a primary and basic neurosensory phenomenon, and as such, there is no logical basis for it to be refractive error dependent.
LimitationsA limitation of the present study is the relatively narrow range of refractive errors in this sample. In the normal group, the refractive error range was from −9.00 to +1.25D SE. In the mTBI group, it was from −8.50 to +1.25D. It would have been beneficial to have higher myopes than −9.00D, and higher hyperopes than +1.25D. A larger range of refractive errors may have yielded a more accurate descriptive profile.
Another limitation was the age range of the present sample. It ranged from 18 to 60 years. It would have been beneficial to know if the present findings hold true in the pediatric, adolescent, and senior populations as well.
Conflicts of interestThe authors have no conflicts of interest to declare.
We thank Dr. Bernard Gilmartin for his insightful conversations, and the US Army Aeromedical Research Laboratories for their support and loan of the binocular pupillometer.
Presents Gaussian and linear fit equations, and p-values, for all pupillary parameters against refractive error for all test conditions for both the normal and mTBI populations. The pupillary parameters are maximum diameter (Max D), latency, amplitude, average constriction velocity (ACV), average dilation velocity (ADV), maximum constriction velocity (MCV) and maximum dilation velocity (MDV). Bold designation represent significant fits to data.
| Pupillary parameters | Dim pulse | Dim step | Bright pulse | Bright step | ||||
|---|---|---|---|---|---|---|---|---|
| Max D (normal) | y=7.04e(−.5((x+4.67)/15.46)2 | >0.05 | y=6.95e(−.5((x+4.17)/10.93)2 | <0.05 | y=6.9e(−.5((x+4.67)/11.91)2 | <0.05 | y=6.7e(−.5((x+3.9)/12.62)2 | <0.05 |
| Max D (mTBI) | y=6.92e(−.5((x+3.11)/6.02)2 | <0.05 | y=6.7e(−.5((x+2.78)/5.61)2 | <0.05 | y=6.65e(−.5((x+3.02)/5.97)2 | <0.05 | y=6.46e(−.5((x+2.99)/6.03)2 | <0.05 |
| Latency (normal) | Y=−0.001X+0.2 | >0.05 | Y=−0.002X+0.19 | >0.05 | Y=−0.001X+0.18 | >0.05 | Y=−0.002X+0.18 | >0.05 |
| Latency (mTBI) | Y=0.001X+0.22 | >0.05 | Y=0.0019X+0.22 | >0.05 | Y=0.0015X+0.2 | >0.05 | Y=0.0015X+0.19 | >0.05 |
| Amplitude (normal) | y=1.97e(−.5((x+−4.93)/7.58)2 | <0.05 | y=2.56e(−.5((x+3.89)/7.42)2 | <0.05 | y=2.28e(−.5((x+3.72)/8.49)2 | <0.05 | y=3.19e(−.5((x+3.88)/8.25)2 | <0.05 |
| Amplitude (mTBI) | y=2.04e(−.5((x+3.97)/6.07)2 | <0.05 | y=2.55e(−.5((x+3.88)/5.98)2 | <0.05 | y=2.24e(−.5((x+4.1)/7.4)2 | <0.05 | y=3.04e(−.5((x+3.43)/5.83)2 | <0.05 |
| ACV (normal) | y=2.63e(−.5((x+3.25)/6.72)2 | <0.05 | y=2.17e(−.5((x+2.82)/8.92)2 | <0.05 | y=2.24e(−.5((x+4.1)/7.42)2 | <0.05 | y=2.41e(−.5((x+3.36)/9.15)2 | <0.05 |
| ACV (mTBI) | y=2.35e(−.5((x+4.07)/8.58)2 | <0.05 | y=1.90e(−.5((x+3.17)/6.2)2 | <0.05 | y=2.62e(−.5((x+3.47)/8.01)2 | <0.05 | y=2.25e(−.5((x+3.25)/6.36)2 | <0.05 |
| ADV (normal) | y=0.77e(−.5((x+3.55)/8.45)2 | <0.05 | y=0.88e(−.5((x+3.32)/8.41)2 | <0.05 | Y=−0.012X+0.79 | <0.05 | y=0.9e(−.5((x+2.77)/11.67)2 | <0.05 |
| ADV (mTBI) | y=0.79e(−.5((x+2.96)/7.04)2 | <0.05 | y=0.85e(−.5((x+3.37)/7.02)2 | <0.05 | Y=−0.01x+0.57 | >0.05 | y=0.89e(−.5((x+2.77)/6.09)2 | <0.05 |
| MCV (normal) | y=5.94e(−.5((x+3.48)/6.97)2 | <0.05 | y=6.1e(−.5((x+2.99)/8.36)2 | <0.05 | y=6.33e(−.5((x+2.32)/9.6)2 | <0.05 | y=6.53e(−.5((x+2.81)/8.85)2 | <0.05 |
| MCV (mTBI) | y=5.47e(−.5((x+4.09)/9.02)2 | <0.05 | y=5.89e(−.5((x+3.83)/8.11)2 | <0.05 | y=5.95e(−.5((x+3.87)/10.32)2 | <0.05 | y=6.03e(−.5((x+3.42)/8.49)2 | <0.05 |
| MDV (normal) | y=1.89e(−.5((x+2.57)/7.91)2 | <0.05 | y=1.97e(−.5((x+2.95)/10.03)2 | <0.05 | Y=0.03x+1.88 | <0.05 | Y=0.03x+2.15 | >0.05 |
| MDV (mTBI) | y=1.74e(−.5((x+2.49)/6.15)2 | <0.05 | y=1.9e(−.5((x+3.17)/6.2)2 | <0.05 | y=1.73e(−.5((x+2.57)/7.25)2 | <0.05 | y=1.94e(−.5((x+2.47)/5.73)2 | <0.05 |
 showing the range of fit for both diagnostic categories under the four different stimulus conditions. Data points represent the mean value for each subject. Closed circles represent the normals, and open circles represent the mTBI subjects. Solid lines represent best fit for the normals, and dashed lines represent the best fit for those with mTBI. The asterisk signifies that the mean for that parameter is significantly different between the normal group and mTBI group. 15 out of 28 parameters showed a significant difference between the two groups.")
Pupillary parameter profiles as a function of refractive error (diopters) showing the range of fit for both diagnostic categories under the four different stimulus conditions. Data points represent the mean value for each subject. Closed circles represent the normals, and open circles represent the mTBI subjects. Solid lines represent best fit for the normals, and dashed lines represent the best fit for those with mTBI. The asterisk signifies that the mean for that parameter is significantly different between the normal group and mTBI group. 15 out of 28 parameters showed a significant difference between the two groups.


