


The maximum accommodative range is a useful indication of visual function. It decreases with age, but the exact cause of this decrease is not fully understood. It is associated with the increasing rigidity of the lens and changes to the lens shape, as well as the geometry of the zonular attachments. This work aims to determine the relationship between the accommodative range and lens shape in a group of healthy young adults.
MethodsThis study includes 40 emmetropic participants between 20 and 30 years of age. They filled in a questionnaire and underwent accommodation measurements using the RAF Convergence Rule and the Negative Lens Test. After a drop of Tropicamide 0.5 % and Cyclopentolate 1 %, participants underwent measurements with autorefractor, Scheimpflug tomography (Pentacam HR, Oculus), anterior segment Optical Coherence Tomography and optical biometry.
ResultsThe accommodative range did not correlate significantly (p>0.05) with any of the lenticular or ocular parameters considered, such as lens thickness, lens radii of curvature, axial length, or corneal power.
ConclusionThe crystalline lens shape does not affect the accommodative range of the eye. This may be due to the smaller deformation required to bring a thicker lens to the same level of accommodation as a thinner lens. The amount of force on the zonular fibres may therefore be similar, in all lenses, regardless of the lens shape.
Accommodation is the ability of the eye to alter its refraction for optimal near vision. This process is mediated by the ciliary muscle and imparted on the lens capsule by the zonules, leading to a change in lens shape in response to visual demand.1 The exact process by which this occurs is still a matter of debate.2
In practice, the maximum accommodative range is a useful indication of visual function. It is typically over 10D in children aged around 10 years and decreases linearly with age until it eventually reaches 0D at 45–55 years. An accommodative range below 2–3D is accompanied with a loss in quality of life as this hinders normal reading (presbyopia).1 A reduced ability to accommodate quickly and accurately plays a role in the development of myopia in children.3 The cause of presbyopia is still not fully understood, but it is known to be associated with the increasing rigidity of the lens material,4 changes to the lens shape and the geometry of the zonular attachments.5 Despite extensive studies on the biometric changes of the lens that produce accommodation,5-7 no other parameters have been reported to affect the accommodative range. Even so, large variations in the crystalline lens geometry have been reported.7,8 This leads to the question whether lens geometry might affect the accommodative range. One may hypothesize that it may be more difficult to mechanically alter the shape of a rounder lens compared to that of a flatter lens. This idea may have some credence based on observations in people with diabetes, who have a reduced accommodative range,9 along with thicker, more curved, and higher powered lenses.10,11
To investigate this hypothesis in healthy eyes, this work aims to determine the relationship between the accommodative range and the lens shape in a group of healthy young adults.
Material and methodsFor this study, 42 participants were recruited from the personnel of the Antwerp University Hospital. Inclusion criteria were an age between 20 and 30 years and being close to emmetropia (i.e., cycloplegic refractive error within ±1.5D). Exclusion criteria were previous ophthalmological or systemic health issues. The use of oral medication was no exclusion criteria. This study received approval from the Ethics Committee of the Antwerp University Hospital and each participant gave written informed consent before measurements were performed.
The investigation started with a questionnaire to record age, sex, length, medical history, and medication use. After determining the dominant eye, all further testing was performed on the non-dominant eye to minimize the disruption to participants’ daily activities. Accommodation was first measured using the RAF Convergence Rule, which consists of a bar attached to an arc that is placed over the subject's nose. The bar serves as a rail for a small letter chart with markings in centimetres (cm) and dioptres (D). The test starts with the letter chart placed at the position farthest from the subject's eye and is slowly moved closer to the eye until the subject reports blurring of the letters. This position was recorded in dioptres. The accommodative range was then determined a second time using the Negative Lens Test, in which participants were required to look at the 0.0 line of a logMAR visual acuity chart with their non-dominant eye. Negative lens power was subsequently added in –0.5D steps until participants were no longer able to compensate through accommodation and were no longer able to read the letters clearly. The corresponding negative power was then recorded in dioptres.
Next, a drop of Tropicamide 0.5 % and a drop of Cyclopentolate 1 % was administered to the study eye, followed by a 30-minute waiting period. Participants then underwent measurements with the autorefractor (Nidek ARK-100, Gamagori, Japan), Pentacam HR (Oculus, Wetzlar, Germany), Casia II OCT (Rockmed, Neurenberg, Germany), and Lenstar (Haag-Streit, Köniz, Switzerland). These data were used to calculate the lens power using the thick lens formula with an equivalent refractive index of 1.431,12 and the lens volume by modelling it as two intersecting spherical caps.
All analyses were performed with SPSS 25 (IBM, Armonk, NY, USA) and Excel 365 (Microsoft, Seattle, WA, USA) using a threshold for significance of p<0.05 with a Bonferroni correction.
ResultsOf the 42 participants, 2 participants were excluded, one because of high astigmatism (–1.50 D), and one because of an inability to clearly see the 1.0 line on the visual acuity chart. Thus, a cohort of 40 participants (20 women, 20 men) remained for further analysis.
No significant correlation was found between accommodation and age (Table 1, Fig. 1) due to the narrow age range being considered. Accommodative range also did not correlate significantly with any of the lenticular or ocular parameters considered (p>0.05/14=0.0038 with Bonferroni correction) for either of the two accommodation tests used.
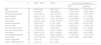
Descriptive statistics of the cohort.
| N | Mean ± StDev | Range | Corr. with accommodation (p) | ||
|---|---|---|---|---|---|
| RAF | Neg. lens | ||||
| Age | 40 | 25.3±2.8 yrs | [20, 30] yrs | –0.268 (0.094) | 0.119 (0.465) |
| Corneal thickness | 40 | 545±33 µm | [483, 625] µm | –0.155 (0.340) | –0.067 (0.681) |
| Anterior chamber deptha | 40 | 3.18±0.26 mm | [2.50, 3.72] mm | –0.324 (0.041) | –0.169 (0.297) |
| Lens thickness | 40 | 3.64±0.17 mm | [3.20, 3.99] mm | 0.165 (0.308) | 0.171 (0.293) |
| Vitreous depth | 40 | 16.20±0.74 mm | [14.61, 18.63] mm | –0.016 (0.920) | –0.102 (0.531) |
| Axial length | 40 | 23.51±0.73 mm | [21.83, 25.74] mm | –0.101 (0.537) | –0.129 (0.429) |
| Spherical equivalent | 40 | 0.45±0.45 D | [–0.63, 1.38] D | –0.031 (0.849) | 0.043 (0.792) |
| Corneal power | 40 | 42.88±1.36 D | [39.75, 46.45] D | –0.025 (0.877) | –0.026 (0.876) |
| Ant. lens surface power | 40 | 7.56±0.79 D | [6.18, 9.20] D | 0.170 (0.294) | 0.111 (0.496) |
| Post. lens surface power | 40 | 15.73±0.98 D | [13.99, 17.53] D | 0.194 (0.230) | 0.140 (0.389) |
| Lens power | 40 | 22.99±1.53 D | [20.13, 24.44] D | 0.206 (0.202) | 0.143 (0.380) |
| Lens equatorial diameter | 40 | 9.91±0.33 mm | [9.26, 10.59] mm | –0.158 (0.332) | –0.107 (0.512) |
| Lens volume | 40 | 153.1±10.9 mm3 | [129.2, 175.1] mm3 | –0.021 (0.897) | 0.033 (0.838) |
| Accom. range (RAF) | 40 | 9.5±1.9 D | [7.0, 15.0] D | ||
| Accom. range (Neg. lens) | 40 | 5.8±2.4 D | [2.0, 10.5] D | ||
StDev: Standard deviation; Corr: Pearson correlation r, where p values < 0.05/14 = 0.0034 (Bonferroni) are considered significant.

The results above reject the hypothesis that lens shape affects the accommodative range in young adults. Although from a geometrical perspective, it may be expected that a thin lens would be more easily deformed than a thick lens, shape alone is not sufficient to determine the degree of deformation. The positions of the zonular fibres and the angles of their insertions to the lens will be key determinants in the amount of shape change. If a lens is more curved, the angle of the zonular fibres to the lens capsule will be greater and may reduce the tension that is imparted to the capsule and that is required to alter the shape of the lens. Another possible explanation is that thicker, more curved lenses need less deformation to accomplish the same amount of accommodative power (Fig. 2). Hence, even if thicker lenses would be more difficult to deform, a smaller change in surface curvature may be required to accomplish the same optical effect. The amount of tension imparted by the zonular fibres may also be lower in a more curved lens. Note that the lens shape is not the only parameter which determines the refractive power of the lens: the other is its refractive index which depends on its protein distribution and concentration.13
 and lens thickness (right). The data were obtained using the thick lens equation as an inverse problem to find the corresponding radii of curvature for 5D accommodation assuming the same proportion between both radii as the resting state.")
Estimated changes in the lens radii of curvature to produce 5D of accommodation, calculated using the thick lens equation as a function of lens power (left) and lens thickness (right). The data were obtained using the thick lens equation as an inverse problem to find the corresponding radii of curvature for 5D accommodation assuming the same proportion between both radii as the resting state.
In post-mortem adult human lenses the profile of the refractive index gradient along the optic axis is relatively constant across a wide age range.8 Internal changes with accommodation in the living eye largely take place in the nucleus,14-16 where the refractive index is relatively constant and the thickness of which does not alter with age.8 These in vitro lenses are presumably in their most accommodated state as they are no longer under tension by the ciliary muscle or the zonules, but this has yet to be confirmed.
One limitation of our study is the significant differences between de RAF Convergence Rule and the Minus Lens Test to measure the amplitude of accommodation. This is a well-known issue that affects every known accommodation test, whether subjective or objective17-20 and is associated with the inherent variability in measurement techniques, as well as the difficulty for individual participants to accurately indicate their maximum level of accommodation in a repeatable fashion. This reflects the dynamics of the visual and accommodative system and, whilst it may introduce variability on the individual level, it is less problematic on the level of the entire cohort as the overall correlation values between the shape and accommodative range were similar for both techniques, thus strengthening the quality of the results. Another possible limitation of our study is the use of oral medication with a possible negative influence on accommodation. One participant used Sertraline.21 Because only 1 of the 40 participants took this product, this does not alter the conclusions of this paper.
ConclusionThe shape of the crystalline lens does not affect its accommodative range. This may be due the smaller deformation required to a bring a thicker lens to the same level of accommodation as a thinner lens. The amount of force exerted by the zonular fibres may therefore be similar, regardless of lens geometry. Further research in pre-presbyopes may be needed to verify this hypothesis.
None.


