

The purpose of this study was to determine the relationship between HbA1c values and retinal sensitivity at central 10° using the MP-1 microperimeter.
MethodsA prospective study was carried out on 32 healthy subjects (control group) and 60 diabetic patients. The diabetic patients were divided into 2 groups. Group 1 comprised of 30 patients without diabetic retinopathy (DR) and group 2 had 30 patients with mild non-proliferative DR. A full-threshold microperimetry of the central 10° of retina (the macula) was performed on all subjects, utilizing 32 points with the MP-1. The relationship between light sensitivity and HbA1c value was calculated using linear regression analysis.
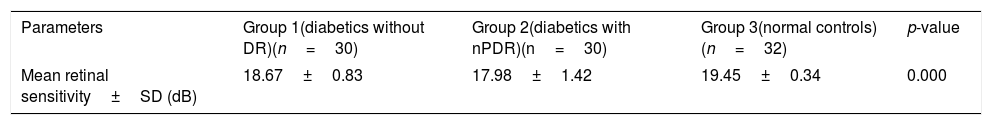
ResultsTotal mean sensitivity at 10° for group 1 without DR, group 2 with mild NPDR and control group were 18.67±0.83, 17.98±1.42 and 19.45±0.34 (dB), respectively. There was a significant difference in total mean retinal sensitivity at 10° between the 3 groups (F(2,89)=18.14, p=0.001). A simple linear regression was calculated to predict HbA1c based on retinal sensitivity. A significant regression equation was found (F(1,90)=107.61, p=0.0001, with an R2 of 0.545). The linear regression analysis revealed that there was a 0.64dB decline in mean retinal sensitivity within the central 10° diameter with an increase of 1mmHg of HbA1c.
ConclusionRetinal sensitivity at the central 10° of the macula is affected by changes in HbA1c values.
El objetivo de este estudio fue determinar la relación entre los valores de HbA1c y la sensibilidad de la retina en los 10 grados centrales de la misma utilizando el microperímetro MP-1.
MétodosSe realizó un estudio prospectivo en 32 sujetos sanos (grupo control) y 60 pacientes diabéticos. Los pacientes diabéticos se dividieron en dos grupos: el grupo 1 se compuso de 30 pacientes sin retinopatía diabética (RD), y el grupo 2 incluyó a 30 pacientes con RD no proliferativa leve. Se realizó una microperimetría umbral total de los 10° centrales de la retina (la mácula) a todos los sujetos, utilizando 32 puntos con el MP-1. Se calculó la relación entre la sensibilidad retiniana y el valor de HbA1c utilizando un análisis de regresión lineal.
ResultadosLa sensibilidad media total a los 10° para el grupo 1 sin RD, el grupo 2 con NPDR leve y el grupo control fue de 18,67 ± 0,83, 17,98 ± 1,42 y 19,45 ± 0,34 (dB), respectivamente. Se observó una diferencia significativa en cuanto a sensibilidad media total de la retina a 10° entre los tres grupos (F(2,89) = 18,14, p = 0,001). Se realizó un análisis de regresión lineal simple para predecir HbA1c en base a la sensibilidad de la retina. Se encontró una ecuación de regresión significativa (F(1,9) = 107,61, p = 0,0001, con R2 de 0,545). El análisis de regresión lineal reveló que existe un descenso de 0,64dB de la sensibilidad media de la retina dentro del diámetro de 10° centrales con un incremento de 1 mmHg de HbA1c.
ConclusiónLa sensibilidad de la retina en los 10 grados centrales de la mácula se ve afectada por los cambios de los valores de HbA1c.
An ocular complication associated with diabetes mellitus (DM), which is diabetic retinopathy (DR), is one of the most common causes of blindness all over the world.1 Although it has been regarded as a microvascular disorder,2 there is recent evidence that retinal neurodegeneration is an early event in the pathogenesis of diabetic retinopathy.3 The retinal neurosensory losses precede the onset of clinically detectable retinopathy.4 Many studies have shown that DM is accompanied by neuroretinal degeneration, which can be observed structurally and functionally.5,6 Although ample evidence suggests that retinal damage results from microvascular abnormalities, it is mostly assumed that the neuroretinal degeneration is a secondary effect of microvascular damage. However, there is mounting evidence that neuroretinal alterations are present even in the absence of clinically detectable retinal diabetic retinopathy.6–8
Several randomized controlled trials and observational studies have shown that glycated hemoglobin or hemoglobin A1c is a good predictor of microvascular complications,9,10 and is highly correlated with fasting plasma glucose.11 Therefore, the use of HbA1c as a diagnostic test for diabetes has been recommended.12,13 Higher levels of HbA1c were associated with microvascular complications. It has been shown that mild and moderate retinopathy were rare below HbA1c 6.6–7.0% and the prevalence increased 16–17-fold above this level of HbA1.14
The structural changes observed as a result of neuroretinal degeneration are neural apoptosis, ganglion cell (GC) loss, reactive gliosis, and thinning of the inner retina; whereas the functional changes observed are deficits in the electroretinogram (ERG), dark adaptation, contrast sensitivity, color vision, and microperimetric and perimetric psychophysical testing.5,6 Recently, fundus-driven microperimetry has emerged as a simple, non-invasive and rapid test that can be used in the clinical practice.15,16 Microperimetry measures retinal sensitivity in terms of the minimum light intensity that patients can perceive when spots of light stimulate specific areas of the retina. Some recent studies have suggested that microperimetry is even more sensitive than multifocal electroretinography (mfERG) in detecting early functional changes of the retina.17
On these bases, this study was conducted to determine the relationship between HbA1c values and retinal sensitivity at central 10° using the MP-1 microperimeter. It is hypothesized that since HbA1c is associated with diabetic retinopathy, and the presence of diabetic retinopathy is associated with diminution of retinal sensitivity, therefore HbA1c would be associated to the diminution of retinal sensitivity.
Material and methodsSubjectsThe study protocol was performed on 3 groups of subjects. Group 1 comprised of 30 diabetic patients without DR, group 2 comprised of 30 diabetic patients with mild non-proliferative DR (nPDR) and group 3, which was the control group, comprised of 32 healthy adults. The diabetic patients were chosen among patients attending the diabetic eye clinic whereas the healthy group was the volunteers who attended either for a routine ocular examination or as a person accompanying a patient at the diabetic eye clinic in a hospital in the Klang Valley.
Only subjects with Type 2 diabetes, with best corrected visual acuity of 6/9 or better,18 refractive errors less than −3.00D sphere and less than or equal to±1.00D cylinder were included. Eyes with significant ocular pathologies, clinical evidence of macular disease, trauma, surgery, systemic disorder or medication known to affect visual function were excluded.18
ProcedureAll recruited patients were subjected to a detailed medical ocular history, glycemic blood test (HbA1c) and comprehensive optometric examinations (which included visual acuity and refractions test, slit-lamp examination, IOP measurement, fundus examination) A microperimetry was also conducted. All procedures were performed by the same experienced optometrist. The glycated hemoglobin (HbA1c) test was performed by a certified nurse.
MicroperimetryThe fundus perimetry was performed using microperimetry, MP-1 (Nidek Technologies, Padova, Italy) in a dark room by a trained optometrist. The subject was dark-adapted for 10min before the actual test was initiated.19 All subjects were given a test run of 5 stimulus presentations before starting the actual measurements in order to familiarize them with the protocol and minimize the learning effect on their performance.
The stimulus size used was Goldmann III (0.41° diameter) with a presentation time of 200ms and 1.27cd/m2 background illumination.20 The MP-1 threshold was performed within 10° of the retina central (1°=300μm, thus 10°=3000μm that encompasses the macular area) by using a 32-point strategy with 4-2-1 automated staircase threshold method. The details of the test and testing procedure has been described previously.21
Statistical analysisStatistical analyses were performed using SPSS software version 20.0 (SPSS, Chicago, IL, USA). Shapiro–Wilk test was used to determine the distribution of the data and was found to be normally distributed. As such, parametric tests were applied for data analysis. Qualitative variables were expressed as mean±SD. Statistical significance was assumed at p<0.05 within 95% confident interval, CI.
Differences in retinal light sensitivity and differences in HbA1c values among the 3 groups of subjects were evaluated by the one-way ANOVA statistical test. Relationship between HbA1c and retinal sensitivity was determined using Pearson correlation. The linear regression analysis was used to measure the strength of the linear relationship between retinal light sensitivity with HbA1c values.
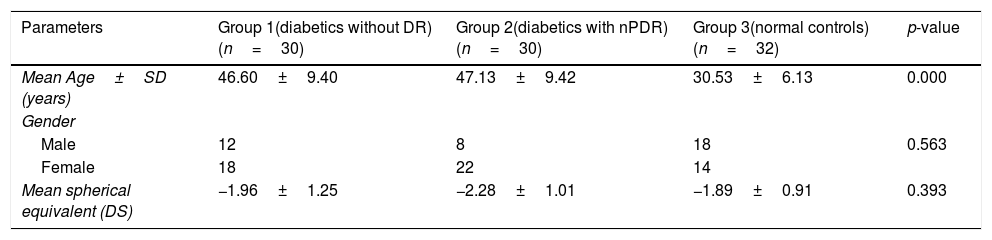
ResultsDemographic dataThe demographic data of subjects in this study are shown in Table 1. The age range of subjects recruited in this study was between 19 and 58 years for group 1, 27 and 59 years for group 2, and 23 and 47 years for group 3. There was a significant difference in age between the age groups. A Tukey post hoc test revealed a statistically significant difference in age between group 3 and group 1 and group 2. There was however no difference in age between group 1 and 2.
Demographic data of subjects.
| Parameters | Group 1(diabetics without DR)(n=30) | Group 2(diabetics with nPDR)(n=30) | Group 3(normal controls)(n=32) | p-value |
|---|---|---|---|---|
| Mean Age±SD (years) | 46.60±9.40 | 47.13±9.42 | 30.53±6.13 | 0.000 |
| Gender | ||||
| Male | 12 | 8 | 18 | 0.563 |
| Female | 18 | 22 | 14 | |
| Mean spherical equivalent (DS) | −1.96±1.25 | −2.28±1.01 | −1.89±0.91 | 0.393 |
Table 2 shows the mean retinal sensitivity at the central 10°. There was a significant difference in mean retinal sensitivity between the 3 groups; F(2,89)=18.14, eta2=0.28 (p<0.05). A Tukey post hoc test revealed a significant difference in mean retinal sensitivity between group 3 and group 1 and group 2. There was, however, no significant difference in mean retinal sensitivity between group 1 and group 2.
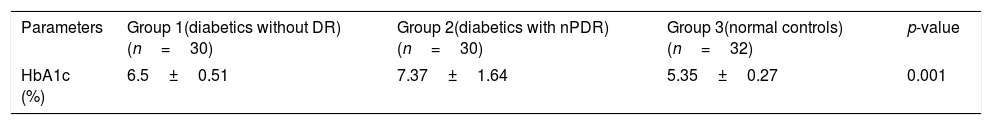
HbA1c valuesHbA1c values were statistically different between the three groups. Mean HbA1c (SD) in diabetes groups was significantly higher than control group as can be seen in Table 3. Tukey post hoc test revealed a statistically significant difference in HbA1c values between all 3 groups.
Relationship between HbA1c values and mean retinal sensitivityThe relationship between HbA1c values and mean retinal sensitivity was determined by Pearson correlation. There was a good and significant correlation (r=−0.73, p=0.000) between the 2 variables. Linear regression analysis showed that HbA1c values accounted for a 54.5% significant reduction in retinal sensitivity (R2=0.545). Fig. 1 shows the scatter plot of HbA1c and central retinal sensitivity. The regression equation was:


It is also predicted that for every increase of 1 unit mmHg HbA1c values, there will be a decrease in retinal sensitivity in the central 10° retina of 0.64dB. The results also showed 54% of the central retinal sensitivity changes is influenced by HbA1c control. Fig. 1 shows that scatter plot of the relationship between HbA1c values and retinal sensitivity.
DiscussionTo the best of our knowledge, this is the first study that explored the relationship between HbA1c with retinal sensitivity. This study revealed that the mean retinal sensitivity at the central 10° was reduced in both the diabetic groups 1 and 2 when compared to the control group 3. Our previous study showed that there was a decline in retinal sensitivity with increasing age of normal healthy subjects.21 Although in the present study there was a significant difference in the age between the three groups, when the mean retinal sensitivity of the subjects in group 1 and 2 were compared to our previous study of normal healthy subjects, the retinal sensitivities were lower than expected for that age group. For group 1 and 2, the difference in retinal sensitivities were statistically significant (group 1: difference=0.800 with standard error=0.250, DF=40, t=3.202, 95% CI: 0.2950–1.3050, p=0.0027; group 2: difference=1.490 with standard error=0.418, DF=40, t=3.565, 95% CI: 0.6452–2.3348, p=0.001). However, there was no significant difference for group 3 (difference=0.010 with standard error=0.103, DF=45, t=0.097, 95% CI: −0.1968 to 0.2168, p=0.9228). Therefore, the decline in retinal sensitivity for the diabetes group is not due to the age factor but due to the diabetes itself. Metabolic pathways22 and inflammatory mechanisms23 due to hyperglycemia have been shown to play a crucial role in development of diabetic retinopathy. The activation of these pathways and mechanisms leads to abnormalities in the neural retina (resulting in retinal neurodegeneration) and the capillary bed located in the inner retina (resulting in microangiopathic injury). Microperimetry measures the retinal light sensitivity of neural retina. When the retinal sensitivity is reduced, this is possibly due to neural damage. The results here indicate that neural damage possibly precedes clinical diabetic retinopathy.24,25 The decline in retinal sensitivity in diabetics has been shown by other studies as well.26–28
The HbA1c values were significantly higher in the diabetes groups compared to the control group. Group 1 subjects had mean HbA1c values of 6.5±0.51. This group had diabetes but no retinopathy. It has previously been shown that mild and moderate retinopathy were rare below HbA1c 6.6–7.0 and the prevalence increased 16–17-fold above this level of HbA1c.14
Our results showed that there was a relationship between HbA1c values and retinal sensitivity. Linear regression analysis showed that HbA1c values accounted for a 54.5% significant reduction in retinal sensitivity. It is also predicted that for every increase of 1 unit mmHg HbA1c values, there will be a decrease in retinal sensitivity in the central 10° retina of 0.64dB.
Classically, diabetic retinopathy has been considered to be a microvascular complication caused by elevated blood glucose levels and metabolic pathways triggered by hyperglycemia. However, the retina is not primarily a vascular tissue. It is a neuronal tissue with a vascular supply, in which, the retinal neurons, glia, and retinal vasculature are interconnected to form a functional neurovascular unit with intricate molecular interactions.29 As such, hyperglycemia likely affects the neuro-retina and its vasculature resulting in variable dysfunctions other than impairment of visual acuity. There is increasing evidence of early retinal neurodegeneration in diabetes, which may even precede the vascular changes.28 The neuronal degeneration patterns have been observed in various animal models of diabetes, in which early retinal dysfunction has been demonstrated.29–32
ConclusionThe data from this study revealed that there is a relationship between HbA1c values and 10° central retinal sensitivity in diabetic patients. HbA1c values accounted for a 54.5% significant reduction in retinal sensitivity. The reduction in retinal sensitivity was possibly due to neuronal damage which precedes visible fundus changes.
Ethical approvalEthical approval was obtained from Universiti Kebangsaan Malaysia Research and Ethics Committee (UKM 1.5.3.5/244/NN-118-2012) which follows the tenants of Helsinki. Written consent was obtained from all the participants.
FundingThis research received no specific grant from any funding agency in the public, commercial, or not for-profit sectors.
Conflicts of interestThe authors declare that they have no conflict of interest.
The authors wish to thank the ophthalmologists and staff of Selayang Hospital eye specialist clinic for their excellent cooperation during the study. We would also like to thank all participants for volunteering to be part of this study.


