


To evaluate the current evidence on oculomotor measurement parameters and their normative values through a systematic review.
MethodsA search of primary studies was conducted using a search equation with free language. Original articles analyzing normal oculomotor function parameters in healthy populations of any age, studies that included a clearly differentiated healthy control group, and articles using any oculomotor measurement test were included. The QUADAS-2 tool was used to assess the risk of bias, applicability, and quality of the studies. The review was conducted independently by the authors and then pooled to determine the final inclusion.
ResultsA total of 915 articles were identified, of which 750 were excluded after the first review of the title and abstract. In the second step, 133 out of 165 investigations were discarded. Ultimately, 32 articles from the initial search were included, along with 10 additional articles identified through a manual search. The findings revealed variations in how oculomotor skills are measured, including differences in stimuli, measurement distances, and parameters assessed. A high risk of bias was observed (≥50 % in the areas of “flow and timing”, “reference standard” and “patient selection”) along with poor applicability (≥50 % in all aspects).
ConclusionsThere is no clear evidence on normative values for oculomotor skills, nor is there a consensus on the measurement methods, stimulus used, or working distance. Furthermore, there is no agreement on which aspects of oculomotor skills should be assessed. To enhance reliability and applicability, measurement criteria should be standardized, and normative values should be established.
Oculomotor function refers to an individual’s innate ability to execute eye movements in a seamless, coordinated, and fluid manner, ensuring the maintenance of a clear, fused, and stable image on the central region of the retina. When an object is in motion, it is crucial to sustain this visual stability as the object moves. To achieve accurate oculomotor performance, three fundamental skills must be assessed: tracking movements, saccadic movements, and fixation movements. These skills should be well developed monocularly and must also be coordinated to ensure efficient oculomotor function.1
Oculomotor skills are currently being studied across various disciplines within the health sciences.2 Most research is focused on the neurological field, including schizophrenia,3 cognitive impairment,4 depression,5 biomarkers of neurodegenerative diseases,6 neurodevelopmental disorders,7 and even post-COVID conditions.8 Additionally, oculomotor skills play a crucial role in non-health-related fields, such as marketing9 or enabling individuals with amyotrophic lateral sclerosis to communicate using eye-tracking technology.10
In the field of optometry, oculomotor studies have grown over the past decade, largely due to advancements in eye-tracking technologies.11 Research has focused on various areas, including visual dysfunctions, strabismus, amblyopia, nystagmus, and visual impairment. Additionally, oculomotor studies have extended to vision-related fields such as refractive surgery, sports vision or driving vision.2,11,12
However, despite this exponential growth, concerns remain regarding the diagnostic methodology for oculomotor abnormalities. No clear range of normal values has been established for the parameters used to assess ocular motility, and no gold standard or reference test has been defined.13 Classical tests, such as the Developmental Eye Movement Test (DEM),14 the Northeastern State University College of Optometry (NSUCO) Oculomotor Test,15 and the King-Devick Test (K-D)16 have been used for many years. However, these tests have the disadvantage of being subjective for both the examiner and the patient. With the advent of new eye-tracking technologies, equipment has been developed to measure oculomotor parameters objectively. However, these systems vary in the parameters they assess, the psychophysics of measurement, the stimulus used, and the measurement distance.11–13
Research has been conducted to establish normative ranges for different subjective tests,14–16 as well as for some of the new technologies.17–20 However, there is still no scientific consensus regarding the psychophysics of measurement, the range of values, or the parameters to be assessed. This lack of standardization highlights the need for a unified approach to these aspects.
Therefore, the aim of this study is to evaluate the current evidence on oculomotor measurement parameters and their normative values through a systematic review.
MethodsThe study has been registered in the PROSPERO database. A comprehensive search was conducted using a search strategy (Supplementary Material) in three databases: PubMed, Web of Science, and Scopus. The search included all age groups and imposed no time restrictions to ensure that no relevant articles were overlooked. After the initial search, a refined selection of articles was made based on the following criteria:
Inclusion criteria- •
Original descriptive articles analyzing normal oculomotor parameters (pursuit, saccadic movements, fixation, saccadic velocity, and reading saccades) in a healthy population of any age.
- •
Originals comparative articles analyzing oculomotor parameters, whose design includes a well-defined control group not accomplishing inclusion criteria.
- •
Articles utilizing a subjective test currently used in the clinical practice such as NSUCO, DEM, ADEM, or K-D.
- •
Articles utilizing an objective test currently used in the clinical practice such as eye-tracker, or video-oculography.
- •
Case series, clinical case reports, and animal studies.
- •
Studies involving populations with neurological, developmental, or ocular pathologies that lack a well-defined control group or include fewer than 20 subjects.
- •
Methods employing stimuli different to standard geometrical shapes (dot, cross, square or similar) or related to language (numbers, letters).
- •
Methods providing non quantitative results such as graphs or interpretations.
- •
Samples where visual evaluations were performed diagnosing binocular anomalies, such as amblyopia and strabismus in its subjects.
The article selection process followed a sequential approach. First, titles and abstracts were reviewed to exclude irrelevant studies, and duplicates were removed. Second, full-text articles were examined, and only those that met the predefined inclusion criteria and addressed the research question were selected. Third, a manual search considering studies known by articles and reviewing references of included articles was conducted to identify additional references that might not have appeared in the initial search. Articles with control groups that did not clearly report results were excluded.
Finally, to assess the risk of bias, applicability, and quality of the studies, the QUADAS-2 tool was used. This tool is divided into domains that evaluate key aspects of each article, such as participant selection, index test, reference test, and the flow and timing of the study. Following the guidelines of the evaluation tool, the risk of bias was classified into three evidence level groups: studies with a low risk of bias, studies with an unclear risk of bias, and studies with a high risk of bias.
The article selection and the quality analysis using the QUADAS-2 procedure were performed blindly and independently by three investigators to ensure accurate classification of the included studies. In cases of discrepancies, a consensus was reached between the authors, with all three authors discussing and agreeing. (REF QUADAS-2 2011 Withing)
The initial literature search was conducted in February 2024, and the databases were reviewed again in September 2024 using the same methodology.
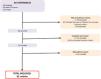
ResultsThe study selection process for this systematic review is illustrated in a flowchart in Fig. 1. Initially, 915 documents were retrieved during the search. After reviewing titles and abstracts and removing duplicates, 165 articles were selected for full-text evaluation. Of these, 133 were excluded for not meeting the inclusion criteria. Ultimately, 32 articles were included. Additionally, a manual search identified 6 more articles, bringing the total to 38 articles that were analyzed in this review.
Study characteristics
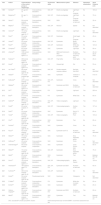
Table 1 presents the characteristics of the 38 included studies, which span from 1980 to 2023. The studies included sample sizes ranging from 20 to 2075 subjects. Of these, 22 studies (57.9 %) were descriptive cross-sectional, 15 studies (39.5 %) were comparative cross-sectional, and 1 study (2.6 %) was pseudo-experimental.
Characteristics of the 38 studies included in the review.
| Year | Author | Characteristics of the control group (n, ranged age) | Study design | Oculomotor skills | Measurments system | Stimulus | Optometric examination | Work Distance (cm) |
|---|---|---|---|---|---|---|---|---|
| 1980 | Schalen21 | 20, age 22–70 | Cross-sectional, descriptive | SAC, SP | Electro-oculography | Light Spot in computer | No | 160 cm |
| 1984 | Bergenius22 | 60, age 11–70 | Cross-sectional, descriptive | SAC, SP | Electro-oculography | Light Spot in computer | No | 70 cm |
| 1990 | Garzia14 | 534 normal subjects aged 6–13 | Cross-sectional, descriptive | SAC | DEM | Numbers on test card | No | 33 cm |
| 1992 | Maples15 | 1714 normal subjects aged 5–14 | Cross-sectional, descriptive | SAC, SP | NSUCO | Sphere | No | Not described |
| 1992 | Versino23 | 76 normal subjects aged 12–77 | Cross-sectional, descriptive | SAC | Electro-oculography | Light Spot | No | Not described |
| 1993 | Ross24 | 53 normal subjects aged 7–15 | Cross-sectional, descriptive | SAC, SP | Eyetracker | Small target in computer | No | 43 cm |
| 1997 | Litman25 | 24 normal subjects | Cross-sectional, comparative | SAC, SP | Eyetracker | Bright Square | No | 43 cm |
| 1997 | Ross26 | 25 normal subjects | Cross-sectional, comparative | SAC, SP | Eyetracker | White disc in screen | No | 120 cm |
| 1999 | Campana27 | 65 normal subjects | Cross-sectional, comparative | SAC | Eyetracker | Light Spot | No | 90 cm |
| 2003 | Jimenez28 | 1056 normal subjects aged 6–12 | Cross-sectional, descriptive | SAC | DEM and Scheiman & Wick | Numbers on test card and fixing point | Yes | 40 cm // 33 cm DEM |
| procedure | ||||||||
| 2006 | Rutsche18 | 358 normal subjects aged 0–6 | Cross-sectional, descriptive | SAC, SP | Pupil reflex | Color lights | Yes | 40 cm |
| 2007 | Aring29 | 135 normal subjects aged 4–15 | Cross-sectional, descriptive | FIX | Infrared light | Dot | Yes | 53 cm |
| 2010 | van Tritch30 | 28 normal subjects aged 15–35 | Cross-sectional, comparative | SAC, SP | Double magnetic | Red light laser spot | No | Not described |
| induction method | ||||||||
| 2011 | Goepel31 | 31 normal subjects age 7–12 | Cross-sectional, descriptive | SAC | Eyetracker | Cartoons in computer | No | 51,8 cm |
| 2011 | Kattoulas32 | 2075 normal subjects aged 18–25 | Cross-sectional, descriptive | SAC, SP, FIX | Eyetracker | Cross | No | Not described |
| 2011 | Webber33 | 59 normal subjects aged 9–10 | Cross-sectional, descriptive | SAC | Eyetracker and DEM | Numbers on test card | Yes | Not described |
| 2012 | Shi34 | 20 normal subjects aged 6–12 | Cross-sectional, comparative | FIX | Eyetracker | Light spot | Yes | 200 cm |
| 2012 | Boot35 | 213 normal subjects aged 0–12 | Cross-sectional, descriptive | FIX | Eyetracker | White Dots | No | 60 cm |
| 2015 | Seferlis36 | 250 normal subjects aged 18–70 | Cross-sectional, descriptive | SAC, SP, FIX | Video-oculography | Light spot | Yes | 170 cm |
| 2015 | Doettl37 | 62 normal subjects: 4–44 | Cross-sectional, comparative | SAC, SP | Videonystagmography | Snellen chart | Yes | 127 cm |
| 2016 | Zalla38 | 20 normal subjects | Cross-sectional, comparative | SAC | Eyetracker | Grid of 13 points | No | 60 cm |
| 2016 | Yang39 | 50 normal subjects aged 20–69 | Cross-sectional, descriptive | SAC, SP | Video-oculography | Point | No | 100 cm |
| 2017 | Choi40 | 63 normal subjects: aged 19–80 | Cross-sectional, comparative | SAC, FIX | Eyetracker | Text | No | 85 cm |
| 2017 | Ferreira41 | 31 normal subjects aged 18–45 | Cross-sectional, comparative | SAC | Eyetracker | Cross | No | 70 cm |
| 2018 | Rizzo42 | 42 normal subjects aged 19–52 | Cross-sectional, comparative | SAC | Eyetracker and K-D | Numbers on test card | No | Not described |
| 2018 | Wetzel43 | 75 normal subjects aged 21–53 | Cross-sectional, comparative | SAC | Eyetracker | Nine separated points | No | 75 cm |
| 2019 | Hoffmann44 | 40 normal subjects | Cross-sectional, comparative | SAC | Eyetracker | Circle | No | Not described |
| 2019 | Chehrehnegar45 | 59 normal subjects | Cross-sectional, comparative | SAC | Eyetracker | Cross (Simon task) | No | 60 cm |
| 2019 | Wetzel46 | 75 normal subjects aged 18–65 | Cross-sectional, comparative | SAC, SP | Eyetracker | Nine separated points | No | 75 cm |
| 2020 | Wertli47 | 25 normal subjects aged 10–11 | Cross-sectional, descriptive | SAC, FIX | Eyetracker | Text | Yes | Between 50 to 80 cm |
| 2020 | Sinno19 | 120 normal subjects aged 5–17 | Cross-sectional, descriptive | SAC, SP | Videonystagmography | White Square | No | 120 cm |
| 2021 | Hindmarsh48 | 196 subjects aged 7.3–8.9 | Cross-sectional, descriptive | SAC, SP, FIX | Eyetracker and DEM | Numbers on test card | Yes | 60 cm |
| 2021 | Kullmann49 | 466 normal subjects aged 18–45 | Cross-sectional, descriptive | SAC, SP | Eyetracker | Dot | No | Not described |
| 2021 | Amato50 | 54 normal subjects aged 18–28 | Pseudoexperimental | SAC | Eyetracker | Videogame | No | Not described |
| 2022 | D’Addio51 | 34 normal subjects | Cross-sectional, comparative | FIX | Eyetracker | White disc in screen | No | 65 cm |
| 2022 | Eichler52 | 52 normal subjects aged 9–34 | Cross-sectional, descriptive | SAC | Eyetracker | OMAT | Yes | 25 cm |
| 2023 | Orduna-Hospital53 | 52 normal subjects aged 18–30 | Cross-sectional, descriptive | SAC, FIX | Eyetracker and DEM | Numbers on test card | Yes | 60 cm |
| 2023 | Wertli54 | 118 normal subjects aged 7–12 | Cross-sectional, descriptive | SAC, FIX | Eyetracker | Text | Yes | Between 50 to 80 cm |
| SAC: saccadicSP: smooth pursuitsFIX: fixation | DEM: developmental eye movementOMAT: oculomotor assessment tool test | |||||||
Regarding oculomotor skills, 34 out of the 38 studies (89.5 %) addressed saccadic movements, 16 studies (42.1 %) focused on tracking movements, and 11 studies (28.9 %) investigated fixation movements. In terms of technology and measurement systems, a significant amount of variability was found, with classical tests such as the DEM test, NSUCO test, and electro-oculography in studies performed >30 years ago, alongside newer technologies, like eye trackers, video-oculography, and video-nystagmography in recent evidence. The stimuli used also varied widely, including letters, texts, reading tests, numbers, and monochromatic, colored, or illuminated Figs. It difficulted the stratified analysis by type test. Similar limitation was found for age because 18 of 38 studies (47.4 %) was performed exclusively in children but ones in babies and others in adolescents, 15 of 38 (39.5 %) were performed exclusively in adults, and 5 of 38 (13.2 %) was performed combining both population. Notably, only 12 of the 38 studies (31.6 %) conducted an optometric examination prior to the oculomotor assessment. Finally, regarding the working distance for measuring oculomotor values, variability was observed, ranging from 25 cm to 200 cm. It is important to note that 9 studies (23.7 %) did not specify the working distance, and 2 studies (5.3 %) provided a range but did not specify an exact value.
Oculomotor skills aspectsTable 2 presents the aspects of oculomotor skills measured for each parameter (saccadic, smooth pursuit, and fixation movements), extracted from the studies included in this systematic review. It is evident that there is considerable diversity in the parameters analyzed for each test. Additionally, it can be observed that most of these parameters are not analyzed in >20 % of the articles.
For saccadic movements, the most frequently analyzed parameters are the number of saccades (28.9 %), latency (28.9 %), velocity (21.1 %) and amplitude (21.1 %). In pursuits movements, the most commonly measured aspect is pursuit gain (26.3 %). Lastly, for fixation movements, the most frequently measured parameter is fixation time (23.7 %). In addition, authors did not find reported data on Bivariate Contour Ellipse Area (BCEA), a standard metric of fixation stability.
Other aspects were also measured by the authors of the included articles, such as Peak Velocity in saccadic movements, velocity in smooth pursuits and number of fixations in fixation movements. However, these aspects were measured less frequently, in fewer than 20 % of the articles.
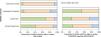
Assessment of quality and bias of included studiesTable 3 and Fig. 2 present the analysis of the 38 included studies using the QUADAS-2 tool, which evaluates the risk of bias and applicability. In general, it can be observed that there is a high risk of bias (≥50 % in the aspects of “flow and timing”, “reference standard” and “patient selection,” as well as poor applicability (≥50 %), across all aspects.
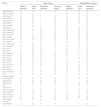
Quality rating of the 38 included studies in the systematic review (QUADAS-2 results) (☺: low risk; ☹: high risk; ?: unclear risk.).
| Study | Risk of bias | Applicability concerns | |||||
|---|---|---|---|---|---|---|---|
| Patient selection | Index test | Reference standard | Flow and timing | Patient selection | Index test | Reference standard | |
| 1980 Schalen21 | ☹ | ☹ | ? | ☺ | ☹ | ☹ | ☺ |
| 1984 Berginus22 | ☺ | ☺ | ? | ? | ☹ | ☹ | ☺ |
| 1990 Garzia14 | ☹ | ☺ | ? | ☺ | ☹ | ☹ | ☺ |
| 1992 Maples15 | ☹ | ☹ | ? | ☺ | ☹ | ☹ | ☺ |
| 1992 Versino23 | ☹ | ☺ | ? | ☹ | ☹ | ☹ | ☺ |
| 1993 Ross24 | ☹ | ☺ | ? | ☹ | ☹ | ☺ | ☺ |
| 1997 Litman25 | ☹ | ☹ | ? | ☹ | ☹ | ? | ☹ |
| 1997 Ross26 | ☹ | ? | ☹ | ☹ | ☹ | ☺ | ☹ |
| 1999 Campana27 | ☹ | ☺ | ☹ | ☹ | ☹ | ☹ | ☹ |
| 2003 Jimenez28 | ☺ | ? | ☺ | ☹ | ☺ | ☺ | ☺ |
| 2006 Rütsche18 | ☺ | ☺ | ☹ | ☹ | ☺ | ☹ | ☹ |
| 2007 Aring29 | ☺ | ☺ | ☹ | ☹ | ☺ | ☺ | ☺ |
| 2010 van Tritch30 | ☹ | ☹ | ☹ | ☹ | ☹ | ☹ | ☹ |
| 2011 Goepel31 | ☹ | ? | ☹ | ☹ | ☹ | ☹ | ☹ |
| 2011 Kattoulas32 | ? | ☺ | ☹ | ☹ | ? | ☺ | ☺ |
| 2011 Webber33 | ☺ | ☺ | ☺ | ☹ | ☺ | ☺ | ☺ |
| 2012 Shi34 | ? | ☺ | ☹ | ? | ☺ | ? | ☹ |
| 2012 Boot35 | ☺ | ☺ | ☹ | ☹ | ☺ | ? | ☹ |
| 2015 Seferlis36 | ☺ | ☺ | ☹ | ☹ | ☺ | ☺ | ☺ |
| 2015 Doettl37 | ☺ | ☺ | ☹ | ☹ | ? | ? | ☹ |
| 2016 Zalla38 | ☹ | ☺ | ☹ | ☹ | ? | ☹ | ☹ |
| 2016 Yang39 | ☹ | ☺ | ☹ | ☹ | ☹ | ? | ☺ |
| 2017 Choi40 | ☹ | ☹ | ☹ | ☹ | ☹ | ☹ | ☹ |
| 2017 Ferreira41 | ☹ | ☹ | ☹ | ☹ | ☹ | ☹ | ☹ |
| 2018 Rizzo42 | ? | ☺ | ? | ☹ | ☹ | ☹ | ☹ |
| 2018 Wetzel43 | ☹ | ☺ | ☹ | ☹ | ☹ | ☹ | ☹ |
| 2019 Hoffman44 | ☹ | ☺ | ☹ | ☹ | ☹ | ☹ | ☹ |
| 2019 Chehrehnegar45 | ☹ | ☺ | ☹ | ☹ | ☹ | ☹ | ☹ |
| 2019 Wetzel46 | ☹ | ☺ | ☹ | ☹ | ? | ☹ | ☹ |
| 2020 Wertli47 | ☺ | ☺ | ☹ | ☹ | ? | ? | ☺ |
| 2020 Sinno19 | ☺ | ☺ | ☹ | ☹ | ☺ | ☺ | ☺ |
| 2021 Hindmarsh48 | ☺ | ☺ | ☺ | ☹ | ? | ☺ | ☺ |
| 2021 Kullman49 | ☺ | ☺ | ☹ | ☹ | ? | ☺ | ☺ |
| 2021 Amato50 | ☹ | ☹ | ☹ | ☹ | ☹ | ☹ | ☹ |
| 2022 D’Addio51 | ☹ | ☹ | ☹ | ☹ | ☹ | ☹ | ☹ |
| 2022 Eichler52 | ☺ | ☺ | ☹ | ☹ | ☺ | ☺ | ☺ |
| 2023 Orduna-Hospital53 | ☺ | ☺ | ☺ | ☹ | ☺ | ? | ☺ |
| 2023 Wertli54 | ☺ | ☺ | ☹ | ☹ | ? | ? | ☺ |

Oculomotor function has gained increasing relevance in recent years. In fact, more than half of the studies analyzed in this review (20 out of 38; 52.6 %) have been conducted in the last decade.19,36–54
Firstly, the technology used to measure oculomotor function has advanced considerably. Early studies relied on electrooculography and subjective assessments, whereas more recent research utilizes eye-tracking systems and video-nystagmography (Table 1). This shift suggests a notable improvement in the quantitative analysis of ocular motor skills. Secondly, it is now demonstrated that oculomotor disturbances may be present in some systemic conditions, such as neurological diseases3-6,50 or development disorders.7 Despite current devices seeming to measure oculomotor function in a better way, it is not completely demonstrated because there is a great methodological variability between studies in terms of the type of stimulus, the complexity of the task, the working distance, and even the analyzed parameters. Such variability precludes direct comparison of measurements across different systems and constrains the ability to perform agreement analyses between devices. Consequently, there are very few studies comparing subjective methods (DEM, K-D, NSUCO) with objective methods based on eyetrackers,33,42,48 and even fewer comparing several objective methods with one another. Not only are comparisons between devices not adequately developed in scientific literature, but also the validation with a single device is also insufficient because typically only one measurement is taken for each subject, preventing the development of repeatability analysis. In fact, only the DEM14 and NSUCO15 techniques have been thoroughly validated by measuring twice for each subject and calculating intrasession repeatability. The impossibility of generalizing the results is also supported by the study design and population. Oculomotor function is highly age-dependent,14,15,18,19,32,36,55 and there are multiple studies involving adults, children or both. In contrast, almost half of the studies analyzed in this paper (15 of 38 studies; 39.5 %)25–27,30,34,37,38,40–46,51 are cross-sectional with comparative design incorporating a control group whose ocular movements are compared to those obtained by a specific group with a particular condition or disorder. This involves selecting the control group based on the study group’s characteristics, inducing a patient selection bias that prevents the results from being generalized to the broader population. Another finding observed in this systematic review, potentially affecting the inference process, is the lack of an optometric evaluation in the majority of studies (26 of 38 studies; 68.4 %).14,15,19,21–27,30–32,35,38–46,49–51 Among 12 articles that conducted previous eye tests,18,28,29,33,34,36,37,47,48,52–54 only one study performed a comprehensive optometric examination evaluating accommodation, vergences, and stereopsis.53 Eight articles conducted some accommodative and binocular tests, but these were insufficient for the purposes of this study,18,28,29,33,47,48,52,54 and the other three articles only included VA measures.34,36,37 It represents a very remarkable limitation of the current evidence because an evaluation of refraction, accommodation and vergences would be elementary in this topic as indicated Cacho-Martínez et al. (2024 Cacho-Martínez) Moreover, difficulty in focusing or maintaining single (haplopic) vision is related to the efficiency of fixations and saccades. Therefore, a prior optometric examination is important to detect binocular or accommodative dysfunctions that may affect oculomotor performance (REF 2022, Liu Z)
It is reported that oculomotor function is impaired in individuals with amblyopia56 and strabismus,57 affecting both the dominant and amblyopic eye.58 Additionally, monocular and binocular oculomotor skills differ.59 In cases of convergence insufficiency, alterations in reading saccades are also observed.60 Difficulties in near vision due to accommodative issues and/or uncorrected refractive errors may also contribute to oculomotor dysfunction, as suggested by Liu et al.61 Therefore, a comprehensive visual examination that includes binocular, accommodative, and sensory assessments is necessary to rule out the presence of amblyopia, strabismus, non-strabismic binocular dysfunctions, and oculomotor dysfunctions. Such an approach would reduce the number of visual variables that interfere with measurement and facilitate the establishment of normative oculomotor parameters. It is also essential to measure monocular and binocular visual acuity at both distance and near. Furthermore, it should be noted that the presence of strabismus can result in a number of abnormalities across numerous brain areas involved in visual functions and eye movements.62,63 Indeed, not all eye tracker software is designed for the precise measurement of strabismus. Some software merely detects the initial position of the eyes during calibration, without the capability to distinguish whether the eyes are aligned or if strabismus is present. Considering that oculomotor function is altered when patients do not use the best optical correction or have other visual anomalies,64 the low rate of studies including an optometric evaluation in their sample represents an important limitation (2024 Cacho-Martínez). Other potential biases and applicability concerns have been analyzed in this paper using the QUADAS-2 tool (Table 3, Fig. 2).
Regarding the methods used to measure oculomotor function in the articles included in this systematic review, Table 1 highlights the presence of various stimuli, measurement distances, technologies, and types of visual tasks. Starting with the stimuli employed, a wide range of tests was used, including classic tests such as DEM, NSUCO, K-D, or reading a text, as well as the use of computers to project points, shapes, letters, or cartoons, and even a video game or the OculoMotor Assessment Tool (OMAT). This variety of stimuli, differing in shape, size, color, and cognitive processing difficulty, represents a limitation when attempting to compare them. In fact, the cognitive processes required to follow a moving point differ significantly from those involved in reading text, numbers, or shapes, and are distinct from observing drawings or playing a video game.12 Therefore, this variability constitutes a critical factor when measuring oculomotor function.
During the measurement process, attention loss due to the appearance of another stimulus or, in the case of computers or screens, the presence of additional objects can influence the results. Similarly, the working distance is another limitation. As shown in Table 1, four studies (10.5 %) performed measurements at a near distance (≤ 40 cm),14,18,28,52 18 studies (47.4 %) at an intermediate distance (between 40 and 100 cm),22,24,25,27,29,31,35,38,40,41,43,45–48,51,53,54 seven studies (18.4 %) at a medium-far distance (≥100 cm),19,21,24,34,36,37,39 and nine studies (23.7 %) did not specify the working distance.15,23,30,32,33,42,44,49,50 Although no gold standard exists for the working distance, it can affect the accuracy of eye movement recordings. While it is true that the eye's angular orientation relative to the stimulus is key—and at different distances but the same angular orientation, the eyes should theoretically behave similarly in their movement—factors such as peripheral vision capacity or the limitation of specific ocular muscles may affect the measurement. At greater distances, these factors could introduce errors. These errors are due to the interaction between the accommodative and vergence system,65,66 and it has been shown in scientific literature that variation in working distance produces variation in the accommodative and vergence system.67
Regarding the technology used, there has been significant progress from the early methods, such as electrooculography (an invasive technique), to the development of video nystagmography, video oculography, and the most widely used technology: eye trackers. The use of eye trackers in studies has grown exponentially, particularly in the optometric field, enabling more precise and objective measurements of oculomotor function. However, it is essential to consider that each technology differs in its stimuli, working distances, and limitations, complicating comparisons between studies due to the lack of a gold standard for measurement.
Other factors that may influence results include the ergonomics of the measurement systems. Modern systems, such as eye trackers or video-oculographs, exhibit considerable variability, including trial frames with side-mounted cameras, helmets, virtual reality glasses, and bars placed on computer screens. Additionally, some devices are not commercially available but are laboratory prototypes or optical bench setups. Establishing unified ergonomic criteria would be beneficial.
During the evaluation of oculomotor function, it is essential to consider the subject's age. Scientific literature has demonstrated that oculomotor function varies with age, and studies that propose normative values present results based on age.19,47–49,52–54 Research suggests that oculomotor performance improves during the early years of life (approximately from 4 to 15 years)68–70 and subsequently declines.55,70,71 Another critical aspect to consider is the subject's cognitive level. Neurodevelopmental disorders,72,73 neurological diseases,74,75 or, as mentioned earlier, age—particularly in early childhood and older adulthood—can significantly influence the measurements.
Furthermore, maintaining the subject's attention is crucial. Oculomotor measurements typically last between 30 s and 5 min, and any loss of attention during the evaluation can lead to inconsistent or unreliable results. Similarly, fatigue and exhaustion during the test—especially in lengthy, tedious evaluations involving complex stimuli or requiring high cognitive demand—can introduce biases into the measurements.76 A clear parallel can be observed in visual field testing, where efforts have been made for years to shorten the test duration to mitigate these biases.
All these factors—age, cognitive level, attention, fatigue, and exhaustion—must be carefully considered when establishing a gold standard for oculomotor function measurement. Unified criteria should be defined to ensure consistency and reliability in the evaluation process.
Following the identification of methodological considerations frequently neglected in the literature and warranting careful attention, it is equally imperative to undertake a critical appraisal of the overall quality and methodological rigor of the included studies. In this systematic review, this analysis was conducted using the QUADAS-2 tool (Table 3, Fig. 2), which demonstrated a high incidence of studies with significant risks of bias and important limitations regarding applicability concerns. In particular, the most common risk of bias is related to reference standards, as only 4 out of 38 studies (10.5 %)28,33,48,53 compare the test under study with a gold standard technique or at least other independent method capable of measuring similar parameters of oculomotor function. This lack of comparison prevents validation of the measurements due to the impossibility of performing an agreement analysis. Similarly, flow and timing are also highly affected by a high risk of bias in almost all studies, with only 3 out of 38 studies (7.9 %)14,15,21 being free of this type of bias. The bias was generally caused by the predominance of single measurements per device, which prevents repeatability analysis. This finding further contributes to the generation of non-validated measurements that cannot be used as normative values.
Patient selection is another significant source of bias present in most studies, as many included subjects with highly specific characteristics–for example, only highly educated individuals40 or only students50–limiting extrapolation to the general population. Additionally, the selection of normal subjects was often influenced by the demographics and characteristics of other study groups involved in comparative studies. Therefore, recruitment in these comparative studies is not randomized. Furthermore, comparative studies often attempt to match ages between groups, leading to significant heterogeneity among control groups depending on the nature of the study.
On the other hand, it is important to highlight the higher-quality results regarding measurement methodology or index test in the current review, as 27 out of 38 studies (71.1 %) provide a complete description of the procedure.14,18,19,22–24,27,29,32–39,42–49,52–54 However, despite an accurate description of the measurement process, technology, and tasks, in some cases, the methodology remains difficult to replicate, affecting its applicability. This limitation is primary due to the use of outdated technology,21–23 implementation of subjective tests,15 non-standardized texts that introduce cognitive and educational dependencies,40,54 and highly complex tests that are difficult to replicate, such as the Convirt Test50 or OMAT Test.52
Applicability concerns are further compounded by unclear or questionable inclusion criteria for subjects, as well as the lack of proper characterization of measurements, leading to data that do not contribute to establishing normative values.
Regarding the limitations of the present study, the scarcity of specific articles evaluating normative values must be noted, as most studies focus on comparative or interventional approaches rather than the characterization of oculomotor function. Additionally, intrinsic limitations of the current tools used to assess study quality may lead to incomplete considerations or misinterpretations, even though QUADAS-2 remains the most appropriate tool for the objectives of this investigation. Because of these limitations a unique standardization of oculomotor measurements is currently not possible. Future studies should be conducted to propose a preliminary oculomotor protocol by an expert committee which should be validated in different sample characteristics.
On the other hand, key strengths of this study include its innovative and applicable focus, emphasizing the need to establish normative values. Moreover, the development and analysis of the procedure were conducted independently by three investigators, with a final consensus to enhance the evaluation of the current evidence.
ConclusionBased on these findings, this systematic review concludes that there is no clear evidence on normative values for oculomotor skills, nor is there a consensus on the measurement methods, stimuli used, or working distances. Furthermore, there is no agreement on which specific aspects of oculomotor skills should be assessed, and due to the quality evaluation of these studies, the risk of bias remains predominantly high.
Additionally, it is concerning that the vast majority of studies do not include a comprehensive optometric assessment – incorporating refractive, accommodative, and binocular tests – which may introduce bias in the results. To enhance reliability and applicability, measurement criteria should be standardized, and normative values should be established.
The authors have no conflicts of interest to declare.
No funding.


