


To assess the association between ethnicity and self-reported refractive errors (REs) among Peruvian children aged 7–11 years.
Materials and methodsWe conducted a cross-sectional study incorporating a secondary data analysis of 2017–2021 data from the Peruvian Demographic and Health Survey (DHS). REs and ethnicity were obtained from focal child's mother's report. Four outcomes were assessed: hyperopia, myopia, astigmatism and any RE. We included potential confounders, such as age, sex, wealth index, area of residence, region of origin, frequency of watching TV and watching screens at less than 30 cm distance. Generalised linear models with the Poisson family and log link function were used to calculate crude prevalence ratio and adjusted prevalence ratio (aPR) with 95% confidence intervals (95% CI).
ResultsData from a total of 52,753 children were included. The prevalence of RE in children aged 7–11 years was 10.90% (95% CI 10.49–11.33), of which 5.19% were hyperopia, 3.35% myopia and 2.36% astigmatism. Those of the Aymara ethnicity were less likely to suffer from any RE and astigmatism (aPR = 0.68, 95% CI 0.46–0.99, p = 0.046; aPR = 0.70, 95% CI 0.53–0.92, p = 0.012, respectively), Members of Amazon groups were more likely to have hyperopia (aPR = 1.95, 95% CI 1.14–3.36, p = 0.015) and Quechuas were more likely to have myopia (aPR =1.29, 95% CI 1.02–1.62, p = 0.028), where all were compared to Mestizos.
ConclusionAbout 1 in 10 Peruvian children suffer from a RE. The most frequent RE in this study was hyperopia. Ethnic differences were seen in the frequency of RE.
An important cause of visual impairment in children is refractive errors (REs).1 Early correction of RE is important. In 2020, undercorrected RE accounted for 2.3 million cases of blindness and 86.1 million cases of moderate and severe visual impairment worldwide.2 The upward trend in REs has generated global public health concerns. However, the growth in REs is determined by several factors.
Several factors are associated with RE.3,4 Genetics seems to pay a key role in their development.5 In the Americas, astigmatism and hyperopia are the REs that have highest prevalence, while in the Western Pacific, myopia is more common. The region with the lowest prevalence of REs is Southeast Asia,6 suggesting a genetic factor or ethnicity-related differences in prevalence. Studies in the US, Malaysia and Singapore, for example, showed differences in the prevalence of RE according to ethnicity.7,8
Peru is a multicultural and pluricultural country9,10 whose ethnic diversity is derived from immigration and economic booms and busts. However, indigenous groups in Peru are economically disadvantaged and encounter more barriers to reach health services than other groups.11 Studies of REs in the Peruvian population are lacking. Knowledge of ethnic patterns of REs is necessary to develop and implement targeted health policies. Our study preliminarily assessed the association between ethnicity and self-reported REs in Peruvian children aged 7–11 years.
Materials and methodsStudy design, population and selection criteriaWe carried out a repeated analytical cross-sectional study in a secondary data analysis of the results of the 2017–2021 Peruvian Demographic and Health Surveys (DHSs); this survey is conducted annually by the National Institute of Statistics and Informatics (INEI in the Spanish acronym). Using a probabilistic, stratified, multistage and independent sampling design, this survey achieves national, regional and area of residence representativeness. Further details of the survey are described elsewhere.12 Our study included children aged 7–11 years for whom answers were provided to questions related to the variables of interest. By 6 years of age, most children have completed the emmetropisation process,13,14 leading to the choice of age range in our Peruvian study population.
Refractive errorsTo measure RE, we took the positive answers that the mothers of the participants made to the first two of the following questions regarding their children and a concrete answer to the third. (1) ‘Has (NAME) ever in his/her life, doctor or other health personnel evaluated or measured his vision with this card [Snellen chart]?’ (2) ‘Has (NAME) been diagnosed with a vision problem, and has the use of glasses or lenses been indicated?’ (3) ‘What vision problem has (NAME) been diagnosed with?’ Children whose mothers reported hyperopia, myopia, or astigmatism to the third question were considered to have a RE. Four outcomes were assessed: hyperopia, myopia, astigmatism and any RE. As noted by Cumberland PM and Breslin KMM, self-reports of RE are largely accurate and useful, especially for the purposes of large-scale population-based studies.15,16
EthnicityEthnicity was measured with the following question: ‘Due to your customs and your ancestors, do you feel or consider yourself…?’ with the possible answers provided of Mestizo, Quechua, Aymara, Native of the Amazon, Afro-Peruvian, White and Other.
CovariatesSeveral potential confounders were selected using an epidemiological criterion through the construction of a direct acyclic gram. We included age (7–11 years), sex (male, female), wealth index (very poor, poor, middle, rich, very rich), area of residence (urban, rural), region of origin (Lima metropolitan, rest of the coast, highlands and jungle), frequency of watching TV (never, from time to time, once a week, almost every day) and frequency of watching screens (TV, computer, or laptop) at a distance of less than 30 cm (yes, no, do not watch).
Statistical analysisStatistical analysis was performed in STATA® v16.0 (STATA Corporation, College Station, Texas, USA) using the svy command module for a complex-design survey. Categorical variables were described using proportions, while the ages of the participants were described using means and standard deviations (SDs). To assess differences in the prevalence of RE according to ethnicity, we employed the chi-squared test. We performed generalised linear models in the Poisson family and the log link functions to calculate crude (cPR) and adjusted (aPR) prevalence ratios. All covariates were considered to be confounders and were entered into the adjusted regression models. Four adjusted models were constructed to assess the outcomes presented above. Confidence intervals were computed to 95% (95% CI), and p-values less than 0.05 were considered statistically significant.
Ethical considerationsInformed consent was obtained at the beginning of each interview, and the database provides only anonymised participant identity. The database is available in the public domain and free of charge on the INEI website, as ‘Microdatos’ (https://proyectos.inei.gob.pe/microdatos/). Our study thus did not require the approval of an ethics committee because it is an analysis of secondary data.
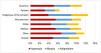
ResultsCharacteristics of the populationData from a total of 52,753 children aged 7–11 years were obtained from the 2017–2021 DHS databases. The mean age was 8.98 (SD 1.41) years, most were males (51.12%), and the majority resided in an urban area (67.22%). In addition, 54% reported watching television almost every day, and 27.21% reported doing so at a distance of less than 30 cm from the screen (Table 1). The prevalence of RE in children aged 7–11 years was 10.90% (95% CI 10.49–11.33%), of which 5.19% were diagnosed with hyperopia, 3.35% with myopia, and 2.36% with astigmatism (Fig. 1).
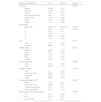
Sociodemographic characteristics of Peruvian children aged 7–11 years and the prevalence of refractive errors.
| Baseline characteristics | (%) | RE (%) | p-valuea | |
|---|---|---|---|---|
| Ethnicity | 0.0679 | |||
| Mestizo | 45.48 | 11.01 | ||
| Quechua | 31.59 | 11.18 | ||
| Aymara | 1.90 | 6.27 | ||
| Native of the Amazon | 2.01 | 12.47 | ||
| Afro-Peruvian | 10.58 | 10.96 | ||
| White | 6.98 | 10.96 | ||
| Others | 1.44 | 10.47 | ||
| Age (years) | ||||
| Mean (SD) | 8.98 (1.41) | 9.35 (1.18) | <0.0001b | |
| 7 | 20.34 | 6.54 | <0.0001 | |
| 8 | 20.27 | 9.14 | ||
| 9 | 19.49 | 11.4 | ||
| 10 | 20.29 | 12.78 | ||
| 11 | 19.6 | 14.82 | ||
| Sex | 0.0116 | |||
| Male | 51.12 | 10.41 | ||
| Female | 48.88 | 11.42 | ||
| Wealth index | 0.2821 | |||
| Poorest | 29.48 | 11.05 | ||
| Poor | 22.5 | 10.13 | ||
| Middle | 19.63 | 11.19 | ||
| Rich | 15.8 | 10.86 | ||
| Richest | 12.59 | 11.56 | ||
| Area of residence | 0.5356 | |||
| Urban | 67.22 | 10.86 | ||
| Rural | 32.78 | 11.15 | ||
| Region of origin | <0.0001 | |||
| Lima | 19 | 13.07 | ||
| Rest of the coast | 26.82 | 10.53 | ||
| Highlands | 33.95 | 10.16 | ||
| Jungle | 20.23 | 10.63 | ||
| Frequency of watching TV | 0.0031 | |||
| Never | 11.13 | 9.02 | ||
| From time to time | 29.99 | 10.4 | ||
| At least once a week | 4.75 | 10.15 | ||
| Almost every day | 54.12 | 11.49 | ||
| Watching screens less than 30 cm. | <0.0001 | |||
| Yes | 27.21 | 14.86 | ||
| No | 69.76 | 9.72 | ||
| Do not watch | 3.03 | 2.53 | ||
All proportions were weighted.

A doctor or other health personnel had evaluated or measured the vision of 33.73%. Of these, most reported that their evaluation was less than 2 years ago (73.32%), and they were evaluated at a hospital (23.04%), medical posts (20.75%), a private clinic (24.10%), optician's shop (8.02%), medical campaigns (21.60%) and at another venue (2.48%).
Bivariate analysisNo statistically significant association was seen between the prevalence of RE and ethnicity in Peruvian children aged 7–11 years (p = 0.0679). The greatest prevalence of any RE was found in Natives of the Amazon, and the lowest prevalence of any RE was found among the Aymara. The following covariates were associated with having any RE: age, sex, region of origin, frequency of watching TV and watching screens from less than 30 cm (Table 1).
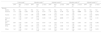
Multiple regressionAymara was associated with a 32% and 30% lower probability of suffering from any RE and from astigmatism, respectively (aPR = 0.68, 95% CI 0.46–0.99, p = 0.046; aPR = 0.70, 95% CI 0.53–0.92, p = 0.012). Moreover, Natives of the Amazon were more likely to have hyperopia than Mestizos (aPR = 1.95, 95% CI 1.14–3.36, p = 0.015). Additionally, being Quechua was associated with a 29% greater probability of having myopia than being Mestizo (aPR =1.29, 95% CI 1.02–1.62, p = 0.028) (Table 2).
Association between ethnicity and self-reported refractive errors in Peruvian children aged 7–11 years.
| Crude model 1 | Adjusted model I 1 | Adjusted model II 2 | Adjusted model III 3 | Adjusted model IV 4 | ||||||||||||
|---|---|---|---|---|---|---|---|---|---|---|---|---|---|---|---|---|
| cPRa | 95% CIb | p-value | aPRc | 95% CIb | p-value | aPRc | 95% CIb | p-value | aPRc | 95% CIb | p-value | aPRc | 95% CIb | p-value | ||
| Ethnicity | ||||||||||||||||
| Mestizo | Ref. | Ref. | Ref. | Ref. | Ref. | Ref. | Ref. | Ref. | Ref. | Ref. | Ref. | Ref. | Ref. | Ref. | Ref. | |
| Quechua | 1.16 | 0.88–1.54 | 0.283 | 0.93 | 0.79–1.08 | 0.370 | 1.16 | 0.95–1.43 | 0.136 | 1.29 | 1.02–1.62 | 0.028 | 1.07 | 0.96–1.19 | 0.180 | |
| Aymara | 0.79 | 0.35–1.79 | 0.579 | 0.68 | 0.46–0.99 | 0.046 | 0.76 | 0.43–1.33 | 0.339 | 0.63 | 0.33– 1.21 | 0.173 | 0.70 | 0.53–0.92 | 0.012 | |
| Native of the Amazon | 0.81 | 0.38–1.73 | 0.597 | 0.67 | 0.42–1.06 | 0.093 | 1.95 | 1.14–3.36 | 0.015 | 1.77 | 0.96–3.27 | 0.066 | 1.22 | 0.91–1.64 | 0.181 | |
| Afro-Peruvian | 0.89 | 0.60–1.32 | 0.591 | 1.01 | 0.84–1.22 | 0.837 | 1.20 | 0.93–1.55 | 0.153 | 0.92 | 0.65–1.30 | 0.663 | 1.05 | 0.92–1.20 | 0.398 | |
| White | 0.92 | 0.52–1.66 | 0.806 | 0.80 | 0.63–1.01 | 0.065 | 0.94 | 0.70–1.26 | 0.688 | 1.18 | 0.83–1.68 | 0.340 | 0.92 | 0.78–1.08 | 0.314 | |
| Others | 1.42 | 0.48–4.15 | 0.521 | 1.25 | 0.78–1.99 | 0.340 | 0.85 | 0.50–1.47 | 0.580 | 0.67 | 0.34–1.31 | 0.246 | 1.03 | 0.74–1.41 | 0.853 | |
Our main results, after adjustment for multiple confounders, indicate variations in the frequency of self-reported RE in children according to ethnicity. The frequency of self-reported RE was seen in 10 out of 100 children, with hyperopia being more frequent. Relative to Mestizos, individuals of the Aymara ethnicity were less likely to have a RE or astigmatism, while Natives of the Amazon were more likely to self-report hyperopia and those of Quechua ethnicity were more likely to report myopia.
Comparison with previous studiesAlthough, to the best of our knowledge, no studies of self-reported RE in children have been published, another studies using direct assessments for the diagnosis of REs, such as cycloplegic refraction, were assessed in a systematic review; this publication found that astigmatism was the most commonly reported RE in children. with 14.9% of cases, followed by myopia and hyperopia in 11.7% and 4.6% of cases, respectively.6 These differences from our figures can be explained by regional variations in the prevalence of RE. Another systematic review found that the age and region-standardised prevalence of uncorrected pediatric RE were 5.85 for every 1000 US children, 4.40 for every 1000 in the Eastern Mediterranean region, 3.41 for every 1000 in the Western Pacific region, and 2.26 for every 1000 in the Southeast Asian region.17 While it has been suggested that environmental factors are responsible for these differences, it is likely that genetic and ethnic factors are more important.6
Ethnic differences in ocular anatomy could increase the probability of RE. An investigation in the United States found that Asian, Hispanic, African American and Native American children had greater corneal toricity, with a markedly flatter horizontal corneal power relative to white children. They also had shallower anterior chambers and longer vitreous chambers.18 Another study in Australia found that axial length accounted for a greater proportion of the variation in refraction in East Asian children than in European-Caucasian children (68% vs. 24%, respectively).19 To the best of our knowledge, no studies have been conducted regarding ethnic differences in ocular structure in the native peoples of Peru for comparison with our study.
Plausibility of the findingsThe association between RE and ethnicity has been previously identified in several populations.7,8 This linkage can be explained by genetics, as potential candidate genes for RE have recently been described.5 However, studies of this topic in Latin American countries are lacking, making it difficult to compare our results, as the native peoples of Peru have a unique genetic heritage, stemming from a mixture of certain ancestral populations.20
The Aymara people are among the most important ethnical groups in Peru. In the 2017 national census results, 548,311 people self-identified as Aymara. The Aymara mainly live in six provinces of Puno and in some rural districts of Moquegua and Tacna, as well as in Bolivia and Chile.21 Likewise, according to the INEI, Amazonian indigenous communities speak languages of 13 linguistic families; these communities, are grouped into 60 ethnic groups, mostly distributed in the department of Loreto.22 Finally, the Quechua people are the largest indigenous population group in Peru and live mainly in the Peruvian highlands and in neighbouring countries, such Bolivia and Ecuador.21
Other studies have also suggested ethnic variations in the frequency of RE. A Chinese study found that the prevalence of myopia was lower in patients of the Dai, Hani and Buyi ethnicities than in Han patients.23 The authors of that study suggested that this may be due to the smaller number of participants of some ethnicities in their research, together with regional variations in lighting that could affect the prevalence of myopia.23 Some theories suggest that time spent outdoors could have a protective effect against myopia through increased light exposure; greater amounts of dopamine released from the retina, and increased exercise of the depth of field. However, no clear mechanism has been identified,3,24 although these theories could explain differences in the prevalence of RE among different ethnic groups in Peru.
Variations in incidence of RE with sociodemographic factors have been found, and the frequency of such factors in Peruvian ethnic minority populations could also explain the ethnic differences. For example, a study conducted in 42 countries found that children in urban settings are 2.6 times more likely to have myopia than those in rural settings.25 Poverty also influences the prevalence of RE. A systematic review showed that homeless individuals had a higher prevalence of RE than the general population.26 In Peru, the majority of Quechua, Aymara, and other minority linguistic populations tend to live in rural environments to a greater degree than whites or Mestizos.27 Similarly, taking into consideration the lineal method of total poverty, uses the cost of homes per capita to measure poverty, where 321 soles per capita monthly was the minimum required to meet dietary and non-dietary necessities for those having Spanish as their native tongue and living in an urban area. This value diminished to 234 soles for those who declared that Spanish was their native tongue but lived in the rural area, 263 soles for those who spoke Quechua or Aymara; and 232 soles for members of Native Amazonian groups.27 To address confounding, several of these variables were adjusted in the multiple regression models.
Ethnic differences in the prevalence of RE may be related to disparities in access to healthcare services, which in turn could be due to remoteness of location, discrimination, mistreatment and language boundaries.10,28,29 Moreover, the access to and utilization of eye care services in lower socioeconomic status constituted a neglected public concern. Therefore, as discussed previously, the vast majority of members of ethnic minority groups have a low socioeconomic status, which forms a barrier to the access to and utilization of eye care services.30 Further studies are needed in this topic to check this conclusion.
Limitations and strengthsOur study had certain limitations. First, only children who had received a visual assessment could be included in this study. There may be children who needed attention to their eyes but have not received it due to the structural problems of the Peruvian health care system and their impact on ethnic minorities.11 Second, although self-reporting is a valid method for large-scale, population-based studies such as ours,15 a lack of a standardised diagnostic method makes it possible that cases of RE were underestimated. Third, due to the cross-sectional design of the study, it was not possible to establish causality. Owing to the nature of the outcome and exposure variables, reverse causality could not be ascertained. Fourth, several variables that may influence the prevalence of RE (viz., potential confounders) were not evaluated, as we were limited to the variables assessed in the Peruvian DHS. Nevertheless, regardless of the limitations of our study, it was, to the best of our knowledge, the first to gather preliminary evidence of the vision health assessment in Peruvian children as an early step in conducting studies to provide an in-depth understanding of the association between RE and ethnicity. In addition, its large population sample ensures good statistical power.
Public health implicationsREs can cause symptoms such as of blurriness, phantom vision, headaches and asthenopia, and it can also have a negative impact on visual performance, which in turn, has a negative impact on school performance.31,32 In Peru, despite significant improvements in basic education coverage, disparities in learning achievement remain that affect the most disadvantaged. The percentage of second grade students achieving satisfactory performance in reading comprehension in 2016 was 50.9% in urban areas, compared to only 16.5% in rural areas, where most members of Peruvian ethnic minorities reside.33 It is thus necessary to replicate successful programmes in rural areas of Peru for the early diagnosis of RE,34,35 as this type of strategy has been shown to be cost-effective in other health systems.36
Vision health in Peru is neglected, as most participants report that they have not received any vision assessment by health professionals. Public policymakers must implement targeted interventions with an integrative, comprehensive and inclusive approach to address problems in vision health of all Peruvian ethnic groups. In this way, the management of RE could be optimised, from an early age, which is even more essential in a middle-income country, whose scarce health resources must be harnessed to organize the fragmented and segmented health system.37,38
Additional studies are required to identify potential genes agents that may explain the prevalence of each type of RE among Peruvian ethnic groups. Genetic evidence confirms that REs are influenced by both common and rare genetic variants with a significant environmental component.5,39 In addition, the genetic factors that control circadian rhythms and pigmentation are also involved. However, studies of genetic variations in REs have largely been conducted in patients with myopia and in white patients39; efforts must be made to determine possible genetic variations in minority groups.
ConclusionThe frequency of self-reported REs in Peruvian children aged 7 to 11 years old was 10.90%. Being Aymara was inversely associated with certain types of self-reported REs and astigmatism, while being native Amazonian was inversely associated with self-reported hyperopia, and being Quechua was positively associated with self-reported myopia. Targeted interventions with an integrative, comprehensive and inclusive approach are key to addressing the visual health problems of all ethnic groups of Peru.
None.
Financial support: This research did not receive any specific grant from funding agencies in the public, commercial, or not-for-profit sectors.


