


This study aimed to assess the efficacy of two formulations of lubricant eye drops, containing a gelling agent or not, compared to normal saline. This was a prospective, randomized, double-blinded, three-group, parallel, interventional single-site clinical study.
MethodsForty-five Gazan participants with moderate to severe dry eye disease (DED) were randomized into three groups of 15 participants each. Each group received either normal saline eye drops or lubricant eye drops. For each group, one drop was applied three times a day for six weeks. All participants applied the normal saline solution for the first week. The outcomes assessed were the Arab-ocular surface disease index (Arab-OSDI) scores and clinical tests including tear break-up time test (TBUT), corneal fluorescein staining (CFS), and lissamine green conjunctival staining (LGS) at weeks 1, 3, and 6.
ResultsBoth formulations exhibited a significant improvement in Arab-OSDI scores from visit 2 at follow-up time points (p < 0.001). TBUT, CFS, and LGS showed an improvement in both the SH 0.15% and SH 0.38% groups (p < 0.05). SH 0.38% had a greater improvement in the proportion of evaporative dry eye from visit 2 to visit 5 (p = 0.001).
ConclusionLubricant eye drops are beneficial for alleviating the symptoms of dry eye. There was no noticeable difference in the effectiveness of these formulations in relieving symptoms and changing any of the objective signs that were assessed. Improved EDE outcomes occurred with SH 0.38% eye drops, observed between visit 2 and visit 5.
One of the most common tear-related problems is dry eye, which is caused by a decrease in tear film volume, faster tear film breakdown due to disturbed tear stability, and increased tear evaporation from the ocular surface.1 Artificial tears (ATs) are one of the most preferred first-line treatments for dry eye.2-3 ATs are currently the first-choice treatments and solutions for physicians and patients with dry eye disease (DED), as they are easily available over the counter and are affordably priced. Furthermore, topical administration of ATs has been shown to improve participants' subjective symptoms and objective signs of DED.4
ATs are customized solutions with a combination of ocular lubricants and active ingredients, such as sodium hyaluronate (SH), carboxymethylcellulose (CMC), hydroxypropyl methylcellulose (HPMC), polyethylene glycol (PEG), and glycerin, with the common goal of relieving eye discomfort and rejuvenating the ocular surface affected by DED.5 SH is a glycosaminoglycan with viscoelastic rheology which consists of repeating disaccharide units of N-acetyl-D-glucosamine and sodium-D-glucuronate. When shear stress is applied, the relatively low SH's viscosity allows for continued blinking, while blinking, its relatively high viscosity will then enhance tear film stability and reduces washout from the ocular surface. Additionally, SH exhibits excellent biocompatibility, stimulates epithelial wound healing, effectively binds water to prevent dehydration, reduces the severity of dry eye symptoms, and improves the optical quality of the retinal image.6-7 Furthermore, SH in gel preparation may reduce friction between the eyelid and the eye tissue, thereby enhancing tear film stability and ocular comfort.8 However, there have been conflicting findings on the effectiveness of SH in treating dry eye symptoms, tear film instability, inadequate aqueous tear secretion, and ocular surface staining.9-13
Johnson and colleagues demonstrated that clinical symptoms had the highest level of reduction when 0.3% SH eye-drops were instilled up to 6 hours. Another study noticed lengthen mean tear break up time test (TBUT) values immediately at 30 and 60 minutes after 0.18% SH instillation.10 A published work by Maheshwary et al.11 found the lengthen in TBUT in 0.4% SH Eye Gel group at 4th week and 8th week. In contrast, quite recently, You et al.12 found no significant differences in ocular surface disease index (OSDI), conjunctival staining, corneal fluorescein staining (CFS), or TBUT between SH concentrations of 0.1%, 0.18%, and 0.3%. Recently, Jun et al.13 also reported that after the 4th and 8th weeks of using 0.15% and 0.3% SH formulations, the scores of OSDI, conjunctival staining, CFS, and TBUT did not significantly change within the two groups.
Although numerous studies have evaluated DED across various populations, research on Arab communities—particularly in Gaza—remains limited. The geographic, environmental, and socioeconomic conditions of this region—including high rates of digital device use, limited access to specialized eye care, and exposure to environmental stressors—may influence both the prevalence and clinical presentation of DED. Studying this underrepresented population is therefore critical, as the findings not only contribute to the global understanding of DED but also provide region-specific insights that can inform tailored clinical management strategies. To date, no studies have assessed the impact of SH-based ocular lubricants on Arab populations with dry eye disease. This randomized trial aims to evaluate the efficacy of Gelling ingredient (SH 0.38%) and Non-gelling ingredient (0.18% SH) eye drops in improving dry eye symptoms and clinical parameters among adult Gazan participants.
Materials and methodsTrial design and participantsThis was a prospective, randomized, double-blinded, three-group, parallel, interventional, single-site clinical study. In our recent population-based survey of 426 Gazan residents using the validated Arab-OSDI and clinical tests14, we reported a high prevalence of symptomatic DED. From this screened population, 45 participants aged 18 to 40 years with moderate to severe DED were enrolled in the present trial. Participants were selected based on clearly defined inclusion and exclusion criteria to ensure a homogeneous and representative sample of younger adults with moderate to severe DED, as determined by the overall Arab Ocular Surface Disease Index (OSDI) score.15 The age range was chosen to focus on younger adults, in whom DED is primarily influenced by environmental and behavioural risk factors—such as prolonged screen exposure and occupational stress—rather than the anatomical and age-related changes more common in older populations. The sample size of 45 was considered feasible within this underrepresented population and sufficient to provide exploratory estimates of tear film parameters with acceptable precision.
EthicsAll participants provided written informed consent, and the study received institutional review board approval from Palestinian Health Research Council Helsinki Committee (PHRC/ HC/ 883/ 21, dated 5th April 05, 2021). The protocols involved in this study, based on the principles of adhere to the Declaration of Helsinki.
Randomization and sample size calculationThe participants were randomly divided into three groups, with 15 participants in each group. The participants were recruited from the recent study14 based on Arab-OSDI score (≥ 23). The number of participants in each group and the required sample size for recruitment were determined using the published data.16 An online sample calculator was used for the two-actual treatment parallel design investigation.17 The total calculated sample size required for the treatment was 45 participants, with 15 participants in each group, in order to detect a minimum clinically meaningful difference of 25% with a standard deviation of 20% (based on an 80% chance that the study will detect a treatment difference at a two-sided 5% significance level). It was anticipated that the mean of one group would be approximately the 80th percentile of the other group. We recruited 15 participants in each group to account for any potential loss to follow-up or participant withdrawal, which accounted for three participants (20% of the total).
Inclusion criteria- 1.
Participants aged 18 to 40 years.
- 2.
Residents of South Gaza Strip and diagnosed with moderate to severe dry eye by their overall Arab-OSDI score14, were included in this investigation.
- 1.
A known history of systemic diseases such as rheumatoid arthritis (RA), Sjögren syndrome, or thyroid disorders.
- 2.
Previously undergone punctal plugs or punctal cautery treatment for ocular surface pathologies such as pterygium, evident lid/ orbital disease with lagophthalmos, or punctal cautery.
- 3.
Using contact lenses (CLs) or felt the need to always wear CLs during the investigation.
- 4.
Underwent ocular surgeries within the last six months and/ or LASIK within the last 12 months.
- 5.
Unable to abstain from using medications such as antihistamines, anti-depressants, aspirin, anti-cholinergic, and corticosteroid drugs for a minimum of 6 weeks after taking central nervous system or hormonal medications within the last 30 days.
- 6.
Participants currently using ocular medications, start new ones during the study, or alter their systematic medications.
- 7.
Pregnancy and all conditions other than DED and refractive errors (REs) with a history of/ or current ocular pathology in the anterior segment or posterior pole.
All the participants underwent a seven-day 'washout' phase during which they used normal saline eye drops three times per day.18 After the "washout" phase, each group received either lubricant eye drops (either containing non-gelling ingredient SH 0.15% or gelling ingredient SH 0.38%) or 0.9% normal saline solution drops. For each group, one drop of 0.5 mL was applied three times a day, for 6 weeks. Throughout the time, the quantity of study eye drops used was observed. In order to monitor compliance, a drug diary was established. Craig et al.19 demonstrated that achieving long-term compliance is crucial for improving clinical signs rather than symptoms. Moreover, the same research team discovered that a mere one month of compliant usage could potentially predict the ineffectiveness of artificial tears in approximately one-third of patients.
BlindingThe type of eye-drop administered to each participant was masked by both the examiners and participants. To ensure proper masking, the lab assistant dispensed SH 0.15%, normal saline, SH 0.38% eye-drops using syringes. These eye-drops were placed in identical bottles, and the commercial labels were removed from the bottles to further ensure blinding.
ProceduresDuring the study, participants underwent a total of five visits. Visit 1 (baseline) involved objective clinical tests for DED, which included assessments of TMH (tear meniscus height), MGDs (meibomian gland dysfunctions), ML (Marx’s line), LGS (lissamine green conjunctival staining), CFS (corneal fluorescein staining), and STT (Schirmer tear test). In this visit, saline was also delivered to be instilled by the participants for the next 7 days for the purpose of washout. After one week (Visit 2), Arab-OSDI scores and clinical tests were conducted prior to the intervention, and participants were randomized into three groups. Group 1 received a SH 0.15% with a non-gelling ingredient, Group 2 received a 0.9% normal saline solution (placebo), and Group 3 received a SH 0.38% containing a gelling ingredient. Follow-up visits were scheduled for week 1 (Visit 3), week 3 (Visit 4), and week 6 (Visit 5). Weeks 1, 3, and 6 corresponded to one, three, and six weeks after treatment with the respective drops. After completing Visit 5, participants left the study, as illustrated in Fig. 1. The outcome assessment included Arab-OSDI scores and clinical tests (TMH, MGDs, ML, LGS, TBUT, CFS, and STT II) at weeks 1, 3, and 6, which were performed to monitor the participants' progress. The mean maximum (worst) score for the two eyes was used for MGDs, ML, CFS, and LGS, while the mean minimum (worst) score for the two eyes was utilized for TMH, TBUT, and STT II.

The Arabic version of the OSDI questionnaire consists of 12 domains and was used to evaluate dry eye symptoms. Arab-OSDI scores were divided into normal (0–12), mild (13–22), moderate (23–32), and severe symptoms (33-100).15 Assessment clinical diagnostic tests of DED were carried out including TMH, MGDs, ML staining, conjunctival staining, STT II, BUT, and the CFS. By minimizing the slit-lamp beam's profile intensity and positioning it horizontally so that it aligned with the inferior lid rim, TMH was assessed. It was determined that a participant with TMH less than 0.2 mm had insufficient aqueous tear secretion.20 In order to determine whether the MG is blocked, a gentle depression of the inferior and eversion of the upper eyelid rims with a slit-lamp's illumination beam was carried out. The MGDs were graded from 0 to 4 points (Grade 0, clear meibum, Grade 1, colored meibum with normal consistency, Grade 2, viscous meibum, Grade 3, inspissated meibum, and Grade 4, blocked MG).21 By wetting a lissamine green strip in a drop of saline solution and touching it into the inferior fornix, ML was calculated. The entire inferior eyelid margin zone was divided into three portions (the inner third, middle third, and outer third). Each segment was calculated on a score of 0-3 and a score > 3.5 was noted as abnormal.22 The level of lissamine stained in the conjunctiva was also assessed in this study. The grading of conjunctival staining reported by Bron et al.23 was applied. STT was performed by applying a sterile Schirmer paper that was placed laterally in the lower fornix under local anesthetic. After five minutes, the filter paper was removed, and the amount of wetting of the sterile paper was noted. A participant's insufficient secretion of aqueous tears was observed if their STT was less than 15 mm.24 In individuals with DED, TBUT was measured using fluorescein dye and a cobalt blue slit lamp beam. A fluorescein strip, moistened with a drop of saline, was gently applied to the bulbar conjunctiva. The interval between the last blink and the appearance of the first dark spot or streak on the tear film was recorded as the TBUT in seconds. This procedure was repeated three times, and the average of the three measurements was recorded.25 The Efron scale was used to grade the level of staining on the cornea.26
StatisticsStatistical analysis was performed using IBM SPSS (Version 23, SPSS Inc, Chicago, Illinois, USA). The Shapiro-Wilk test was used to assess the normality distribution. The Arab-OSDI version and clinical signs are expressed as mean values ± standard deviations. The comparisons of the baseline characteristics of Gazan participants among the three groups were assessed by the Kruskal-Wallis test. The analysis of variance (ANOVA) for repeated measurements was employed to evaluate variations in the outcomes between time points and groups. The sphericity assumption was evaluated using the Mauchly test. The Greenhouse-Geisser correction was used if sphericity could not be assumed. The Bonferroni correction was applied to post-hoc pairwise comparisons whenever the repeated-measures ANOVA revealed statistical significance. When parametric test assumptions were not fulfilled, the nonparametric Friedman test for repeated measurements with Dunn-Bonferroni post-hoc analysis was utilized. When comparing Arab-OSDI overall scores and clinical signs at visits 2, 3, 4, or 5 among the three groups, One-way ANOVA or Kruskal-Wallis test was used. Differences between the study variables were conducted between visit 2 and visit 3, visit 4, or visit 5 using a parametric test (paired sample t-test). The Wilcoxon signed-rank test was used for the non-parametric data. Categorical data were summarized by proportions and analyzed using the Chi-square (χ2) test.
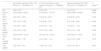
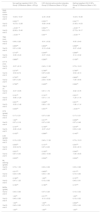
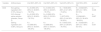
ResultsBaseline characteristics and Gazan participants flowThere were 45 Gazan participants in total; 15 participants (4 male, 11 female) were in non-gelling ingredient (SH 0.15% Group 1), 15 participants (3 male, 12 female) were in 0.9% Normal saline solution (placebo, Group 2), and 15 participants (3 male, 12 female) were in gelling ingredient (SH 0.38%, Group 3). All participants completed the follow-up visits. Sex, the mean age of the participants in each group, TBUT, CFS, TMH, MGDs, STT II, ML, and the LGS were not statistically different between the three groups (p > 0.05), as illustrated in Table 1.
Gazan participant’s baseline characteristics in the three groups.
| Non-gelling ingredient (SH 0.15% Group 1) n = 15 Median (CI) | 0.9% Normal saline solution (placebo, Group 2) n = 15 Median (CI) | Gelling ingredient (SH 0.38%, Group 3) n = 15 Median (CI) | p-value(a) | |
|---|---|---|---|---|
| M/F | 4.00:11.00 | 3.00:12.00 | 3.00:12.00 | 0.882 |
| Age (in yrs.) | 20.00 (20.00 – 26.67) | 21.00 (20.01 – 27.19) | 22.00 (20.65 – 26.28) | 0.536 |
| TBUT (sec) | 3.60 (3.00 – 5.63) | 4.20 (3.30 – 5.67) | 3.00 (2.92 – 4.50) | 0.723 |
| CFS (grade) | 0.00 (-0.00 – 0.34) | 0.00 (0.06 – 0.67) | 0.00 (0.06 – 0.60) | 0.568 |
| TMH (mm) | 1.00 (0.52 – 0.92) | 1.00 (0.65 – 1.15) | 1.00 (0.70 – 1.07) | 0.326 |
| MGDs (grade) | 0.00 (-0.06 – 0.86) | 0.00 (-0.06 – 0.86) | 0.00 (-0.12 – 0.65) | 0.862 |
| STT II (mm) | 34.00 (23.49 – 33.45) | 35.00 (27.46 – 35.21) | 35.00 (25.13 – 34.20) | 0.510 |
| ML staining (grade) | 0.00 (0.08 – 1.78) | 0.00 (-0.32 – 1.12) | 0.00 (-0.12 – 0.66) | 0.276 |
| LGS (grade) | 2.00 (1.39 – 2.01) | 1.50 (1.42 – 1.92) | 2.00 (1.46 – 2.01) | 0.921 |
M: male; F: female; yrs: years; sec: second; mm: millimeter; n: number; CI: confidence interval; ML: Marx’s line; LGS: lissamine green conjunctival staining; CFS: corneal fluorescein staining; STT: Schirmer tear test; TMH: tear meniscus height; TBUT: tear-break up time; MGDs: meibomian gland dysfunctions.
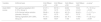
The SH 0.15% (F = 19.12, p < 0.001) and SH 0.38% (F = 22.12, p < 0.001) groups exhibited a statistically significant decrease in their Arab-OSDI scores following the treatment, while the score for the normal saline group remained largely unchanged (Fig. 2 and Table 2). The results revealed no significant difference in tear film assessment (TMH and STT II) among the three groups at visits 2, 3, 4, or 5. With regard to the TBUT, mean changes from visits 2, 3, 4, or 5 increased in the SH 0.15% and SH 0.38% groups (p < 0.001) but reduced in the normal saline group (p = 0.010), as shown in Table 3. CFS showed statistically significant improvement from visit 2 at all follow up visits (p = 0.024) after SH 0.15% and (p = 0.005) after SH 0.38% applications. At visits 3, 4, and 5, the LGS grade significantly improved compared to visit 2 for both the SH 0.15% (p = 0.022) and SH 0.38% (p = 0.023) groups. Lid margin assessment (ML staining and MGDs grades) were low in the Gazan dry eye participants at visit 2, and no group showed clinically significant improvements in ML staining and MGD during the entire investigation.

Mean ± SD of Arab-OSDI scores between the four visits for each group.
| Variable | Artificial tears | Visit 2Mean ± SD | Visit 3Mean ± SD | Visit 4Mean ± SD | Visit 5Mean ± SD | p-value* |
|---|---|---|---|---|---|---|
| Arab-OSDI scores | Non-gelling ingredient (SH 0.15%, Group 1) | 41.37 ± 15.61 | 30.72 ± 14.73 | 24.64 ±14.70 | 18.44 ±14.31 | F = 19.12, p < 0.001 |
| 0.9% Normal saline solution (placebo, Group 2) | 39.46 ± 14.61 | 41.80 ± 12.70 | 40.15 ± 13.27 | 36.43 ± 13.75 | F = 2.17, p = 0.153 | |
| Gelling ingredient (SH 0.38%, Group 3) | 47.19 ± 18.64 | 35.06 ± 16.97 | 23. 76 ± 11.93 | 17.69 ± 13.43 | F = 22.12, p < 0.001 |
OSDI: ocular surface disease index; SH: sodium hyaluronate.
Comparison of TMH, STT II, TBUT, CFS, LGS, ML and MGDs between the four visits for each group.
| Variables | Artificial tears | Visit 2 Median (CI) | Visit 3 Median (CI) | Visit 4 Median (CI) | Visit 5 Median (CI) | Significance(a) |
|---|---|---|---|---|---|---|
| TMH (mm) | Non-gelling ingredient (SH 0.15% Group 1) | 1.00 (0.55 – 1.09) | 1.00 (0.55 – 0.97) | 1.00 (0.62 – 0.99) | 1.00 (0.70 – 1.06) | p = 0.297 |
| 0.9% Normal saline solution (placebo, Group 2) | 1.00 (0.57 – 1.10) | 1.00 (0.58 – 1.11) | 1.00 (0.62 – 1.32) | 1.00 (0.65 – 1.15) | p = 0.829 | |
| Gelling ingredient (SH 0.38%, Group 3) | 1.00 (0.67 – 1.04) | 1.00 (0.70 – 1.15) | 1.00 (0.70 – 1.15) | 1.00 (0.89 – 1.04) | p = 0.356 | |
| STT II (mm) | Non-gelling ingredient (SH 0.15% Group 1) | 35.00 (25.33 – 34.14) | 35.00 (25.47 – 34.13) | 35.00 (26.15 – 34.39) | 34.00 (23.90 – 34.23) | p = 0.623 |
| 0.9% Normal saline solution (placebo, Group 2) | 35.00 (25.01 – 34.45) | 34.00 (21.10 – 33.57) | 33.00 (24.41 – 33.72) | 30.00 (22.41 – 31.99) | p = 0.797 | |
| Gelling ingredient (SH 0.38%, Group 3) | 33.00 (24.21 – 33.12) | 30.00 (23.42 – 32.44) | 35.00 (29.33 – 35.07) | 35.00 (26.55 – 34.39) | p = 0.450 | |
| TBUT (s) | Non-gelling ingredient (SH 0.15% Group 1) | 3.00 (2.64 – 5.11) | 3.00 (2.77 – 5.12) | 4.00 (3.45 – 5.61) | 4.50 (3.58 – 6.03) | p < 0.001 |
| 0.9% Normal saline solution (placebo, Group 2) | 4.00 (3.23 – 5.49) | 4.00 (3.14 – 4.35) | 3.60 (2.94 – 4.75) | 3.50 (2.87 – 4.64) | p = 0.010 | |
| Gelling ingredient (SH 0.38%, Group 3) | 3.00 (2.64 – 3.41) | 4.00 (3.40 – 4.30) | 6.00 (4.44 – 7.16) | 4.50 (4.34 – 5.44) | p < 0.001 | |
| CFS (grade) | Non-gelling ingredient (SH 0.15% Group 1) | 0.00 (-0.00 – 0.34) | 0.00 (-0.00 – 0.34) | 0.00 (-0.06 – 0.26) | 0.00 (-0.04 – 0.10) | p = 0.024 |
| 0.9% Normal saline solution (placebo, Group 2) | 0.00 (0.06 – 0.67) | 0.00 (0.00 – 0.59) | 0.00 (0.03 – 0.57) | 0.00 (0.14 – 0.73) | p = 0.308 | |
| Gelling ingredient (SH 0.38%, Group 3) | 0.00 (0.10 – 0.36) | 0.00 (-0.00 – 0.40) | 0.00 (0.00) | 0.00 (-0.15 – 0.42) | p = 0.005 | |
| LGS (grade) | Non-gelling ingredient (SH 0.15% Group 1) | 2.00 (1.51 –2.02) | 1.50 (0.89 –1.58) | 1.50 (1.25 –1.82) | 1.00 (0.71 –1.69) | p = 0.022 |
| 0.9% Normal saline solution (placebo, Group 2) | 1.50 (1.10 – 1.84) | 1.50 (1.22 – 1.78) | 1.50 (0.93 – 1.87) | 1.50 (1.42 – 1.92) | p = 0.638 | |
| Gelling ingredient (SH 0.38%, Group 3) | 2.00 (1.70 – 2.14) | 1.00 (0.91 – 1.49) | 1.00 (0.84 – 1.49) | 1.00 (0.44 – 1.29) | p = 0.023 | |
| ML staining (grade) | Non-gelling ingredient (SH 0.15% Group 1) | 0.00 (-0.28 – 1.48) | 0.00 (-0.35 – 1.42) | 0.00 (-0.45 – 1.26) | 0.00 (-0.46 – 1.26) | p = 0.194 |
| 0.9% Normal saline solution (placebo, Group 2) | 0.00 (-0.12 – 0.66) | 0.00 (-0.11– 0.51) | 0.00 (-0.31 – 0.84) | 0.00 (-0.08 – 0.21) | p = 0.682 | |
| Gelling ingredient (SH 0.38%, Group 3) | 0.00 (-0.06 – 0.33) | 0.00 (-0.08 – 0.21) | 0.00 (0.00) | 0.00 (0.00) | p = 0.194 | |
| MGDs (Grade) | Non-gelling ingredient (SH 0.15% Group 1) | 0.00 (-0.06 – 0.86) | 0.00 (-0.06 – 0.86) | 0.00 (-0.06 – 0.86) | 0.00 (-0.06 – 0.86) | p = 1.00 |
| 0.9% Normal saline solution (placebo, Group 2) | 0.00 (-0.06 – 0.86) | 0.00 (-0.06 – 0.86) | 0.00 (-0.06 – 0.86) | 0.00 (-0.08 – 1.02) | p = 0.392 | |
| Gelling ingredient (SH 0.38%, Group 3) | 0.00 (-0.12 – 0.66) | 0.00 (-0.12 – 0.66) | 0.00 (0.07 – 0.21) | 0.00 (0.00) | p = 0.121 |
CI: confidence interval; SH: sodium hyaluronate; mm: millimeter; s: second; TMH: tear meniscus height; STT: Schirmer tear test; TBUT: tear-break up time; CFS: corneal fluorescein staining; LGS: Lissamine green conjunctival staining; ML: marx’s line; MGDs: meibomian gland dysfunctions.
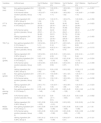
There were no significant differences in the Arab-OSDI scores among the three groups during visit 2 (F = 0.516, p = 0.601) and visit 3 (F = 2.10, p = 0.135). However, the Arab-OSDI scores showed improvement in SH 0.15% groups 1 and SH 0.38% group 3 during visit 4 (F = 7.16, p = 0.002) and visit 5 (F = 8.83, p = 0.001). Post-hoc testing confirmed that the Arab-OSDI scores in groups SH 0.15% and SH 0.38% were lower than those in group 2. The current study revealed no significant differences among the 0.15% SH, normal saline, and 0.38% SH groups in tear film parameters (TMH, STT II, and TBUT) at any visit. Furthermore, no statistically significant differences were observed in the mean change in TBUT values between the SH 0.15% and normal saline groups, or between the SH 0.38% and normal saline groups, at any follow-up visit (p > 0.05). A statistically significant reduction in CFS was noted at visit 4 for SH 0.38% (p = 0.041) compared to normal saline. However, at visit 5, only the SH 0.15% showed considerably lower grades than those from the normal saline (p = 0.016). There were no statistically significant differences between the SH 0.15%, normal saline and SH 0.38% groups for the mean change in ML staining, LGS and MGDs grades at each follow-up visit, as illustrated in Table 4.
Comparison of Arab-OSDI scores and clinical signs between the three groups for each visit.
| Variables | Visits | Non-gelling ingredient (SH 0.15%, Group 1) Mean ± SD or Median (CI) | 0.9% Normal saline solution (placebo, Group 2) Mean ± SD or Median (CI) | Gelling ingredient (SH 0.38%, Group 3) Mean ± SD or Median (CI) | Significance |
|---|---|---|---|---|---|
| Arab-OSDI scores | Visit 2 | 41.37 ± 15.61 | 39.46 ± 14.61 | 47.19 ± 18.64 | F = 0.516, p = 0.601(a) |
| Visit 3 | 30.72 ± 14.73 | 41.80 ± 12.70 | 35.06 ± 16.97 | F = 2.10, p = 0.135(a) | |
| Visit 4 | 24.64 ± 14.70 | 40.15 ± 13.27 | 23.76 ± 11.93 | F = 7.16, p = 0.002(a)Post Hoc paired t- testSH 0.15% vs. placebo (p = 0.008)SH 0.38% vs. placebo (p = 0.005) | |
| Visit 5 | 18.44 ± 14.31 | 36.43 ± 13.75 | 17.69 ± 13.43 | F = 8.83, p = 0.001(a)Post Hoc paired t- testSH 0.15% vs. placebo (p = 0.003)SH 0.38% vs. placebo (p = 0.002) | |
| TMH (mm) | Visit 2 | 1.00 (0.55 – 1.09) | 1.00 (0.57 – 1.10) | 1.00 (0.67 – 1.04) | p = 0.833(b) |
| Visit 3 | 1.00 (0.55 – 0.97) | 1.00 (0.58 – 1.11) | 1.00 (0.70 – 1.15) | p = 0.740(b) | |
| Visit 4 | 1.00 (0.62 – 0.99) | 1.00 (0.62 – 1.32) | 1.00 (0.70 – 1.15) | p = 0.802(b) | |
| Visit 5 | 1.00 (0.70 – 1.06) | 1.00 (0.65 – 1.15) | 1.00 (0.89 – 1.04) | p = 0.473(b) | |
| STTII (mm) | Visit 2 | 35.00 (25.33 – 34.14) | 35.00 (25.01 – 34.45) | 33.00 (24.21 – 33.12) | p = 0.428(b) |
| Visit 3 | 35.00 (25.47 – 34.13) | 34.00 (21.10 – 33.57) | 30.00 (23.42 – 32.44) | p = 0.097(b) | |
| Visit 4 | 35.00 (26.15 – 34.39) | 33.00 (24.41 – 33.72) | 35.00 (29.33 – 35.07) | p = 0.717(b) | |
| Visit 5 | 34.00 (23.90 – 34.23) | 30.00 (22.41 – 31.99) | 35.00 (26.55 – 34.39) | p = 0.577(b) | |
| TBUT (s) | Visit 2 | 3.88 ± 2.24 | 4.36 ± 2.03 | 3.03 ± 0.69 | F = 2.13,p = 0.131(a) |
| Visit 3 | 3.94 ± 2.13 | 3.75 ± 1.09 | 3.85 ± 0.81 | F = 0.069,p = 0.934(a) | |
| Visit 4 | 4.00 (3.45 – 5.61) | 3.60 (2.94 – 4.75) | 6.00 (4.44 – 7.16) | p = 0.765(b) | |
| Visit 5 | 4.81 ± 2.22 | 3.76 ± 1.60 | 4.89 ± 0.99 | F = 2.11,p = 0.133(a) | |
| LGS (grade) | Visit 2 | 2.00 (1.51 – 2.02) | 1.50 (1.10 – 1.84) | 2.00 (1.70 – 2.14) | p = 0.788(b) |
| Visit 3 | 1.50 (0.89 – 1.58) | 1.50 (1.22 – 1.78) | 1.00 (0.91 – 1.49) | p = 0.743(b) | |
| Visit 4 | 1.50 (1.25 – 1.82) | 1.50 (0.93 – 1.87) | 1.00 (0.84 – 1.49) | p = 0.637(b) | |
| Visit 5 | 1.00 (0.71 – 1.69) | 1.50 (1.42 – 1.92) | 1.00 (0.44 – 1.29) | p = 0.340(b) | |
| ML (grade) | Visit 2 | 0.00 (-0.28 – 1.48) | 0.00 (-0.12 – 0.66) | 0.00 (-0.06 – 0.33) | p = 0.803(b) |
| Visit 3 | 0.00 (-0.35 – 1.42) | 0.00 (-0.11– 0.51) | 0.00 (-0.08 – 0.21) | p = 0.764(b) | |
| Visit 4 | 0.00 (-0.45 – 1.26) | 0.00 (-0.31 – 0.84) | 0.00 (0.00) | p = 0.599(b) | |
| Visit 5 | 0.00 (-0.46 – 1.26) | 0.00 (-0.08 – 0.21) | 0.00 (0.00) | p = 0.599(b) | |
| MGDs (grade) | Visit 2 | 0.00 (-0.06 – 0.86) | 0.00 (-0.06 – 0.86) | 0.00 (-0.12 – 0.66) | p = 0.862(b) |
| Visit 3 | 0.00 (-0.06 – 0.86) | 0.00 (-0.06 – 0.86) | 0.00 (-0.12 – 0.66) | p = 0.862(b) | |
| Visit 4 | 0.00 (-0.06 – 0.86) | 0.00 (-0.06 – 0.86) | 0.00 (0.07 – 0.21) | p = 0.450(b) | |
| Visit 5 | 0.00 (-0.06 – 0.86) | 0.00 (-0.08 – 1.02) | 0.00 (0.00) | p = 0.185(b) | |
| CFS (grade) | Visit 2 | 0.00 (-0.00 – 0.34) | 0.00 (0.06 – 0.67) | 0.00 (0.10 – 0.36) | p = 0.450(b) |
| Visit 3 | 0.00 (-0.00 – 0.34) | 0.00 (0.00 – 0.59) | 0.00 (-0.00 – 0.40) | p = 0.851(b) | |
| Visit 4 | 0.00 (-0.06 – 0.26) | 0.00 (0.03 – 0.57) | 0.00 (0.00) | p = 0.041(b)Post Hoc Wilcoxon signed rank testSH 0.38% vs. placebo (p = 0.041) | |
| Visit 5 | 0.00 (-0.04 – 0.10) | 0.00 (0.14 – 0.73) | 0.00 (-0.15 – 0.42) | p = 0.009(b)Post Hoc Wilcoxon signed rank testSH 0.15% vs. placebo (p = 0.016) |
SH: sodium hyaluronate; mm: millimeter; CI: confidence interval; SD: standard deviation; s: second; TMH: tear meniscus height; STT: Schirmer tear test; TBUT: tear-break up time; CFS: corneal fluorescein staining; LGS: Lissamine green conjunctival staining; ML: marx’s line; MGDs: meibomian gland dysfunctions.
Both the SH 0.15% and SH 0.38% groups showed a statistically significant decrease in Arab-OSDI scores from visit 2 to visit 3 (p = 0.002 and 0.047, respectively). At visit 3, the mean overall score was reduced by 10.64 in the SH 0.15%, and by 10.34 in the SH 0.38% group. Furthermore, a significant improvement in the Arab-OSDI score from visit 2 was observed in group 1 (SH 0.15%) and group 3 (SH 0.38%) during visits 4 and 5 (p < 0.001). At visit 5, the mean overall score was reduced by 22.92 in the SH 0.15% group, by 3.02 in the normal saline group, and by 27.72 in the SH 0.38% group. Within-group mean changes in TMH and STT II values from visit 2 were not statistically significant at any follow-up visit in either the treatment or saline groups. In contrast, mean TBUT changes from visit 2 were statistically significant in the SH 0.15% group at visits 4 and 5, and in the SH 0.38% group at visits 3, 4, and 5, whereas no significant changes were observed at any follow-up visit in the saline group (visit 3: 0.61 ± 1.73; visit 4: 0.51 ± 1.13; visit 5: 0.60 ± 1.03; p > 0.05 at all follow-ups). Corneal staining by a fluorescein strip and assessment with Efron grade demonstrated a significant improvement in Efron grade with SH 0.38% at visit 4 only (0.37 ± 0.48, p = 0.016). At visits 3, 4, and 5, the LGS grade significantly improved compared to visit 2 for both the SH 0.15% and SH 0.38% groups (0.13 ± 0.23 with SH 0.15% and 0.73 ± 10.01 with SH 0.38% at visit 3; - 0.53 ± 5.74 with SH 0.15% and -3.53 ± 8.13 with SH 0.38% at visit 4; 0.67 ± 6.30 with SH 0.15% and -1.80 ± 6.45 with SH 0.38% at visit 5; p < 0.05 at all follow-ups). After visits 3, 4, and 5, the grades of ML staining and MGDs were also not significantly improved compared to visit 2 for the SH 0.15%, normal saline, and the SH 0.38% groups, as indicated in Table 5.
Comparison in the difference of Arab-OSDI between visit 2 and the subsequent visits (3, 4, and 5) for each group.
| Non-gelling ingredient (SH 0.15% Group 1)Difference (Mean ± SD)(p) | 0.9% Normal saline solution (placebo, Group 2) Difference (Mean ± SD)(p) | Gelling ingredient (SH 0.38%, Group 3) Difference (Mean ± SD)(p) | |
|---|---|---|---|
| Arab-OSDI scores | |||
| Visit 2 - visit 3 | 10.64 ± 10.67 | -2.34 ± 9.48 | 10.34 ± 18.38 |
| 0.002 (a) | 0.355 (a) | 0.047 (a) | |
| Visit 2 - visit 4 | 16.73 ± 13.38 | -0.69 ± 4.48 | 21.65 ± 14.03 |
| < 0.001 (a) | 0.554 (a) | < 0.001 (a) | |
| Visit 2 - visit 5 | 22.92 ± 15.45 | 3.02 ± 5.71 | 27.72 ± 16.17 |
| < 0.001 (a) | 0.06 (a) | < 0.001 (a) | |
| TMH (mm) | |||
| Visit 2 - visit 3 | 0.06 ± 0.26 | -0.01 ± 0.32 | -0.05 ± 0.43 |
| 0.655(b) | 0.854(b) | 0.599(b) | |
| Visit 2 - visit 4 | 0.01 ± 0.36 | -0.13 ± 0.46 | -0.07 ± 0.42 |
| 0.715(b) | 0.344(b) | 0.599(b) | |
| Visit 2 - visit 5 | -0.06 ± 0.40 | -0.07 ± 0.24 | -0.14 ± 0.32 |
| 0.889(b) | 0.285(b) | 0.109(b) | |
| STT II (mm) | |||
| Visit 2 - visit 3 | -0.07 ± 6.10 | 2.40 ± 11.56 | 0.73 ± 10.01 |
| 0.374(b) | 0.799(b) | 0.799(b) | |
| Visit 2 - visit 4 | -0.53 ±5.74 | 0.67 ± 6.63 | -3.53 ± 8.13 |
| 0.735(b) | 0.504(b) | 0.906(b) | |
| Visit 2 - visit 5 | 0.67 ± 6.30 | 2.53 ± 10.60 | -1.80 ± 6.45 |
| 0.799(b) | 0.422(b) | 0.284(b) | |
| TBUT (s) | |||
| Visit 2 - visit 3 | -0.07 ± 0.95 | 0.61 ± 1.73 | -0.82 ± 0.76 |
| 0.161(b) | 0.191(a) | 0.001(a) | |
| Visit 2 - visit 4 | -0.66 ± 1.28 | 0.51 ± 1.13 | -1.29 ± 1.16 |
| 0.021(b) | 0.348(b) | 0.001(a) | |
| Visit 2 - visit 5 | -0.93 ± 1.48 | 0.60 ± 1.03 | -1.86 ± 1.14 |
| 0.035(b) | 0.551(b) | < 0.001(a) | |
| CFS (grade) | |||
| Visit 2 - visit 3 | 0.17 ± 0.31 | 0.07 ± 0.26 | 0.17 ± 0.31 |
| 1.00(b) | 0.317(b) | 0.059(b) | |
| Visit 2 - visit 4 | 0.07 ± 0.18 | 0.07 ± 0.32 | 0.37 ± 0.48 |
| 0.157(b) | 0.155(b) | 0.016(b) | |
| Visit 2 - visit 5 | -0.06 ± 0.40 | -0.07 ± 0.47 | 0.33 ± 0.49 |
| 0.102(b) | 0.589(b) | 0.143(b) | |
| LGS (grade) | |||
| Visit 2 - visit 3 | 0.13 ± 0.23 | 2.40 ± 11.56 | 0.73 ± 10.01 |
| 0.005(b) | 0.131(b) | 0.047(b) | |
| Visit 2 - visit 4 | -0.53 ±5.74 | 0.67 ± 6.63 | -3.53 ± 8.13 |
| 0.001(b) | 0.163(b) | 0.040(b) | |
| Visit 2 - visit 5 | 0.67 ± 6.30 | 2.53 ± 10.60 | -1.80 ± 6.45 |
| 0.003(b) | 0.324(b) | 0.024(b) | |
| ML staining (grade) | |||
| Visit 2 - visit 3 | 0.73 ± 1.53 | 0.00 ± 0.38 | 0.33 ± 0.98 |
| 0.317(b) | 0.655(b) | 0.317(b) | |
| Visit 2 - visit 4 | 0.33 ± 0.90 | 0.40 ± 1.84 | 0.13 ± 0.83 |
| 0.180(b) | 1.00(b) | 0.157(b) | |
| Visit 2 - visit 5 | 0.47 ± 1.25 | 0.13 ± 0.83 | 0.40 ± 0.91 |
| 0.180(b) | 0.180(b) | 0.157(b) | |
| MGDs (grade) | |||
| Visit 2 - visit 3 | 0.40 ± 0.83 | 0.07 ± 0.26 | 0.13 ± 0.52 |
| 1.00(b) | 0.317(b) | 1.00(b) | |
| Visit 2 - visit 4 | 0.40 ± 0.83 | -0.13 ± 0.52 | 0.13 ± 0.52 |
| 1.00(b) | 1.00(b) | 0.564(b) | |
| Visit 2 - visit 5 | 0.40 ± 0.83 | 0.27 ± 0.70 | 0.33 ± 0.49 |
| 1.00(b) | 1.00(b) | 1.00(b) |
SH: sodium hyaluronate; mm: millimeter; s: second; TMH: tear meniscus height; STT: Schirmer tear test; TBUT: tear-break up time; CFS: corneal fluorescein staining; LGS: Lissamine green conjunctival staining; ML: marx’s line; MGDs: meibomian gland dysfunctions.
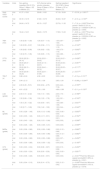
A total of 29 participants out of 45 had EDE (64.44%; 95% CI: 48.80% - 78.10%) for the three groups, as found from visit 2. In the SH 0.38% group, 9 out of 13 participants found an improvement in the proportion of evaporative dry eye from visit 2 to visit 5 (p = 0.001). In the SH 0.15% group without gelling ingredients, this proportion decreased from 4 out of 8 at visit 2 to visit 5, but the change was not statistically significant (p = 0.408). There was no significant difference between visit 2 and visit 5 reported in the 0.9% normal saline solution group (p = 0.697), as shown in Table 6.
The proportion of participants with evaporative dry eye between the four visits for each group.
| Variable | Artificial tears | Visit 2N% (95% CI) | Visit 3N% (95% CI) | Visit 4N% (95% CI) | Visit 5N% (95% CI) | p-value* |
|---|---|---|---|---|---|---|
| EDE | Non-gelling ingredient (SH 0.15%, Group 1) | N = 8.0053.33% (95% CI: 26.60% - 78.70%) | N = 8.0053.33% (95% CI: 26.60% - 78.70%) | N = 7.0046.66% (95% CI: 21.30% - 73.40%) | N = 4.0026.66%(95% CI: 7.80% - 55.10%) | p = 0.408 |
| 0.9% Normal saline solution (placebo, Group 2) | N = 8.0053.33% (95% CI: 26.60% - 78.70%) | N = 9.0060.00% (95% CI: 32.30% - 83.70%) | N = 11.0073.33% (95% CI: 44.90% - 92.20%) | N = 10.0066.66%(95% CI: 38.40% - 88.20%) | p = 0.697 | |
| Gelling ingredient (SH 0.38%, Group 3) | N = 13.0086.66% (95% CI: 59.50% - 98.30%) | N = 13.0086.66% (95% CI: 59.50% - 98.30%) | N = 8.0053.33% (95% CI: 26.60% - 78.70%) | N = 4.0026.66%(95% CI: 7.80% - 55.10%) | p = 0.001 |
EDE: evaporative dry eye; SH: sodium hyaluronate; N: number; CI: confidence interval; %: percentage.
This study compared the alterations in the Arab-OSDI overall score, tear film assessment, ocular surface integrity, and lid margin assessment at 5 visits (6 weeks) after of using two artificial tears eye drops, with and without a gelling ingredient (SH 0.15% non-gelling and SH 0.38% gelling ingredient). This is crucial since the first option of treatment frequently administered for dry eye is artificial tears.27 Artificial tears are generally considered safe, but a prior study had noted several adverse effects, including inadequate vision, a sticky sensation, and a feeling of a foreign body.28 This is because different artificial tear formulations function differently, and some of them were designed to enhance one or more layers of the tear film.
The formulation of artificial tears is vital in determining their effectiveness.29 Sodium hyaluronate has advantages over other artificial tears for treating dry eyes.30 It has been proven to improve fluorescein stains, suggesting that its use as a treatment aid in the repair of corneal and conjunctival epithelium.31 The effectiveness of hyaluronan has been demonstrated by the reduction of patient symptoms and tear evaporation.32-33 In vitro studies by Zhang et al.34 also found that sodium hyaluronate significantly outperformed carboxymethylcellulose and hydroxypropyl methylcellulose in preserving moisture and preventing dehydration in corneal epithelial cells. Based on SH advantages, both SH 0.15% non-gelling and SH 0.38% gelling ingredient artificial tears were used in the current study.
The study demonstrated that Arab-OSDI scores decreased significantly from visit 2 following the use of two formulations at all follow-up time points. The mean Arab-OSDI score change in the 0.38% SH group was slightly higher than in the SH 0.15% group, but the difference was not statistically significant. The difference between two concentrations in terms of OSDI total score indicates that daily usage of SH 0.38%, as opposed to SH 0.15%, does not result in gel-related blurred vision disturbance when prescribed for individuals with severe DED.35 Our outcomes were in agreement with a previous study that demonstrated that 0.1% SH and 0.3% SH provide more prolonged symptom alleviation than saline. The findings of this investigation corroborate the authors' explanation that this impact was caused by SH's longer-lasting residence period on the ocular surface.9
The use of SH has been shown in numerous studies to increase corneal wettability and extend TBUT, emphasizing its ability to retain water and provide lubrication.9,12,36,37 In our investigation, TBUT improved in both the SH 0.15% and SH 0.38% groups. However, TBUT values decreased in the normal saline group during the course of the study. This may be related to the findings of Paugh et al.38, who discovered that precorneal residence time partially reflects viscosity and is more than twice as long for viscous formulations compared with saline. Therefore, daily administration of 0.18% HA drops and evening or bedtime instillation of 0.30% HA gel can be considered for moderate or severe DED. Based on these findings, a lower-viscosity formulation may be more suitable for daytime activities to minimize visual disturbance, while a higher-viscosity formulation may be recommended for evening or nighttime use to provide sustained ocular surface protection during sleep.
Our study showed a significant reduction in CFS grades for both formulations at all intervals. However, the difference between the two formulations was not significant. This lack of significance might be attributed to the potential corneal epithelial repair promoted by SH-containing eye drops, as suggested by Shimmura et al.39 Furthermore, the evidence could possibly be influenced by the lowest degree of epithelium involvement and a tendency for recorded mean values to be close to zero, as observed in the study by Caretti et al.40 Our findings were consistent with the previous study by Lee et al.41, who reported a significant improvement in dry eye symptoms, TBUT, and corneal and conjunctival surface after using 0.1% SH eye drops for 8 weeks. Another study employing 0.38% SH found that dry eye symptoms diminished over a 16-day period, as assessed by the Dry Eye Disease Assessment Questionnaire score.42 Both TMH and STT II in our study did not reveal significant changes after the SH 0.15% and SH 0.38% administrations. This may be due to some patients having moderate/severe OSDI overall scores despite normal Schirmer test values and mild corneal staining observed with slit lamp biomicroscopy, whereas other patients may feel no symptoms at all despite having severe corneal signs. Therefore, a variety of other objective methods should be employed to assess the efficacy of interventions in alleviating dry eye disease.43 Compared to unanesthetized eyes, topical anesthetic has also been shown to reduce Schirmer test readings by 40 to 56.5%.44-45 Previous literature has demonstrated that lubricants with gelling ingredients can significantly increase TMH.27 Similarly, the outcomes of this study demonstrated that lubricants with gelling ingredients were able to produce a significant improvement in the TMH values up to 20 to 60 minutes after instillation, compared to lubricants that do not contain gelling ingredients. However, the methodology of the current study differed significantly from that of the previous studies because our study compared the TMH at 5 visits (6 weeks) after using two types of artificial tear eye drops, one with a gelling ingredient and the other without. Slit-lamp examination also has a main flaw in its inability to consistently identify the TM.46
No between-group differences were noted in MGD or ML staining outcomes in the present investigation. This could be attributed to the study population predominantly presenting with clear meibomian glands or only mild MGD, as well as the small number of participants with ML staining. Consequently, this may have limited the ability to identify which grades of MGD or ML staining could benefit from these eye drops.47 Furthermore, when interpreting our findings, it is important to consider the relatively young age of our study population. In younger individuals, DED is frequently associated with behavioural and environmental factors, such as prolonged computer use, digital device exposure, and reduced blink rate, all of which contribute to tear film instability and ocular discomfort.48-49 By contrast, in older populations (50 years and above), DED is more commonly linked to age-related anatomical and physiological changes, including meibomian gland dysfunction, goblet cell loss, and lacrimal gland dysfunction.50-51 This distinction highlights that although the underlying mechanisms of DED differ across age groups, artificial tear supplementation remains an important strategy to alleviate symptoms, albeit with potentially varying clinical expectations depending on the population studied. To the best of our knowledge, no previous investigation has assessed the efficacy of SH 0.15% non-gelling and SH 0.38% gelling ingredient formulations in treating ML following instillation. It is worth highlighting that there was no statistically significant difference between the two formulations (SH 0.15% non-gelling and SH 0.38% gelling ingredient) in any of the parameters that were assessed. Although the follow-up duration in this study was sufficient to evaluate short-term efficacy using TBUT, TMH, STT II, MGDs, ML staining, and OSDI, it may not have been adequate to capture long-term outcomes. Previous studies have reported that sustained changes in tear film stability and meibomian gland function often require longer observation periods (>3–6 months).30,52-53 Therefore, future investigations with extended follow-up are recommended.
Previously, Wlodarczyk & Fairchild54, reported that lubricating eye drops with and without gelling ingredients were both determined to be cost-effective. After four weeks of treatment, participants treated with a lubricant containing gelling ingredient 0.4% SH reported that the overall OSDI score did not differ significantly from those treated with a lubricant without a non-gelling ingredient 0.15% SH (randomized controlled single-centre study).55 The same researcher also demonstrated there were no noticeable differences in TBUT, TMH, and the ocular surface staining between the two groups. Another study comparing lubricant eye drops with a gelling ingredient 0.30% SH to lubricants without a gelling ingredient 0.18% SH found no difference in the improvement of dry eye symptoms between the two groups.35 The 5-Item-Dry Eye-Questionnaire (5-DEQ) score was used in the Calonge study to assess the dry eye symptoms. Furthermore, no statistical differences were detected in TBUT, Schirmer's I test, and CFS between the two formulations. Clinical trials that compared lubricants with and without gelling ingredients had reported, but no definitive conclusion could be formed because the findings were inconsistent among investigations.
It should be noted that almost two-thirds of the participants (29 of 45) had EDE for the three groups, which was found from visit 2. The high prevalence of EDE in the current study is thought to be partially explained by higher exposure to digital screens, especially at a younger age, which may have suppressed spontaneous and reflex blinking during tasks involving a significant amount of cognitive load and visual processing.51-52 The subsequent drop in blink rate and completeness can decreasing the integrity and quality of the surface tear film lipid layer and increasing the risk of developing EDE.56-57
Our study found that SH 0.38% had a greater improvement in the proportion of evaporative dry eye from visit 2 to visit 5 compared to normal saline solution and SH 0.15%. This improvement might be attributed to the fact that SH 0.38% exhibited the highest ability to protect the corneal epithelial cells from desiccation, which was concentration-dependent.58-59 Furthermore, the effectiveness of SH 0.38% in improving TBUT was demonstrated by a significant increase of approximately 46.8% in TBUT from visit 2 (p < 0.001). This finding is consistent with Montés-Micó et al.60, who observed a significant enhancement in TBUT values for dry eyes after the administration of SH 0.38% during the baseline visit.
Potential limitations of the current study include the lack of data about the moderate/ severe MGDs or ML staining as well as the other modalities of eye drops that may have different impacts on the tear film profile. The sample size was modest, and we did not enroll the elderly age in this study because of the higher probability of having poor technique in participants with advanced age.61 Finally, outcomes related to aqueous tear deficiency and mixed dry eye types were not included in this study due to the low number of participants.
Drawing a definitive conclusion from this intervention trial is challenging. This investigation demonstrates that formulations with or without gelling ingredients are beneficial in alleviating dry eye symptoms. No noticeable differences were observed between them in terms of symptom relief or changes in the assessed clinical signs. These findings suggest that lubricant eye drops, regardless of gelling content, are effective in managing symptoms of dry eye. However, further studies are needed to confirm the compatibility of these formulations in Gazan patients with dry eye. Based on our results, we recommend interpreting outcomes with caution, as extrapolating findings from younger individuals to older populations is not appropriate. Given the distinct underlying mechanisms of DED across age groups, the efficacy of these formulations may differ significantly in older patients. The evaporative form of DED, characterized by Arab-OSDI scores ≥ 13 and the presence of at least one positive clinical sign (TBUT < 5 seconds or MGDs > 1), was found to be more prevalent at visit 2 in the current study. A significant improvement in evaporative dry eye was observed in participants treated with SH 0.38% eye drops between visit 2 and visit 5.
Trial registrationClinicalTrials.gov, NCT06851364 (24/02/2025).
Informed Consent StatementInformed consent was obtained from all participants involved in the study.
FundingThis study was supported by research grant 019-042024 from the Management and Science University (MSU), Shah Alam, Malaysia. The funding sources had no role in the study design; collection, analysis, and interpretation of data; writing of the report; and in the decision to submit the article for publication.
Declaration of competing interestThe authors declare no conflict of interest related to this study.


