


This study analyzes the effect of two different gradient index (GRIN) crystalline lens models on ocular optical performance compared to that of a homogeneous lens. Using the biometric data of 200 SyntEyes (synthetically generated eyes), we implemented three lens models: homogeneous, GRIN, and GRINCU (gradient index and gradient curvature of the isoindicial surfaces). Using the three lens models, we conducted finite ray tracing on the SyntEyes samples, incorporating five different curvature gradients into the GRINCU setup. We calculated the average cardinal points and Zernike aberration coefficients for each SyntEyes sample, along with the cardinal points for each lens model. GRINCU lens configurations with increased IIS curvature toward the center result in an average forward shift of the lens principal planes, leading to increased ocular power relative to the homogeneous lens model. Steeper curvature gradients of the IIS towards the lens center result in reduced astigmatism, defocus, lateral coma, and primary spherical aberration. The interplay between the lens’s gradient index and IIS curvature gradient alters the optical properties of the eye as a whole, highlighting the crucial role of the lens’s internal properties in optical performance.
Eye models are an invaluable tool in visual optics; they allow for quick calculations of optical parameters and have been essential in understanding the optics of the human eye. The performance of eye models has become closer to that of natural eyes, accounting for changes with age,1–5 accommodation,6–8 or both.9,10 However, they are often generic and represent emmetropic eyes with a fixed set of optometric parameters based on population averages. Individual eyes can differ enormously from the average, and models do not consider the high intersubject variability in eye anatomy observed in epidemiological biometry studies. Reliable refractive calculations for individually tailored treatments require a detailed description of the eye’s biometric dimensions and optical properties, and generic models fall short when attempting to replicate the optical behavior of an individual eye exactly. This behavior is determined by the shape and substance of the eye’s surfaces and the gradient index (GRIN) distribution inside the crystalline lens.
Besides enhancing lens power, the GRIN distribution contributes to ocular aberrations11–15 and peripheral power.16 Most GRIN lens models assume a concentric shell configuration of the isoindicial surfaces (IIS) inside the lens.17 However, the presence of a gradient in the curvatures of the IIS strongly impacts the lens power.18 Developing more realistic and customizable eye models requires lens models that can adapt to individuality. Including both a gradient index and a gradient curvature of the isoindicial surfaces is crucial to analyzing the effect of the internal structure of the lens on the optical performance of the whole eye. Only two recent GRIN models, GRINCU5 and AVOCADO,3 allow for modifying the inner curvature gradient. Of these two, the GRINCU lens model5 provides an explicit method for changing the curvature gradient inside the lens. Properly assessing the influence of the gradient and curvature distribution inside the lens would ideally involve testing the model on a large set of ocular biometric data. However, complete sets are not publicly available, and essential lens parameters are missing in the ones that are. Given the bigaussian nature of the human ocular biometric parameters,19 it makes sense to use a statistical eye model with the exact statistical properties of actual eye data. SyntEyes20 is a platform that produces sets of synthetic biometric data with physiologically realistic variations matching those of the general population. These virtual eyes do not require biometric measurements from the end user and form a valuable tool for vision scientists and clinicians to analyze and simulate the optical properties of the human eye before and after intervention.
In the present study, we analyze the effects of different curvature gradients of the crystalline lens isoindicial surfaces (IIS) on the performance of 200 randomly generated SyntEyes. Using customized Matlab ray tracing software to model light propagation through the eye optical system, we compute the cardinal points and power and evaluate the Zernike aberration coefficients for five different inner curvature gradients of the lens.
Material and methodsEye biometric dataThe biometric data used in this study correspond to the first 200 entries of a file containing 1000 randomly generated SyntEyes, which was provided as a supplement to the original paper.20 SyntEyes is a higher-order statistical model based on the clinically measured biometry of 312 healthy right eyes of White Western European individuals (57.1% women). The cohort had a mean spherical equivalent of -1.23 ± 2.29D (range [-8.63D, +3.63D]), measured under non-cycloplegic conditions. The data generated by the model is statistically indistinguishable from the data it is based on and includes the normal biometric variations found in the general population between the ages of 20 and 60. Table 1 lists the mean values and standard deviations of the SyntEyes variables considered in this study. Other biometric parameters that remained fixed for all eyes throughout this study are shown in Table 2.
Biometry of the SyntEyes20 and other data.
| Symbol | Unit | Value (SD) | Description |
|---|---|---|---|
| rca | mm | 7.79 (0.23) | Anterior corneal radius of curvature |
| rcp | mm | 6.55 (0.24) | Posterior corneal radius of curvature |
| rla | mm | 10.56 (1.23) | Anterior lens radius of curvature |
| rlp | mm | −6.95 (0.77) | Posterior lens radius of curvature |
| CCT | µm | 548.49 (32.48) | Central corneal thickness |
| ACDa | mm | 2.88 (0.42) | Anterior chamber depth |
| LT | mm | 4.05 (0.39) | Lens thickness |
| VCD | mm | 16.30 (1.00) | Vitreous chamber depth |
| LShx | mm | 0.11 (0.03) | Lens shift in the x-direction, relative to the principal axis |
| LShy | mm | −0.07 (0.19) | Lens shift in the y-direction, relative to the principal axis |
| LTix | deg. | 3.68 (1.06) | Lens tilt around the y-axis |
| LTiy | deg. | 0.10 (0.89) | Lens tilt around the x-axis |
| nl | – | 1.4316 (0.0092) | Equivalent refractive index of the lens (equivalent model) |
Standard deviations are included where average values are provided.
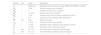
Other biometric parameters used in this study.
| Symbol | Unit | Value | Description |
|---|---|---|---|
| nc | – | Optimized | Refractive index of the lens center (GRIN and GRINCU models) |
| Qca | – | −0.26 | Anterior corneal conic constant21 |
| Qcp | – | 0 | Posterior corneal conic constant6 |
| Qla | – | −3.1316 | Anterior lens conic constant6 |
| Qlp | – | −1.05 | Posterior lens conic constant, modified from Ref. 6 |
| p | – | 3.3 | Exponent of the refractive index distribution1 |
| RT | mm | 0.20 | Retinal thickness |
| nco | – | 1.3774 | Refractive index of the cornea9 |
| n0 | – | 1.3374 | Refractive index of aqueous and vitreous humors9 |
| ns | – | 1.3726 | Refractive index of the lens surface9 |
| ta | mm | 0.6 × LT | Axial thickness of anterior lenticular region1 |
| tp | mm | 0.4 × LT | Axial thickness of posterior lenticular region1 |
Each of the 200 SyntEyes was implemented with three different crystalline lens models: a two-surface homogeneous lens with a constant equivalent index nL (see Table 1 for average value), a GRIN lens, and a GRINCU lens. The GRIN lens model1 is an age-dependent parametric model where the internal refractive index distribution of the lens adapts to its external geometry. The isoindicial surfaces (IIS) are rotationally symmetric conicoids that are concentric with the external lens surface, and the refractive index distribution in the anterior and posterior regions of the lens obeys a power law. The lens distribution comprises the anterior and posterior hemispheres with an interface at the locus of the intersection between the anterior and posterior IIS. Each isoindicial surface is determined by a normalized parameter in the anterior and posterior regions, rant and rpos, respectively. The normalization of this parameter, 0 ≤ r ≤ 1, guarantees that n(r) = ns at the lens surface and n(r) = nc at the lens core. The index distribution of the GRIN, as derived in Ref. 1, is then:
where nc is the central refractive index, δn is the difference between the edge and the central refractive index, and p is an age-dependent exponent, for which we kept a constant value of p = 3.3 (average from 20 to 60 years old) for all 200 SyntEyes. The interface of the anterior and posterior regions in the GRIN lens model is a second-order conicoid given by Eq. 8 in reference.1
The GRINCU model5 is an adaptive crystalline lens model that incorporates a gradient index (GRIN) and a gradient radius of curvature of the isoindicial surfaces (GRCU), allowing a non-concentric distribution. This model is similar to the GRIN but uses a different isoindicial parameter. Here, every IIS is determined by the coordinate z0, corresponding to the point where the IIS intersects the z-axis (zero-crossing). As in the GRIN model, the IIS parameter is different for the anterior and posterior lens regions, with z0a corresponding to the anterior and z0p to the posterior region, and are normalized with the anterior and posterior lens thicknesses to guarantee that n(r) = ns at the lens surface and n(r) = nc at the lens core:

Here, nc is the central refractive index, δn=ns - nc is the difference in refractive index between the surface and the center of the lens, ta and tp are the anterior and posterior lens axial thicknesses, and p is the same age-dependent exponent described above. The radius of curvature of the isoindicial distribution inside the lens varies with depth and is determined by the lens’s external geometry and a curvature gradient parameter G.
andwhere Rla and Rlp are the radii of curvature of the isoindicial surfaces in the anterior and posterior regions, rla and rlp are the radii of curvature of the anterior and posterior lens external surfaces, G is the curvature gradient parameter, Qla and Qlp are the conic constants of the anterior and posterior lens surfaces, respectively, and t is the lens thickness. Like the GRIN model described above, the interface between the anterior and posterior regions of the lens is the locus of the anterior and posterior isoindicial shells. The product G(Q+1) gives the total curvature gradient, and its sign determines whether the radius of curvature of the IIS increases or decreases with depth inside the lens. When G(Q+1) is positive, the IIS surfaces’ radii of curvature increase towards the center of the lens; oppositely, when G(Q+1) is negative, the IIS radii of curvature decrease. In the present study, (Q+1) is negative for both the anterior and posterior lens surfaces. Therefore, positive G values yield a reduction in curvature of the IIS towards the center, while negative G values yield an increase in curvature toward the center. Here, we analyze ocular optical performance for five different values of G: +1, 0, -1, -1.5, and -2. Two particular cases are worth mentioning: when G=0, the absence of a curvature gradient results in isoindicial surfaces parallel to the lens’ external surface, and when G=+1, the IIS form concentric conics with the outer surfaces of the lens. The GRIN and the GRINCU lens model with G=+1 have an isoindicial surface distribution concentric with the lens’s external surfaces. While these models share significant similarities and provide comparable optical properties, they are not identical due to their distinct parametrization (r2 for the GRIN and z0 for the GRINCU lens model). This difference in formulation changes the IIS distribution and the shape of the interface between the anterior and posterior regions.

In the GRINCU crystalline lens model, the refractive power of the lens is computed by a sum, P = PGRIN + Psurf, of the powers contributed by the gradient index and the lens’ external surface, PGRIN and Psurf, respectively. The surface power Psurf is calculated with the homogeneous thick lens power equation using nlens = ns, and the GRIN power PGRIN is given by an integral.22
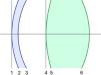
Ray tracingCustomized ray tracing software on Matlab was used to compute the cardinal points and power of the complete eye and lens and the ocular aberrations for each lens model. A wavelength of 555 nm was used for ray tracing with an entrance pupil diameter of 5 mm. Fig. 1 provides a schematic representation of the optical system configuration of the eye. Note that the surface labeled as “entrance pupil” is not its anatomical location but rather a dummy stop to define ray bundles realistically in the simulation. Within the dataset of 200 eyes, each surface’s radius of curvature and thickness varied, while the conic constants remained fixed for all surfaces. The posterior cornea and retina were modeled as spheres. The anterior cornea was modeled as a prolate ellipse (with its major axis stretching along the principal axis). Both the anterior and posterior lens surfaces were hyperbolic, with Q values given in Table 2. Lens tilt and lens shift were incorporated in all eyes studied, but lens toricity (astigmatism) was not considered. The internal refractive index and isoindicial curvature profiles of the GRIN and GRINCU crystalline models were assumed to be continuous. The shape and distribution of the IIS inside the lens are determined by the curvature gradient parameter, G, and the lens’ external geometry: the radii of curvature of the anterior and posterior lens surfaces, rla and rlp, the conic constants for these surfaces, Qla and Qlp, and the lens thickness, t.

The refractive index distribution within the lens is determined by the lens’s external geometry, the curvature gradient parameter G, the exponent p, and the refractive indices of the lens surface, ns, and core, nc. In the GRIN and GRINCU lenses, the refractive index at the center of the lens, nc, was optimized to ensure that the optical power of the crystalline lens matched that of the equivalent homogeneous lens for each of the 200 SyntEyes, enabling a standardized comparison for analysis. The optimization was performed by running Matlab’s function fminsearch on the lens power with a 10-5 diopters tolerance.
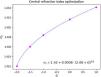
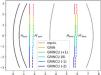
ResultsLens paraxial analysisThe average lens power of all 200 SyntEyes was 22.266 D (SD = 2.043), corresponding to an average focal length inside the eye of 60.064 mm. The average lens central refractive index required to match the equivalent homogeneous lens power was the highest for the GRIN lens model (nc=1.4344) and decreased with more negative values of G, reaching nc=1.4220 for G=-2 (see Fig. 2). The central lens refractive index values were higher than the equivalent refractive index of the homogeneous lens for G=0 and G=+1 and lower for negative values of G. The principal planes of the lens exhibited a slight but noticeable shift in position for the GRIN and GRINCU models as relative to the equivalent lens. Specifically, the principal planes shifted backward for the GRIN and GRINCU model with G=+1 and forward for the GRINCU configuration with G<0 (Fig. 3, Table 3). The distance between the object and image principal planes (HH’) for both the lens and the eye was smaller in the GRIN and GRINCU lens models compared with their equivalent lens counterparts. As did the focal length, the lens power remained constant across the models by design. As a result, the displacement of the principal planes with the varying curvature parameter G led to corresponding changes in the lens’s front and back focal lengths (FFL and BFL).


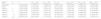
Average results of the paraxial analysis for the lens and eye optical systems.
Standard deviations are shown in parentheses. n, refractive index of the entire lens in equivalent model, central refractive index (nc) in GRIN and GRINCU models; VHlens, distance to object principal plane from anterior vertex of the lens; V’H’lens, distance to image principal plane from posterior vertex of the lens; Peye, optical power of the eye; VHeye, object principal plane position from anterior vertex of the cornea; V’H’eye image principal plane position from posterior vertex of the lens; BFLeye, back focal length of the eye. An expanded.
The average eye power varied between 60.63 D and 60.73 D for the GRINCU lens models with G=+1 and G=-2, respectively. The GRIN and GRINCU models with G=+1 and G=0 showed lower power than the equivalent lens, while the GRINCU models with negative G values exhibited higher power. The principal planes of the eye system were shifted in a similar way as the principal planes of the lens, albeit by a smaller amount, and there was also a shortening of the distance between the object and the image’s principal planes (Table 3).
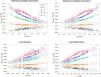
Figs. 4 and 5 compare the difference in optical power between the gradient index lens configurations and the equivalent lens model as a function of lens geometry and GRINCU lens surface power. Fig. 4 compares the GRIN and GRINCU models with G=+1 against each other, as they correspond to remarkably similar IIS configurations. The two models exhibit comparable eye powers, with a maximum difference of <0.1 D. The GRINCU model with G=+1 yields more ocular power than the GRIN model for thicker and more convex lenses. Both lens models demonstrate a closer agreement with the equivalent lens model and with each other when considering thinner and flatter lens geometries. Fig. 5 shows the results specifically for the GRINCU lens models. The curvature gradient parameter plays a significant role in determining the total eye power, with G<0 (IIS curvatures increasing towards the center of the lens) leading to an increase in power and G≥0 (parallel or concentric IIS) resulting in a decrease in power. Once again, a more substantial agreement is observed between the GRIN and GRINCU models and the equivalent lens when considering flatter and thinner lens geometries. In contrast, thicker, more powerful lenses with steeper radii show greater differences with the equivalent lens power.


Difference in eye power between different values of G for the GRINCU model relative to the homogeneous lens power as a function of lens geometrical parameters and GRINCU lens surface power. PGRINCU, GRINCU lens power; Peq, homogeneous lens power; Rla, anterior lens radius of curvature; Rlp, posterior lens radius of curvature; t, lens thickness; Psurf, surface power; mm, millimeters; D, diopters.
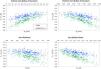
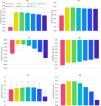
As seen in Fig. 6, the GRINCU models exhibit definite trends regarding the impact of curvature gradient on the ocular wavefront aberrations analyzed: oblique (Z3) and horizontal/vertical (H/V) astigmatism (Z5), defocus (Z4), vertical and lateral coma (Z7, Z8), and primary spherical aberration (Z12). Both astigmatisms are higher for the GRIN and GRINCU lens models than for the equivalent lens, decreasing for increasingly negative values of G (steeper curvature gradients). Defocus changes slightly for the GRIN and GRINCU models relative to the equivalent lens, decreasing relative to G=0 as G becomes more negative. Lateral and vertical coma are reduced in the GRIN and all GRINCU lens models except for G=-2, which shows increased vertical coma (Z7) relative to the equivalent lens. Primary spherical aberration is higher than the equivalent lens for the GRIN and GRINCU models with G≥0 and lower for GRINCU models with G<0.

Aberration coefficients in microns (µm) as a function of curvature gradient, compared with the equivalent and GRIN lens models. The number in parenthesis denotes the G value of the GRINCU lens model. The Zernike coefficient terms numbering follows OSA/ANSI notation. GRIN, gradient index lens model; GRINCU, gradient index, and gradient curvature lens model; Z3, oblique astigmatism; Z4, defocus; Z5, H/V astigmatism; Z7, vertical coma; Z8, lateral coma; Z12, spherical aberration.
A two-sample T-test with unequal variance showed statistically significant differences between the equivalent homogeneous model and the GRIN and GRINCU lens models in both astigmatisms (Z3, Z5), lateral coma (Z8), and spherical aberration (Z12). Vertical coma (Z7) differed from the equivalent lens for the GRIN and GRINCU lenses with G≥0. The same test against the GRIN model revealed substantial differences with all GRINCU lenses, except those with G=+1, for primary spherical aberration. Significant differences in vertical and lateral coma were apparent for negative G values of GRINCU lenses. Notably, no statistically significant disparity in defocus was found across the models.
DiscussionThis study examines the impact of the lens’s internal isoindicial curvature gradient on the performance of 200 randomly generated SyntEyes. Each SyntEye was implemented with three crystalline lens models: equivalent or homogeneous, GRIN, and GRINCU. The GRINCU lens model included five distinct configurations of the curvature gradients of the isoindicial surfaces. Using customized Matlab ray tracing software, we computed the cardinal points, optical power, and Zernike aberration coefficients for each eye model.
The lens power is determined by two main factors: the internal gradient index of the lens and the curvature of its outer and inner surfaces. An IIS configuration where the curvature either decreases from the outer surface towards the center of the lens or stays constant (G≥0) requires a higher contribution from the central refractive index to achieve the desired lens power. Conversely, a configuration where the curvature increases from the outer surface towards the center (G<0) requires a lower central refractive index to achieve the same desired power. A first-order analysis of this balance between the curvature gradient parameter G and the lens central refractive index nc reveals a quadratic relationship (Fig. 2). The coefficient values of this quadratic law will depend on multiple factors, like the target lens power, conic constants, radii of curvature of the external surfaces, and the lens surface refractive index.
In a homogeneous thick lens, the principal planes are positioned closer to the optically most powerful surface, with symmetrical lenses having centered principal planes. In the equivalent crystalline lens, the principal planes are located toward the back of the lens, which has greater curvature. Let us consider the curvature gradient structure inside the lens for the highest and lowest values of G analyzed. If we consider the highest and lowest G values, +1 and -2, the total gradient ranges from +2.13z0 to −4.26z0 in the anterior, and from +0.05(z0−t) to −0.10(z0−t) in the posterior region. The curvature gradient in the anterior region significantly impacts the lens’s optical performance since the IIS curvatures change more drastically with G compared to the posterior region. Altering the curvature gradients results in changes in the power balance between the anterior and posterior regions of the lens, leading to the displacement of the principal planes towards the front of the lens for G<0 and towards the back of the lens for G≥0. These findings align with previous research indicating that an isoindicial curvature gradient induces a shift in the principal planes compared to a homogeneous lens.23
The displacement of the lenticular principal planes translates into a slight displacement of the ocular principal planes. The total power and principal planes are computed as a function of the corneal power, lenticular power, and distance H1′H2‾ between the image principal plane of the cornea H1′ and the object principal plane of the lens H2 (see Eq. 4). Since the position of the principal planes of the cornea does not change regardless of the lens model used, a change in the position of the principal planes of the lens results in a shift in the principal planes of the eye. Moreover, because Pcornea and Plens are kept constant for each SyntEye, this distance also determines the variation in ocular power across lens models.
where naq is the refractive index of the aqueous humor and Peye is the ocular refractive power.
The average Zernike aberration coefficient values obtained for the models and curvature gradient configurations considered in this study are presented in Table S2 in the supplementary material.
It is commonly accepted that the internal optics significantly balance or compensate for the cornea’s spherical aberration (Z12) and coma (Z7, Z8). Several studies analyzing the distinct contributions of the cornea and the lens to the overall ocular spherical aberration agree that the lens compensates for corneal spherical aberration13,24,25 and that the gradient index plays a significant role in the crystalline lens spherical aberration at all ages, especially in young eyes.14,26 We found that the GRIN and GRINCU lens models with a negative curvature gradient (G≥0) increase spherical aberration relative to the equivalent lens model, and GRINCU lenses with a positive curvature gradient (G<0) decrease it. The interplay of the gradient index and curvature gradient inside the lens may help explain the decoupling between the lenticular and corneal spherical aberration that occurs with aging.
In real eyes, astigmatism (Z3, Z5) is caused by toric corneal and lenticular surfaces and tilted or displaced lenses. As the main focus of this study is the impact of the lens’ internal properties on ocular performance, we modeled the corneal and lenticular surfaces as rotationally symmetric conics to reduce computational time. We did, however, incorporate lens tilt and shift. The GRIN and GRINCU lenses exhibited higher oblique (Z3) and H/V astigmatism (Z5) than the equivalent lens. More positive curvature gradients (IIS surfaces curving more towards the center) yielded increasingly lower values for both Z3 and Z5. An in vivo study on young emmetropic eyes25 revealed that the lens compensated for corneal horizontal/vertical astigmatism but not oblique astigmatism. Another study focusing on adult eyes27 indicated that corneal and lenticular astigmatism offset each other in young individuals, a balance that diminishes with age. More recently, research on the role of the lens gradient index profile and ocular aberrations using a theoretical age-dependent GRIN model26 found that the lens gradient index contributes to corneal horizontal/vertical astigmatism in young eyes but compensates for it in older eyes. Because the present work is based on a statistical model, no direct comparison is possible for specific ages. However, these findings propose that the gradient index and curvature have distinct contributions to total ocular astigmatism, and their changes with age may help diminish it.
Coma (Z7, Z8) results from the principal planes being curved surfaces rather than flat planes.28 Vertical coma arises from the different transverse magnifications of the rays passing through the lens’s center and periphery. Lateral coma, on the other side, results from axial and peripheral rays focusing at different distances from the lens and is closely related to spherical aberration (Z12). We found that the lens gradient index reduced both vertical and lateral coma in the GRIN and GRINCU models relative to the equivalent lens. However, while the curvature gradient further enhances the reduction in lateral coma (Z8), it amplifies vertical coma (Z7), becoming higher than the equivalent lens for G=-2. One possible explanation for this effect is that the isoindicial curvature gradient modifies the curvature of the lens’s principal planes, increasing vertical coma with increasing curvature. Past studies on aberrations using eye models indicated that the lens compensates for corneal vertical coma,13 and the gradient index compensates for corneal horizontal coma.26 The same in-vivo study mentioned above25 showed that the lens has an additive effect on the corneal vertical coma but compensates for its horizontal coma, which aligns with our results for more negative curvature gradient parameters.
When analyzing SyntEyes samples with identical biometric data, the interplay between the lens’s gradient index and IIS curvature gradient alters ocular power, principal planes, and aberrations, underscoring the lens’s internal properties’ crucial role in optical performance. A positive curvature gradient towards the lens center enhances eye power and reduces astigmatism, lateral coma, defocus, and spherical aberration across the entire eye system.
PrecisThis study compares the optical performance of different gradient-index crystalline lens models. Using computer ray tracing on 200 SyntEyes, we found that the lens’ internal gradient of radius of curvature affects the optical properties of both the lens specifically and the eye as a whole.
FundingThis research was funded by the European Union’s Horizon 2020 research and innovation program under the Marie Skłodowska-Curie grant agreement No 956720.
The authors have no conflicts of interest to declare.


