
This study tested the assumptions that, within a large sample of New Zealanders aged 55 to 70, those who identified themselves as having a diagnosed vision impairment would be markedly older, disproportionately female, worse-off economically, in poorer physical and mental health, have less social support and be more socially isolated than those who had not.
MethodAnalysis was conducted based on responses from the Health, Work and Retirement Study (a large population-based study). The sample was split in two groups: those who identified themselves as having visual impairment (n=411) and those who did not (n=5564) and was compared on age, gender, economic standing, physical and mental health, social support and social isolation.
ResultsNo significant differences were found on age or gender. A significant difference was found on the combined dependent variable representing the economic, health and social status of the groups: F(5, 5969)=18.10, P<0.001; Wilks’ Lambda=0.98. When considered separately, the groups were found to differ on all five variables included: economic standing F(1, 5973)=26.81, P<0.001; physical health F(1, 5973)=59.36, P<0.001; mental health F(1, 5973)=25.89, P<0.001; social support F(1, 5973)=9.70, P=0.002; and social isolation F(1, 5973)=39.20, P<0.001.
ConclusionThe visually impaired group was found to be worse-off economically, in poorer physical and mental health, to have less social support and to be more socially isolated than their non-visually impaired peers.
Este estudio analizó la validez de la hipótesis de que en una muestra amplia de neocelandeses de entre 55 y 70 años que refieren haber sido diagnosticados de un problema visual tendrán, en promedio, una edad notablemente superior, serán en mayor medida (desproporcionadamente) mujeres, estarán en peor situación económica, tendrán una peor salud, tanto física como mental, contarán con un menor apoyo social y se sentirán más aislados socialmente que aquellos que no padecen ninguna deficiencia visual.
MétodosEl análisis se realizó partiendo de las respuestas recabadas en el marco de un amplio estudio realizado en Nueva Zelanda y denominado Estudio sobre Salud, Trabajo y Jubilación (en inglés, Health, Work and Retirement Study). La muestra inicial se dividió en dos grupos: aquellos participantes que decían padecer una deficiencia visual diagnosticada (n=411) y aquellos que no padecían ninguna (n=5.564). Se realizó una comparación de ambos grupos según edad, sexo, situación económica, salud física y mental, apoyo social y aislamiento social.
ResultadosNo se encontraron diferencias significativas entre los dos grupos en lo que respecta a edad o sexo. Sin embargo, se halló una diferencia significativa entre ambos según la variable dependiente combinada que representa la posición económica, el estado de salud y la situación social de los participantes: F(5, 5969)=18,10 P<0,001; Wilks’ Lambda=0,98. Cuando se analizaron por separado, los dos grupos también resultaron ser diferentes en lo que respecta a las cinco variables estudiadas: situación económica F(1, 5973)= 26,81 P<0,001; salud física F(1, 5973)=59,36 P<0,001; salud mental F (1, 5973)=25,89 P<0,001; apoyo social F(1, 5973)=9,70 P=0,002; y aislamiento social F(1, 5973)=39,20 P<0,001.
ConclusionesSe observó que el grupo de los deficientes visuales presentaba una peor situación económica, una peor salud física y mental, contaba con un menor apoyo social y se sentía más aislado socialmente que los participantes que no padecían deficiencias visuales diagnosticadas.
The number of persons in New Zealand who report significant difficulty with seeing is increasing as its population continues to age.1 In 2002, for example, over 81,000 persons out of a population of just below 4 million indicated that they had difficulty seeing ordinary newsprint and/or faces from across the room, even when wearing corrective lenses, to the extent that they required some assistance in functioning.2 This number constitutes an increase of approximately 7,000 relative to that reported in the national census of 1998.1 This increase reflects the fact that the most significant growth in this country's population is occurring in the oldest age groups. These groups have the highest incidence and prevalence of vision impairment.3,4
Studies of older persons living in the community consistently indicate that those with vision impairments have a high rate of functional disability (i.e., in reading and in performing activities of the daily living, including mobility).5 In addition, they are generally found to be older and disproportionately female,4,6 of lower socioeconomic status,7 socially isolated8,9 and they are also found to exhibit both poorer general and mental health10,11 than their non-visually impaired peers.
Most studies on aging and vision impairment are conducted with persons that are 65 years of age or older, they include disproportionately high numbers of the very old and they tend to focus on functional deficits and psychological well being of this population.5 As such, less is known about the younger segment of the old population (i.e., later midlife or young-old) in general and, more specifically, about their relative standing in terms of economic, health and social factors. We decided to take advantage of the data collected for a study on the factors affecting the transition from work to retirement12 on a large sample of New Zealanders aged 55 to 70 to learn more about this age group.
Specifically, we wanted to test the assumptions that those who identified themselves as having been diagnosed with a vision impairment would be markedly older, disproportionately female, worse-off economically, in poorer physical and mental health, would have less social support and would be more socially isolated than those who had not.
MethodsStudy PopulationThe sample used for this analysis was drawn from participants of a large population-based study, conducted between March and July of 2006, and known as the Health, Work and Retirement (HWR) Study.12 The HWR study was designed to identify the influences on health and wellbeing in later midlife (55 to 70 years) that lay the basis for community participation and health in later life, and ultimately independent retirement.12 Study procedures were approved by the Massey University's Human Ethics Committee and carried out in accordance with tenants of the Declaration of Helsinki.
The HWR study consisted of both a postal survey and face-to-face interviews with selected groups of participants. A postal survey was sent to 12,527 persons randomly selected from the New Zealand Electoral Roll, a compulsory voting register that currently covers 98% of the adult population of the country. The number of returned surveys was 6,662, resulting in an overall return rate of 53%.13 This represents approximately 1% of the estimated population within this age group (i.e., 609,000) living in New Zealand at the time of the study. Of those who replied, 8.4% identified themselves as “having been told by a doctor, nurse or other health worker that they had a sight impairment that cannot be corrected by glasses· (i.e., diagnosed visual impairment). This question (i.e., “have you been told by a doctor…”) was selected as being somewhat more stringent than other commonly used self-report questions2,5 and therefore hopefully less likely to include those who were simply unhappy with their current prescription or experiencing presbyopia.14 Responses to this item were used to split the sample between those who were considered to have been diagnosed as having a visual impairment and those who were not (i.e. the rest of the sample).
ProceduresThe analysis reported here only utilized the responses from the postal survey of the HWR. Of the 6,662 that were returned, 5,975 (90%) were complete enough to be included in this study.
A dummy variable of vision impairment (n=411) / no vision impairment (n=5,564) was established to allow us to compare groups on selected parameters from the HWR study, in order to test the assumptions that those in the vision-impairment group would be markedly older, disproportionately female, worse-off economically, in poorer physical and mental health, would have less social support and would be more socially isolated than those who were in the non-visually impaired group.
The questions and measures used for this analysis were taken from the 2006 HWR Survey. The questionnaire was piloted prior to its use in the survey.15 The questionnaire included demographic questions, an economic indicator and measures of health status and social interaction utilizing individual questions and three scales commonly used for these purposes.16 The demographic questions used for this study included age, gender, and identification of diagnosed conditions selected from an 18-item health and disability checklist.16 The three scales incorporated into the questionnaire and used in this study (The New Zealand Economic Living Standards Indicator [ELSI],17 SF-36 Health Survey [SF-36],18 and the Social Provision Scale [SPS]19) commonly appear in the social sciences literature and have well established validity for the purposes used here.17-19
The ELSI served as measure of economic status. The ELSI assesses self-reported ownership restrictions (e.g. ‘do you have or have access to home contents insurance?’), social participation restrictions (e.g. ‘do you have holidays away from home every year?’), and ratings of material standard of living (e.g. ‘how would you rate your material standard of living?’)17. A total score that reflects one's overall economic standing is calculated, which ranges from severe hardship (1) to very good (7). Measures of physical and mental health were taken from the SF-36. The SF-36 is a standardized and commonly used health questionnaire consisting of 36 items and 8 sub-scales.18 All scores are weighted, so that they may be interpreted in the same direction (i.e., higher scores mean better health). The subscales have been combined to provide two summary scores corresponding to physical and mental health, respectively. These scores are normed and standardized, so that the population mean is 50. The SPS and a single-item of one's feelings of isolation taken from the Quality of life in New Zealand's Largest Cities’ Survey20 were used to assess social support and isolation respectively. The question posed in the latter was ‘In the last 12 months, how often have you felt lonely or isolated?’ The options for responding were 1=always, 2=most of the time, 3=sometimes, 4=rarely, 5=never. SPS is a measure of the emotional support received from one's social network.19 This measure has six sub-scales that assess separate but highly correlated perceptions of support. These scores are combined to obtain a single measure of perceived support. The higher the score, the more one believes that their social network actually provides support. All three scales included in this questionnaire17-19 were found to have good internal consistency, with Chronbach's alpha coefficients being above the acceptable 0.7021 in all cases (i.e. alpha=0.83 for the ELSI, 0.88 for the Physical Health and 0.86 for the Mental Health summary scores of the SF-36, and 0.89 for SPS).
Simple descriptive statistics consisting of mean (Mean), standard deviation (SD) or percentage (%) was used to describe each group's response on the measures of interest. The number of responses was designated N. One-way analysis of variance (ANOVA) was used to compare the groups on age. Chi Square (χ2) was used to compare the proportion of males to females in each group. Missing data was reported but not used in the analysis. A minimum level of significance was set at P=0.05 for these initial comparisons. A one-way between groups multivariate analysis of variance (MANOVA) was performed to compare the groups on the five measures used to assess economic, health and social status of the participants. Missing data was replaced with mean scores as the most conservative option.22 Preliminary assumption testing was conducted to check for normality, linearity, univariate and multivariate outliers, and homogeneity of multicollinearity. The assumptions of normality and homogeneity were violated, as it is commonly the case with large sample sizes. These violations could lead to an increased chance of making a Type I error.22 Thus, a Bonferroni adjustment was made to the alpha level to reduce the probability of this occurring,21 as recommended.21,22 As a result, for these comparisons the minimum level of significance was set at P<0.008 (i.e., 0.05/6=0.008). No other assumptions were violated and no other adjustments were required. All analyses were conducted using the Statistical Package for the Social Sciences v.17.0 (SPSS Inc, Chicago, IL)
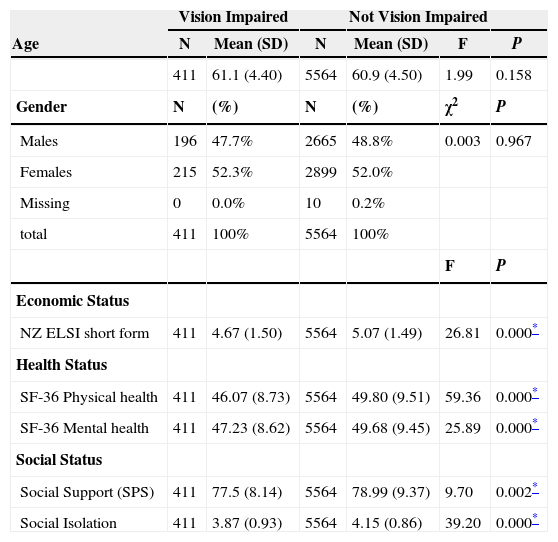
ResultsAs can be seen in table 1, no significant differences were found between the groups on age or gender. A significant difference was found between the groups on the combined dependent variable representing the economic, health and social status of the groups: F(5, 5969)=18.10, P<0.001; Wilks’ Lambda=0.98; partial eta squared (η2)=0.02. When considered separately, the groups were found to differ on all five variables assessed: economic standing F(1, 5973)=26.81, P<0.001, η2=0.004; physical health F(1, 5973)=59.36, P<0.001, η2= 0.01; mental health F(1, 5973)=25.89, P< 0.001, η2=0.004; social support F(1, 5973)=9.70, P=0.002, η2=0.002; and social isolation F(1, 5973)=39.20, P< 0.001, η2=0.007. An inspection of the mean scores reveals that the visually impaired group had a lower mean score on the ELSI (Mean=4.67, SD=1.50 vs Mean=5.07, SD=1.49), the physical health (Mean=46.07, SD=8.73 vs Mean=49.80, SD=9.51) and the mental health summary scores (Mean=47.23, SD=8.62 vs Mean=49.68, SD=9.45) of the SF-36, the total score for SPS (Mean=77.5, SD=8.14 vs Mean=78.99, SD=9.37) and the social isolation measure (Mean=3.87, SD = 0.93 vs Mean= 4.15, SD=0.86) than the non-visually impaired group. In all cases, a lower score indicated a more negative result than a higher score. (Table 1)
Demographic, economic, health and social status of those who have self-identified as having a vision impairment that cannot be corrected with normal glasses, compared with those who have not
| Age | Vision Impaired | Not Vision Impaired | ||||
| N | Mean (SD) | N | Mean (SD) | F | P | |
| 411 | 61.1 (4.40) | 5564 | 60.9 (4.50) | 1.99 | 0.158 | |
| Gender | N | (%) | N | (%) | χ2 | P |
| Males | 196 | 47.7% | 2665 | 48.8% | 0.003 | 0.967 |
| Females | 215 | 52.3% | 2899 | 52.0% | ||
| Missing | 0 | 0.0% | 10 | 0.2% | ||
| total | 411 | 100% | 5564 | 100% | ||
| F | P | |||||
| Economic Status | ||||||
| NZ ELSI short form | 411 | 4.67 (1.50) | 5564 | 5.07 (1.49) | 26.81 | 0.000* |
| Health Status | ||||||
| SF-36 Physical health | 411 | 46.07 (8.73) | 5564 | 49.80 (9.51) | 59.36 | 0.000* |
| SF-36 Mental health | 411 | 47.23 (8.62) | 5564 | 49.68 (9.45) | 25.89 | 0.000* |
| Social Status | ||||||
| Social Support (SPS) | 411 | 77.5 (8.14) | 5564 | 78.99 (9.37) | 9.70 | 0.002* |
| Social Isolation | 411 | 3.87 (0.93) | 5564 | 4.15 (0.86) | 39.20 | 0.000* |
F: F statistic; P: statistical significance.
The first two assumptions, that the visually impaired group would be markedly older and disproportionately female were not found to hold true in this study. This is not too surprising since the sample only covered a restricted age band (55 to 70). The highest rates of vision impairment occur in the oldest age group4 and, as a result, it will typically skew the mean age of the visually impaired group in more open samples. The disproportionate number of visually impaired females found in these samples is most likely an artifact that is due to the age of the group.5 As such, neither was it likely to be seen in this sample. However, all the other assumptions concerning the visually impaired group were found to be true. They were found to be less well-off economically, in poorer physical and mental health, they were found to have less social support available to them and they felt more isolated and lonely than their non-visually impaired peers. This was somewhat surprising, as many of these disadvantages are associated with the fact that visual impairment occurs disproportionately among the oldest age groups,4,6-9 which was simply not the case in this sample.
The differences found between the groups were consistent but not very large. In fact, the effect size for each of the significant findings was very small, ranging from 0.002 for social support to 0.010 for physical health. The latter represents only 1% of explained variance and the former two-tenths of 1%. The magnitude of these differences can be illustrated in terms of economic standing, where those with visual impairment had a mean score of 4.67 on the ELSI, while the rest of the sample had a mean score of 5.07. A score of 4 on the ELSI is classified as ‘fairly comfortable’ and a 5 as ‘comfortable’. Those with a score of 4 lack 4% of the basics, have 47% of comforts/luxuries, have 4% of the financial problems listed, 7% of the accommodation problems and lack only 1% of the basics required for children, while those with a score of 5 on the ELSI lack 2% of the basics, have 57% of the comforts/luxuries, have 2% of the financial problems listed, have 5% of the accommodation problems and lack less than 1% of the basics required for children.23
Likewise, regarding health scores, those with visual impairment had a mean of 46.07 and 47.23 on the physical and mental summary scores, respectively, of the SF-36, compared to means of 49.80 and 49.68 for those who were not visually impaired. These are not low scores, as the SF-36 is normed and standardized so that the population mean is 50.18 Similarly, the mean score with regard to social provisions is relatively high19 for both groups, whereas the mean social isolation score is relatively low,20 yet as before, those who report having been diagnosed as having a visual impairment consistently score lower than those who did not. As this is not likely to be due to age, gender or poverty, it may support the assumption that it is in fact due to the presence of vision impairment itself, or at least to the related health conditions which may underlie it.
While this study has made some contributions to our understanding of these issues, there are indeed a number of limitations which must be considered when interpreting these findings. First of all, the group of people identifying themselves as having been diagnosed as having sight impairment may not necessarily be representative of the range of persons with vision impairments in this age group and this country as they were self-identified through a mail survey. Thus, a number of those with the greatest vision loss may have been systematically left out of this study due to the medium used to collect the data. As such, the findings here may be considered indicative only and may in fact be on the conservative side. Further research that relies on a representative sample is required to know more. Secondly, as is the case with other self-reported measures, we are informed of neither the degree nor the cause of vision impairment, which means that we are subject to limitations regarding what can be deduced about cause and effect.14
The Health, Work and Retirement Study was funded by the New Zealand Health Research Council. The authors declare that they have no conflicts of interest.


