


To assess the Meibomian glands, ocular surface and tear function in patients with type 2 diabetes, and study the correlation between these conditions.
MethodsProspective study of 76 males, 37 with type 2 diabetes with an average of duration between 7±5 years, and 36 males from control group. After completing an ocular surface disease index (OSDI) questionnaire, the non-invasive tear film break-up time (NIBUT) and the tear lipid layer pattern was performed using interferometry system and tear meniscus height/TMH. Ocular surface was studied with lissamine green staining and morphology of the glands with evaluation of Marx's line (lid margin abnormalities); meibomian secretion was expressed and was also assessed the quality. The results were analyzed using the statistical Kruskal–Wallis and Mann–Whitney, and correlations by Spearman Rho.
ResultsThe mean age was 59±8 years; 71% of participants presented MGD (76% diabetics and 67% controls). OSDI were significantly higher (p=0.01) in the diabetic group. A positive correlation was found between glycemia and symptoms (p=0.0005) and strong correlation between Hb1Ac and OSDI in MGD. NIBUT was lower in the control group (2.47±1.2s) than for the diabetic group (2.9±1.2s), with a significant inverse correlation (52.22%) with MG inflammation.
ConclusionsMGD in type 2 diabetic patients is more severe compared with nondiabetic patients. Longer duration of diabetes is associated with major symptoms and changes in MG. Diabetic group showed major changes in lids and tear function, accounting for evaporative dry eye and presenting a high degree of correlation with MG inflammation and obstruction.
Evaluar las glándulas de Meibomio, la superficie ocular y la función de la lágrima en pacientes con diabetes tipo 2, y estudiar la correlación entre estas situaciones.
MétodosEstudio prospectivo de 76 varones, 37 de ellos con diabetes tipo 2, con una media de duración de entre 7±5 años, y 36 mujeres como grupo control. Tras completar el cuestionario del índice de enfermedad de la superficie ocular (OSDI), se obtuvieron el tiempo de ruptura lagrimal no invasivo (NIBUT) y el patrón de la capa lipídica de la lágrima utilizando interferometría y altura del menisco lagrimal/AML. Se estudió la superficie ocular con tinción verde de lisamina y la morfología de las glándulas con evaluación de la línea de Marx (anomalías del margen del párpado); se expresó la secreción de las glándulas de Meibomio, así como su calidad. Los resultados se analizaron utilizando la pruebas estadísticas Kruskal-Wallis y Mann-Witney, y las correlaciones con Rho de Spearman.
ResultadosLa edad media fue de 59±8 años; el 71% de los participantes presentaron DGM (76% diabéticos y 67% controles). OSDI fue significativamente superior(p=0,01) en el grupo diabético. Se encontró una correlación positiva entre glucemia y síntomas (p=0,0005), y una fuerte correlación entre Hb1Ac y OSDI en DGM. NIBUT fue inferior en el grupo control (2,47±1,2s) que en el grupo diabético (2,9±1,2s), con una correlación inversa significativa (52,22%) con la irregularidad del borde palbebral y queratinización del OM.
ConclusionesDGM en los pacientes con diabetes tipo 2 es más grave, en comparación con los pacientes no diabéticos. La mayor duración de la diabetes se asocia a síntomas mayores y cambios en la GM. El grupo diabético reflejó cambios mayores en los párpados y la función de la lágrima, lo cual supone ojo seco evaporativo, y un alto grado de correlación con irregularidad del margen palpebral y obstrucción de la GM.
The international workshop on Meibomian gland dysfunction (MGD) has defined this condition as “a chronic and diffuse anomaly of Meibomian glands, commonly characterized by obstruction of the terminal duct and/or qualitative/quantitative changes in glandular secretion”. This can cause an alteration of the tear film, symptoms of eye irritation, clinically apparent inflammation and ocular surface diseases.1,2
Diabetes is a very common chronic disease first cause of mortality. The prevalence of type 2 diabetes has increased significantly in recent decades.3 Ocular disorders are common in diabetic patients, such as retinopathy, corneal epithelial erosions, and dry eye. The current report in dry eye, the workshop (DEWS II) indicated that diabetes may be a risk factor of dry eye4 and the symptoms are worse than nondiabetic people.5 The Meibomian gland produces lipids and proteins which form the outer layer of the tear film; these lipids decrease evaporation in MGD and promote instability of the tear film, increasing cause of evaporative dry eye and may play an important role in the severity of the symptoms according with the International Workshop on Meibomian Gland Dysfunction1,2,5 and the DEWS II.6,7 Meibomian gland secretion is affected by the abnormality of insulin secretion8 in spite insulin resistance/deficiency and hyperglycemia impacts the sterols and lipid receptors in the glands. MGD prevalence is almost 60% of male population, with abnormal function in the gland, and dry eye symptoms.9,10 In Colombia we don’t have enough clinical evidence about the relationship between diabetes and Meibomian gland dysfunction, so we conducted a prospective study that aimed to investigate Meibomian gland and tear film function in type 2 diabetic patients.
Materials and methodsSubjectsThe study was approved by the Ethical committee of the Valencia University in Spain and the Ethical committee of the Salle University, Optometry department, Bogotá-Colombia. All subjects enrolled gave informed consent prior to their inclusion in the study. All the participants must show the blood glucose levels; the normal limit of glycemia<110mg/dl was considered in all the individuals. The hemoglobin Hb1Ac more than 6.4% was associated with autonomic neuropathy.11–13
Thirty-seven men with type 2 diabetes and thirty-six non-diabetic, were recruited into the study. Both eyes of each patient were evaluated. There was no significant difference in age and gender between the two study groups. The inclusion criteria were as follows: at least 40 years old males to participate in the study, Hb1Ac and glycemia test value (last month). The exclusion criteria were as follows: active ocular infection or inflammation, previous ocular surgery, no permanent topical use of ophthalmic drugs or artificial tears, and a history of cranial nerve injury or any other diseases known to affect the tear film.
Each patient completed an ocular surface disease index (OSDI) questionnaire for the assessment of ocular surface symptoms. Subjects were considered symptomatic if the value was ≥13.5.14
All patients underwent a series of ocular surface examinations in the following order: lipid layer thickness (LLT), noninvasive breakup time (NIBUT), tear meniscus height (TMH), corneal fluorescein staining, green lisammine dye, border lid morphology, Marx's line staining, grading of meibomian gland loss, and expression of meibum. All the patients were examined by the same physicians.
Evaluation of tear filmThe lipid layer tear and the NIBUT score was made with interferometry, through a portable tearscope Polaris. The Lipid Layer Thickness (LLT) was determined with the Guillon score15,16 based in interferometric images, with colors patterns associated to thickness of the tear film. The shape and color of the interferential patterns will define the thickness of the lipid layer. In this way, lipid patterns corresponding to increasing lipid layer thickness were subsequently assigned numerical lipid layer grades 0–5, for the purpose of statistical analysis, as 0 (absent), 1 (open meshwork), 2 (closed meshwork), 3 (wave), 4 (amorphous), or 5 (colored fringes).
The non-invasive tear film break up time (NIBUT) was calculated in seconds after placing the placid pattern of polaris® last complete blink. The analysis of the results was based in the value below 10s, considered abnormal.16,23
TMH measurements were performed using a commercial AS-OCT (SS-1000; Tomey Corp, Nagoya, Japan). Cross-sectional images of the lower TMH were taken vertically, across the central cornea, in every subject. TMH was defined as the line distance from the fluid surface of the meniscus junction to the lower eyelid–meniscus junction. The lower TMH values were calculated using the cross-sectional AS-OCT images. The normal values considered was >200μm.17
The exposed ocular surface area was graded using the Van Bijsterveld scheme with Fluorescein Staining (FL). The ocular surface area was divided into 3 regions (central, nasal and temporal), and each zone was scored on a scale of 0–3, according to the number of staining points observed.18 The score obtained for each region was added to obtain the final score. The total score was maximum 9, and scores greater than 3.5 were considered abnormal. Conjunctival staining using lissamine green was performed grading of each temporal and nasal conjunctival staining according to the Oxford score (0–5), evaluating the whole areas of temporal conjunctival, corneal and nasal conjunctiva.19
Diagnosis of Meibomian Gland dysfunctionThe morphology of meibomian glands was evaluated with the Marx's line through the yamaguchi score grading.20 For the study, the Marx's line represented a clinical parameter of glandular inflammation; strips of lissamine green were applied to the lower tarsal fornix (GreenGlo®, HUB Pharmaceuticals, LLC) previously moistened with 0.9% physiological saline solution.21 The inflammation parameter was analyzed based on the observation of the line and its displacement according to the meibomian orifices.20 The presence of continuity in the line along the holes, symbolizes a normal state of these, while the more displacement toward the Meibomian orifices until penetrating them, mean the greater degree of glandular inflammation.
To graduate the score, the palpebral margin is divided into three portions: external portion, middle portion and internal portion, and each portion was evaluated separately from 0 to 3 points, for a total of 9 points.20,21 The clinical significance of this test is an indication of the degree of meibomian inflammation and is determined by the score:
- •
Between 0 and 3 points: Absent or mild meibomian glandular inflammation
- •
Between 4 and 6 points: moderate meibomian glandular inflammation
- •
Between 7 and 9 points: severe meibomian glandular inflammation
The number of expressible meibomian glands was quantified using a double cotton applicator. A stable pressure was applied to the temporal, the central, and the nasal third of the lower eyelid, and the number of secretable glands was recorded.17 The degree of ease in expressing meibomian secretion was evaluated semi-quantitatively on a scale from 0 to 3: Grade 0, clear meibum is easily expressed; Grade 1, cloudy meibum is expressed with a mild pressure; Grade 2, cloudy meibum is expressed with more than moderate pressure; and Grade 3, meibum cannot be expressed even with hard pressure.22 The meibum quality was graded as follows: grade 0, clear; grade 1, cloudy; grade 2, cloudy with granular debris; and grade 3, thick and toothpaste-like.25
Lid margin abnormalities were scored according to the following 4 signs: telangiectasies, lid margin irregularity, obstructed meibomian gland orifices, and anterior or posterior displacement of the muco-cutaneous junction.23,24
Statistical analysisThe data were analyzed using SPSS 20.0 (SPSS, Chicago, IL). Results of the descriptive statistics are presented as the mean±standard deviation or median. For data that were normally distributed, the independent-samples t-test was employed to compare the results of the diabetic group and non-diabetic subjects. The correlations between the duration of diabetes, meibomian gland function, and tear film variables in the diabetic group were studied using Pearson's correlation coefficient. For data that were not normally distributed, the Mann–Whitney test was used to compare the results of the two groups. The correlations between the duration of diabetes, meibomian gland function, and tear film variables were studied using Spearman's correlation coefficient.
ResultsEighty males were recruited and 73 were included; 37 with type 2 diabetes and 36 controls. The mean age was 59±8 years, with no significant difference in age distribution between groups: diabetes mean age 59±7.7 and control group mean age 58.5±7.4. The disease time progression was 7.2±5 years; the HbA1c mean was 6.5% with statistically significant differences between groups, higher in type 2 diabetes (6.8±0.7; p=0.002). The mean of blood glucose was 123mg/dl, higher in type 2 diabetes (171±29mg/dl; p=0.007).
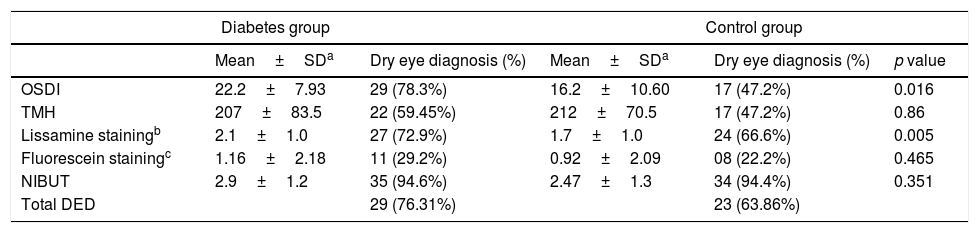
Dry eye disease was higher in the type 2 diabetes group, with 76.31% with a significant difference between the 2 groups; OSDI were significantly higher in the diabetic group (p=0.0002). Compared with control group, the OSDI was significantly higher in diabetes group (22.2±7.93; p<0.01), while the NIBUT was non significantly lower (2.6±1.2; p>0.05). The corneal fluorescein staining present minimum staining points less than 3.5 on the Van Bijsterveld scale, higher in diabetic group (1.16±2.18), than in control group (0.92±2.09) with not significative differences between groups (p>0.05). There was significant differences in conjunctival staining grade between diabetic (2.1±1.0) and control group (1.7±1.0) (p=0.005). All subjects underwent clinical assessment are shown in Table 1.
Diagnosis of dry eye.
| Diabetes group | Control group | ||||
|---|---|---|---|---|---|
| Mean±SDa | Dry eye diagnosis (%) | Mean±SDa | Dry eye diagnosis (%) | p value | |
| OSDI | 22.2±7.93 | 29 (78.3%) | 16.2±10.60 | 17 (47.2%) | 0.016 |
| TMH | 207±83.5 | 22 (59.45%) | 212±70.5 | 17 (47.2%) | 0.86 |
| Lissamine stainingb | 2.1±1.0 | 27 (72.9%) | 1.7±1.0 | 24 (66.6%) | 0.005 |
| Fluorescein stainingc | 1.16±2.18 | 11 (29.2%) | 0.92±2.09 | 08 (22.2%) | 0.465 |
| NIBUT | 2.9±1.2 | 35 (94.6%) | 2.47±1.3 | 34 (94.4%) | 0.351 |
| Total DED | 29 (76.31%) | 23 (63.86%) | |||
The Marx's line, evaluated the palpebral marginal zone, with moderate irregularity and retroplacement of orifices in most of the participants (mean 3.0±2.3), higher in patients with diabetes (3.8±2.1) than control group (1.4±0.7) with significant differences (p<0.05) between groups.
The glandular orifices with keratinization and obliteration observed in the group of diabetics were higher (64.3–67.9%) than control group (29.3–45.1%) with statistically significant differences (p<0.000) between groups (Fig. 1).
 Extension of green lissamine toward meibomian orifices: Marx")
The viscosity of meibomian secretion was type toothpaste (grade 4) in the majority of participants with diabetes 56.7% and 41.6% granular viscosity (grade 3) in control group; there were differences between groups with statistical significance (K–W: p=0.0001). The non-expressability in meibomian orifices denotes the degree of obstruction of the glands, as long as the ease of Meibomian expression is less. The results of the study show a mean score of 1.56 (SD±1.0) with clinically significance of obstruction. The group of diabetics presented the highest degree of obstruction in 27.1% of the participants, with no expressive gland. The differences between groups show statistical significance (K–W: p=0.0001).
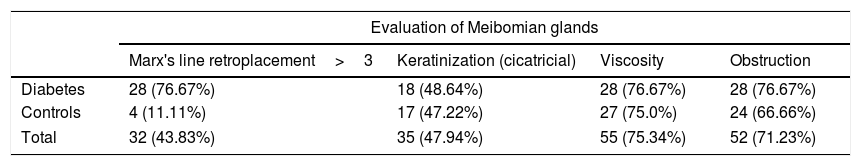
Table 2 presents the distribution of clinical features for evaluation of Meibomian glands. 52 participants presented MGD (71.23%) higher in diabetic participants (75.6%) than control group (66.66%) with statistically significant differences between groups (p<0.005).
Results of classification of DGM.
| Evaluation of Meibomian glands | ||||
|---|---|---|---|---|
| Marx's line retroplacement>3 | Keratinization (cicatricial) | Viscosity | Obstruction | |
| Diabetes | 28 (76.67%) | 18 (48.64%) | 28 (76.67%) | 28 (76.67%) |
| Controls | 4 (11.11%) | 17 (47.22%) | 27 (75.0%) | 24 (66.66%) |
| Total | 32 (43.83%) | 35 (47.94%) | 55 (75.34%) | 52 (71.23%) |
Spearman correlation analysis showed a positive correlation between glycemia and OSDI (r=0.350; p=0.034) in 60–64 years old subjects (p=0.0005). OSDI in diabetes group presented a significant correlation with the Hb1Ac (r=0. 27; p=0.003) (Fig. 2).

The highest level of Hb1Ac presented positive and significant correlation coefficient with the Marx's line in the lids of diabetics participants (r=0.33; p=0.006). The lid margin abnormality (hyperkeratinisation, retroplacement of Meibomian orifices, irregularity of lid margin and obliteration score, was significantly higher in the diabetic group than in the nondiabetic group (p=0.0005) with toothpaste's type secretions (75%); meibomian secretion type toothpaste was significant correlated with the greatest degree of severity of MGD (r=0.76; p<0.001). Diabetes had a significant and strong correlation between viscosity meibum secretion and clogging of the meibomians holes (r=0.66; p<0.001).
Fig. 3 represents significant and inverse correlation between NIBUT and Marx's line (r=−0.569; p=0.000), meaning the asociation between lid border‘s irregularity and the decrease in break up time. NIBUT showed moderate correlation with fluorescein staining in diabetics participants (r=−0.27; p=0.022).

Meibomian secretion tooth paste's type in diabetics participants presented significative correlation with conjunctival staining with lissamine green expressing inflammation of conjunctival epithelium (r=0.32; p=0.006).
DiscussionThese results suggest high correlation between type 2 diabetes and Meibomian gland dysfunction, with evaporative dry eye. The participants diagnosed with MGD showed lid margin abnormalities, meibum expressibility abnormal, conjunctival stain with lissamine green and keratitis were found more significantly worse in patients with type 2 diabetes.34
Diabetes is a metabolic and chronic disease with a current high global prevalence of 422 million of people (WHO, 2016). Nevertheless the angiopathic and neuropathic damage, not only affects the retina of the eye, but also it is associated with inflammation of the ocular surface, dry eye, persistent corneal defects and alterations in the lacrimal glands; these alteration are associated to the hypoxia and oxidative stress by glucose alterations. Abnormalities in innervation causes dysfunction in tear production, and decrease in parasympathetic motor and vegetative stimulus11 producing inflammatory processes at the ocular surface.12,13 The results show that diabetes is related to the presence of MGD, dry eye, and alterations in the ocular surface, because of agreement with the implemented methodology, frequency of MGD was of 75.6% in diabetic participants, with statistically significant differences between the group of diabetics and the group control (p<0.005).
The prevalence of MGD reported in the international Workshop on MGD ranged from 20% to 60%10 according with the report of Mathers26 (3.5–69.3%), being higher in Asian populations; however by the strong association found between diabetes and MGD,2,9,27,28 is imperative the association between MGD with evaporative dry eye; Hom et al.29 reported a prevalence of 38.9% of MGD in diabetic patients, with alteration in meibum expressibility and viscosity, as same as Korb et al.30 with increase in symptoms according to the viscosity of the meibum; this prevalence is higher in this study 66.6%, associated with processes of aging in males (mean age 59±8 years), while most studies presents the MGD in men as in women with the ages range between 51 and 52 years old.8,27,28
In this way, and coincident with the study of Ding et al.,8 atrophy of the meibomian glands produces keratinization, retroplacement of orifices and obliteration, associated with age; our study has limitations in the method, so it is recommended for future research do scan meibography, to distinguish a true hyperkeratinized of glandular atrophy associated with processes of aging. However, on the results, found strong correlations between the meibomians holes hyperkeratinized and the MGD (r=0.66; p=0.000).
The type 2 diabetic participants diagnosed with MGD (75.6%) were found with phase 3 (46.4%) and phase 4 (42.85%) with significant differences between the groups (p=0.04); the viscosity was tooth paste type (76.6%), with clogged in meibomians holes (76.6%) and alterations in the Marx's line. Shamsheer et al.27 reported alterations in volume and viscosity of the meibum according with this study. From Korb and Henriquez,25,30 it has been understood that mechanisms of blockade or stasis of meibum, lead to the displacement of the gland and its orifice and subsequently its hyperkeratinized, partnering with symptomatology.31 This explains the Marx's line retroplacement (76.6%) associated with processes of hyperkeratinized (67.9%) according with Ibrahim et al.35 associated to aging and decrease in nerves factors in diabetes.
The strong correlation between meibum viscosity and lissamine green staining in the ocular surface (r=0.57; p<0.001) explains the association between MGD and tear film,18,36 with increase in symptoms (r=0.413; p=0.001).
In accordance with the publication of Finis et al., in 2013,37,38 there is significant correlation (r=0.36; p<0.0001) between MGD and the thickness of the lipid layer tear, and inverse correlation between symptoms and the lipid pattern (r=−0. 13; p<0.08), corresponding with the results in this study (r=0. 018; p<0.08).
NIBUT presented inverse and significant correlation with lid margin irregularity (r=−0. 56; p=0.000) higher in diabetic patients; the NIBUT values (<5s) suggests a compromise of the lipid layer, due to the stasis of the meibum, associated with high degree of viscosity in diabetic patients (r=0.88; p<0.001); other important factor is hyperkeratinized and obliteration in the orifices, fact had been reported in TFOS DEWS II.2
TMH normal values in both groups indicate not aqueous deficient association with MGD.17 However, the results found no significant correlation between diabetic and non-diabetic subjects.
A limitation of this study is the relatively small sample size and the selection of only men could be a bias factor, so longitudinal studies are required to understand the association between gender, diabetes and MGD. Another limitation was access to the meibography in order to study the deep morphology of the glands. In addition, the measurements of the palpebral conjunctiva required eversion of the eyelid uncomfortable for patients. Glandular expression with a cotton-tip applicator does not control of force and area, could be improved for futures studies with specials paddles.
ConclusionsIn summary, this study concludes, MGD is more significant in patients with type 2 diabetes compared with nondiabetic patients, with significative morphological changes, viscosity secretion and inflammatory staining in the conjunctiva, correlated with diabetes and compared with normal control participants.
Conflicts of interestThis study has no commercial or propriety interest. The authors report no conflict of interest.


