


To describe an objective method to accurately quantify corneo-pterygium total area (CPTA) by utilising image analysis method and to evaluate its association with corneal astigmatism (CA).
Methods120 primary pterygium participants were selected from patients who visited an ophthalmology clinic. We adopted image analysis software in calculating the size of invading pterygium to the cornea. The marking of the calculated area was done manually, and the total area size was measured in pixel. The computed area is defined as the area from the apex of pterygium to the limbal-corneal border. Then, from the pixel, it was transformed into a percentage (%), which represents the CPTA relative to the entire corneal surface area. Intra- and inter-observer reliability testing were performed by repeating the tracing process twice with a different sequence of images at least one (1) month apart. Intraclass correlation (ICC) and scatter plot were used to describe the reliability of measurement.
ResultsThe overall mean (N=120) of CPTA was 45.26±13.51% (CI: 42.38–48.36). Reliability for region of interest (ROI) demarcation of CPTA were excellent with intra and inter-agreement of 0.995 (95% CI, 0.994–0.998; P<0.001) and 0.994 (95% CI, 0.992–0.997; P<0.001) respectively. The new method was positively associated with corneal astigmatism (P<0.01). This method was able to predict 37% of the variance in CA compared to 21% using standard method.
ConclusionsImage analysis method is useful, reliable and practical in the clinical setting to objectively quantify actual pterygium size, shapes and its effects on the anterior corneal curvature.
Describir un método objetivo para cuantificar con precisión el área total corneal invadida por pterigium (CPTA) utilizando un método de análisis de imagen evaluando su asociación con el astigmatismo de la córnea (AC).
MétodosSe seleccionaron 120 participantes con pterigium primario de entre los pacientes que acudieron a la clínica oftalmológica. Utilizamos un software de análisis de imagen para calcular el tamaño del pterigión invasivo hacia la córnea. La marcación del área calculada se realizó manualmente, midiéndose en píxeles el tamaño del área total. El área computada se define como el área desde el ápex del pterigium al borde del limbo corneal. A continuación, a partir del análisis de pixels, se transformó en un porcentaje (%), que representa el CPTA relativo al área total de la superficie de la córnea. Se realizaron pruebas de fiabilidad Intra- e inter-observador mediante un proceso, de doble repetición, con una secuencia de imágenes diferente, con separación de un (1) mes como mínimo. Se utilizaron la correlación intra-clase (ICC) y el gráfico de dispersión para describir la fiabilidad de las mediciones.
ResultadosLa media global (N=120) de CPTA fue 45,26±13,51% (IC: 42,38–48,36). La fiabilidad para la demarcación de la región de interés (ROI) de CPTA fue excelente con intra e inter-acuerdo de 0,995 (95% IC, 0,994–0,998; P<0,001) y 0,994 (95% IC, 0,992–0,997; P<0,001) respectivamente. El nuevo método se asoció positivamente al astigmatismo de la córnea (p<0,01). Este método fue capaz de predecir el 37% de la varianza de AC, en comparación con el 21% utilizando el método estándar.
ConclusionesEl método de análisis de imagen descrito es útil, fiable y práctico en el entorno clínico, para cuantificar objetivamente el tamaño real del pterigium, así como sus formas y efectos sobre la curvatura anterior de la córnea.
Pterygium is defined as a triangular or wing-shaped abnormal fibrovascular growth of bulbar conjunctiva that encroaches towards the corneal surface.1,2,26 Apart from cosmetic problems, a pterygium can cause serious visual impairment due to induced corneal astigmatism. Pterygium total area is an important factor that contributes to changes in corneal curvature. In fact, larger size or width of pterygium would likely cause significant changes of a standard curvature of a cornea. To date, numerous studies have proved the effect of size and width of pterygium in inducing corneal astigmatism.1–6 However, the definitions of pterygium total area in these studies are varied. Many studies adopt the measurement of the horizontal and vertical dimension of pterygium using slit-lamp biomicroscopy and the total area measured by averaging horizontal length over the nasal corneal radius.3,5–12 Moreover, some studies took the ratio of the horizontal length of pterygium relative to corneal radius13 or corneal diameter.2 It is believed that these variances happen due to the total pterygium area are subjectively measured and not accurately based on its actual shape and size, which indirectly signify lack of reliability and standardisation in measurements. Hence, an objective method is needed in order to overcome these drawbacks. Previous studies have proved that the objective method is more reliable compared to subjective.14–16 To the best of our literature search, limited literature has been found which address the objective quantification of pterygium based on its total area relative to the cornea. However, This study aims to present an objective method to accurately quantify CPTA by utilising image analysis method allowing predicting corneal astigmatism (CA).
Materials and methodsOne hundred and twenty eyes from 120 primary pterygium patients were enrolled. This study adhered to the tenets of the declaration of Helsinki and was approved by the Institutional Research Ethics Board (IIUM/310/G13/4/4-125). The consent form was obtained from all participants once they were aware of the objectives and consequences of the study. Inclusion criteria include established diagnosis of primary pterygium, ages ranging from 20 to 70 years and no history of ocular trauma, ocular surgery and history of contact lens wear.17–19 Patients with significant ocular surface diseases such as recurrent pterygium, corneal opacity or irregularity due to diseases other than pterygium were excluded. A condition in which corneal topography could not provide reproducible measurement due to obstruction of the central cornea by pterygium were also excluded. Quantifying of the CPTA comprised of two parts; image acquisition and determination of the corneo-pterygium region of interest (ROI).
Image acquisitionTo quantify the total area of pterygium, this study employed a calculation method based on image analysis. Images from each pterygium eye were captured using a white light diffused illumination digital slit-lamp biomicroscopy (SLB) (Model SL 990, SLB Mega Digital Vision HR, Costruzione Strumenti Oftalmici (CSO), Italy). The magnification was standardised (10×) with orientation was set between 0 and 35° to the corneal surface.16,21,26 All images were captured in Joint Photographic Experts Group (JPEG) format using the SLB built-in software (Phoenix™, Version 1.2, Costruzione Strumenti Oftalmici (CSO), Italy).
Determination of corneo-pterygium region of interest (ROI)Determination of CPTA of pterygium was based on MatLab™ software. The parameter of pterygium size is measured based on pterygium images acquired as described above. As pterygium may come with irregular shape, the border of pterygium was manually traced according to its best visible borders. The ROI delineation procedures were manually traced from the apex of pterygium to the limbal-corneal border as exemplified in Fig. 1. The comparative size for each pterygium was based on the reference of total corneal diameter described in a recent study.22 The total area was calculated in percentage based on the amount of pixels of the corneo-pterygium area from its digital image. Each area of the entire cornea (B) was measured and the area of pterygium on the cornea (A) was also measured in a pixel unit, and then the CPTA was defined as the ratio (A/B×100). A similar concept has been described in the previous study.23 The area of pterygium on cornea corresponds to the area that invades the cornea. All 120 pterygium images were calculated using similar methods. The illustration of calculation concept of the CPTA was shown in Fig. 1.
 was measured and the area of pterygium on cornea (A) was also measured and then the CPTA was defined as the ratio (A/B×100) calculating the proportion of pterygium invading onto the cornea.")
The tracing process of the corneo-pterygium border was based on expert grading, which comprised of two experts in ocular surface (MRH, KMK). All images were measured based on reference images, which were described in a previous study24 by both independent ROI markers. For intragrader testing, the tracing process was repeated twice with a different sequence of images at least one (1) month apart. For intergrader testing, two separate sessions were performed which comprised of two (2) independent ROI markers. The aimed was to demonstrate its ease of use regardless of observers’ background. On each session and sequence, all images were randomised using randomisation software (Research Randomizer, Version 4.0, downloaded from www.randomizer.org).
All data were presented in mean±SD. Normality of data was tested using the ratio of kurtosis and skewness of ±2.50 as normally distributed.25 Intra and intergrader reliability were assessed using intraclass correlation coefficients (ICC) and scatter plot. To examine the validity of the new method, simple linear regression with the degree of corneal astigmatism (CA) measured using IOL Master 500 (Carl Zeiss Meditec, Dublin, CA) was taken as the outcome and the CPTA method as the explanatory factor. The alpha significance level was set at P<0.05. All statistical analyses were performed using IBM SPSS (Predictive analytics software) (version 12, SPSS Inc., Chicago, IL, USA).
ResultsDescriptive analysisThe overall mean (n=120) of CPTA and corneal astigmatism (CA) were 45.26±13.51% (CI: 42.38–48.36) and 4.64±4.18 D (CI: 4.23–2.98) respectively. The mean age of the study group was 57.42±11.55 years (CI: 55.04–59.80), where 54.2% (n=65) was male.
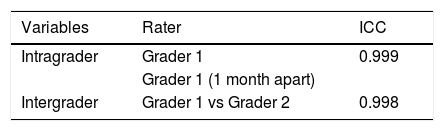
Reliability testing for demarcation of CPTAThe intra-grader agreement between initial and the grading 1 month apart later was 0.995 (95% CI, 0.994–0.998; P<0.001). Inter-grader agreement was 0.994 (95% CI, 0.992–0.997; P<0.001). Table 1 shows that intra and inter-grader reliability estimates based on subjective ROI delineation in the subsample were excellent, with ICC ranging from 0.994 to 1.0. In Figs. 2 and 3, scatter plot shows excellent intra and inter-observer agreement of ROI delineation for calculation of CPTA using MatLab™ software.
.")
.")
To determine the total area of pterygium that contributed to a significant degree of corneal astigmatism (CA), simple linear regression was employed to predict the degree of CA based on the CPTA method. A significant regression equation was found between CPTA method with CA (F(1,119)=70.137, P<0.001), with R2 of 0.37. Predicted CA is equal to 0.0023x+0.67, where x is the CPTA calculated using our method. Regression plot of CA against CPTA is shown in Fig. 4. Comparison between our method and previous approaches1–9,11–13,22 were made by comparing the R2 value. This study found that R2 using CPTA method was higher (R2=0.37) compared to a recently proposed work22 (R2=0.21) calculated based on our data as the reference.
Discussion from CPTA (R2 of 0.37, P<0.01).")
Pterygium total area has been dubbed in numerous articles as the main factor which led to mechanical alterations of the corneal curvature by inducing significant corneal astigmatism.1–13 However, due to lack of standardisation in measuring the total area, it is difficult to determine the actual effect of total area on anterior corneal curvature.
This study defined the area which pterygium invades the cornea as CPTA. This study found that the CPTA was 44.36±12.31% (CI: 41.38–47.34) (n=120). These results were comparable with a previous study23 concerning the method of area measurement. In addition, a previous study23 had reported smaller values of CPTA (12.22±7.85%). These discrepancies could be due to several factors. Firstly, the degree or severity of pterygium showed by the participants in this study lead to variations in size. Hence, this could lead to a larger mean and SD. Secondly, the number of participants could also affect the results (120 vs 37 participants), as bigger samples would indicate more variations in data distributions. Based on our results, reliability for ROI demarcation of CPTA were excellent with intra and inter-agreement of 0.995 (95% CI, 0.994–0.998; P<0.001) and 0.994 (95% CI, 0.992–0.997; P<0.001) respectively. These findings are in agreement with previous preliminary works.29,30 Excellent intra- and inter-agreement could be due to standardisation of image acquisition of all pterygium images and the definition of pterygium border adopted in this study. To the best of our knowledge, this is the first report that describes a standardised method in measuring CPTA with its reliability testing.
Previous works had attempted to quantify pterygium size by taking its horizontal length and width2–9,11,12,22 and distance of horizontal length (apex to limbus) relative to corneal diameter as total area,1,2,13 with assumptions of pterygium as a rectangular shape. This study suggests that rectangular shape does not correspond to the regular pterygium shapes which are not restricted to a wedge-shaped but also can come in various shapes. Not to mention that in all these works1–9,11–13,22 pterigium area was subjectively measured using slit-lamp biomicroscope which prone to bias. Thus, the effect of size using horizontal length and width would not reveal the actual corneal astigmatism induced by pterygium.
This study method was compared with the previous approaches1–9,11–13,22 by comparing the prediction of induced corneal astigmatism. The current study findings revealed higher prediction of corneal astigmatism compared to standard approach (R2=0.37 vs R2=0.21). This is important as an increment of corneal astigmatism induced by pterygium progression can be used as an indicator for surgical excision rather than evaluating it based on its width or horizontal length. Therefore, the outcome should address the key issue which is that the amount of corneal astigmatism should resemble the actual visual performance. The current study suggests that there is a need to migrate from subjectively measured method1–13 to an objective method which is more reliable. This present study has also demonstrated the new method's practicality in the clinical setting and proved its reliability and validity.
A previous work28 describes an objective method to quantify pterygium total area, which took into account of pterygium length and width as its parameters. Pterygium total area was measured based on its vascularity appearance, and image enhancement. However, this study adopts a different approach by employing manual tracing using the newly develop semi-automated Pterygium Redness Grading Software (PRGS) for determining its actual size without consideration of its width and length. The reason is simple as pterygium does not have any specific shape. Thus, there is no need for averaging the size using its width or length. Furthermore, instead of using image enhancement, we employed selective textural features that further enhance corneo-pterygium appearance which indirectly minimise the impact of human variations in the delineation of ROI for calculation of CPTA.
It should be highlighted that both potential advantages and disadvantages or errors can derivate of using this current method. The present method allows measurement of CPTA regardless of its shape and size as it is performed via manual tracing, which indirectly provides a better prediction of corneal astigmatism. Secondly, this method is easy to implement in the clinical setting and less time-consuming. On the other hand, the disadvantages of this method include incorrect identification of the border of pterygium due to its background contrast of the cornea and iris. The illumination variability of each digital image also might cause the method to incorrectly measure the pterygium border which gives rise to its total area. However, this method minimised this error by excluding poor quality images. Second, the crop area is based on the visible border of pterygium which might sometimes be missed by the naked eye. Hence, the method might miss its calculation. This issue has been addressed by repeating the measurement using a second grader whose result has shown a good agreement.
ConclusionIn conclusion, this study suggests that measurement of the CPTA through imaging analysis method could provide better prediction on the actual effects of pterygium on the anterior corneal curvature. Based on these findings, this method has demonstrated to be reliable and easy to employ in the clinical setting. Further research on the association between different distribution of pterygium on the corneal surface and its effect on the oculovisual function can be investigated in the future.
Conflict of interestThe authors report no conflicts of interest.
This research is financially supported by Ministry of Higher Education (MOHE) Malaysia under Prototype Research Grant Scheme (PRGS) with identification number PRGS18-003-0043 and International Islamic University Malaysia (IIUM) under Publication Research Initiative Grant Scheme (P-RIGS) with identification number P-RIGS18-035-0035.


