


The purpose of this exploratory study was to investigate the differences in meibomian gland secretions, contact lens (CL) lipid extracts, and CL surface topography between participants with and without meibomian gland dysfunction (MGD).
MethodsMeibum study: Meibum was collected from all participants and studied via Langmuir–Blodgett (LB) deposition with subsequent Atomic Force Microscopy (AFM) visualization and surface roughness analysis. CL Study: Participants with and without MGD wore both etafilcon A and balafilcon A CLs in two different phases. CL lipid deposits were extracted and analyzed using pressure-area isotherms with the LB trough and CL surface topographies and roughness values were visualized using AFM.
ResultsMeibum study: Non-MGD participant meibum samples showed larger, circular aggregates with lower surface roughness, whereas meibum samples from participants with MGD showed more lipid aggregates, greater size variability and higher surface roughness. CL Study: Worn CLs from participants with MGD had a few large tear film deposits with lower surface roughness, whereas non-MGD participant-worn lenses had many small lens deposits with higher surface roughness. Balafilcon A pore depths were shallower in MGD participant worn lenses when compared to non-MGD participant lenses. Isotherms of CL lipid extracts from MGD and non-MGD participants showed a seamless rise in surface pressure as area decreased; however, extracts from the two different lens materials produced different isotherms.
ConclusionsMGD and non-MGD participant-worn CL deposition were found to differ in type, amount, and pattern of lens deposits. Lipids from MGD participants deposited irregularly whereas lipids from non-MGD participants showed more uniformity.
El objetivo de este estudio exploratorio fue el de investigar las diferencias entre las secreciones de las glándulas de Meibomio, los extractos lipídicos de las lentes de contacto (LC), y la topografía de la superficie de las lentes entre los participantes, con y sin disfunción de las glándulas de Meibomio (DGM).
MétodosEstudio de las Glándulas de Meibomio: Se recogieron las secreciones glandulares de todos los participantes, estudiándose mediante película de Langmuir–Blodgett (LB) y posterior visualización, utilizando un microscopio de fuerza atómica (AFM) y analizando la rugosidad superficial. Estudio de las LC: Los participantes con y sin DGM usaron lentes de etafilcon A y balafilcon A en dos fases diferentes. Se extrajeron y analizaron los depósitos lipídicos utilizando isotermos de área de presión con la usaron, y visualizándose las topografías de la superficie de la LC y los valores de la rugosidad mediante AFM.
ResultadosEstudio de las Glándulas de Meibomio: Las muestras de la secreciones de los participantes sin MGD reflejaron un conglomerado mayor y circular con una superficie menos rugosa, mientras que las muestras de las secreciones de los participantes con DGM reflejaron unos conglomerados más lipídicos, con mayor variabilidad de tamaño, y una mayor rugosidad en la superficie. Estudio de las LC: Las LC de los participantes con DGM mostraron una mayor cantidad de depósitos de película lagrimal, con una superficie menos rugosa, mientras que las LC de los participantes sin DGM reflejaron una menor cantidad de depósitos y una mayor rugosidad en la superficie. Las profundidades de los poros de balafilcon A eran menores en las lentes de los participantes con DGM, que en los participantes sin DGM. Los isotermos de los extractos lipídicos de las LC de los participantes con o sin DGM reflejaron un incremento no significativo de la presión de superficie a medida que disminuía el área; sin embargo, los extractos procedentes de los dos diferentes materiales reflejaron isotermos distintos.
ConclusionesLas secreciones de las LC de los participantes, con o sin DGM, mostraron diferencias en cuanto a tipo, cantidad y patrón de los depósitos de las lentes. Los lípidos procedentes de los participantes con DGM se depositaron de modo irregular, mientras que los de los participantes sin DGM reflejaron más uniformidad.
The human ocular surface is covered by a complex tear film that is made up of many components including water, enzymes, proteins, mucins, lipids, and immunoglobulins.1–6 The tear film is highly structured and is arranged into several indistinct layers.1,7–9 The outermost layer is made up of lipids produced by the meibomian glands that reside within the upper and lower tarsal plates.1,9–11 This lipid layer is further divided into non-polar and polar lipid layers.4,5,7,9,12,13 The outermost non-polar lipid layer functions to control the rate of evaporation of the aqueous layer, whereas the underlying polar lipid layer functions to stabilize and support the non-polar layer.1,4,5,7,12–14 A stable lipid layer is essential for maintaining ocular surface health and visual acuity and disruption in any of the many tear film components can cause ocular discomfort and dry eye.1,15–17 Dry eye syndrome is one of the most common ocular disorders and has two main manifestations: aqueous tear deficiency and evaporative deficiency.18 Aqueous tear deficiency is the most common and is a result of a decrease in lacrimal gland secretion.18 Since the non-polar lipid layer functions to prevent the evaporation of aqueous tears, evaporative dry eye is often caused by a deficiency within the lipid layer, often a result of a condition known as meibomian gland dysfunction or MGD.9,18,19 Some common ocular symptoms of MGD and dry eye include burning, irritation, itching, and fluctuating vision.9,10,19 The meibomian gland secretion (meibum), is normally a clear oily substance, however, the meibum of MGD patients is often a viscous white or yellowed substance, with a toothpaste-like consistency.9,10
When a contact lens (CL) is placed on the cornea, it has a disruptive effect on the tear film and may alter the structure, physiochemical properties, and composition of the normal tear film.6,20 In fact, the presence of the lens disrupts the normal tear film structure so that the lipid layer covering the lens is thinner and less stable than in the absence of a lens.6,20 As a result, the tear film is easily destabilized, allowing the lipids to come into contact with the lenses.6,7 This interaction can lead to absorption of the tear components, especially proteins and lipids, onto the CL.6,7,21,22 MGD and dry eye patients tend to have a destabilized tear film to begin with, due to the poor quality of meibum secretions. This may result in them experiencing significant CL deposition and CL intolerance.10
Two techniques that can be used to study ocular lipids and CL deposits, either together or in isolation, are atomic force microscopy (AFM) and the Langmuir–Blodgett (LB) trough. Atomic force microscopy (AFM) is a powerful technique to study soft biological samples such as lipid membranes and monolayers.23 It allows for three-dimensional imaging at the nanoscale and molecular level as well as permitting the study of physical properties of lipid films.24–26 In AFM, a sharp scanning probe (AFM tip) scans the sample surface and the forces of interaction at each point are measured to produce an image of the surface morphology.27–29 AFM has much higher resolution than optical microscopy and works well in both air and liquid environments. Several research groups have used AFM to study worn and unworn CLs.30–35 However, to-date this method has not been used to specifically study lenses from patients with dry eye or MGD.
The Langmuir–Blodgett (LB) monolayer technique is widely used to produce and study thin films of amphiphilic molecules at the air–water interface.36 A LB trough can be used to deposit layers of amphiphilic molecules onto a substrate or perform surface pressure–area (π/A) isotherms. This isotherm data provides information about the structure, phase transitions, compressibility, intermolecular forces and interactions between lipid molecules.36–38 If the surface pressure becomes higher than the intermolecular forces, the monolayer will collapse (break apart) and some molecules will be squeezed out to form a second layer. The pressure at which a monolayer collapses gives the observer more information about the compressibility and intermolecular forces of the substance. Deposited lipid layers can be studied with the AFM to assess their visual features and integrity.38–40 While some research groups have undertaken experiments on human meibum using the LB trough41 and recently some experiments have been undertaken with the LB trough to study tear film components,42 using this technique is still relatively novel for tear film analysis.
The objective of this exploratory study was to use AFM and a LB monolayer technique to explore ocular lipid films in order to determine the differences, if any, between the contact lens deposits on human worn lenses, contact lens lipid extracts and meibomian gland secretions between MGD patients and non-MGD participants.
MethodsThe study was structured in two parts:
Meibum study: Meibomian gland secretions were collected from MGD and non-MGD participants and studied via LB and AFM.
Contact lens study: MGD and non-MGD participants wore both Acuvue 2 (etafilcon A) and PureVision (balafilcon A) lenses in two consecutive wear phases. Worn contact lens (CL) lipids were extracted and studied by measuring pressure–area isotherms with the LB. Worn CLs were imaged with AFM to study accumulation of lens deposits. Etafilcon A and balafilcon A were chosen as the study lenses due to their distinct material properties. Previous studies43,44–47 have shown that etafilcon A (an FDA group IV, strongly ionic, relatively hydrophilic material) accumulate lower levels of lipid deposits than balafilcon A (an FDA group V, mildly ionic, silicone hydrogel, relatively hydrophobic material).
Clinical assessment, sample collection and preparationApproval of this project was granted through the Office of Research Ethics at the University of Waterloo and all procedures adhered to the tenets of the Declaration of Helsinki. Participants were recruited at the Centre for Contact Lens Research (CCLR), School of Optometry and Vision Science at the University of Waterloo. Informed consent was obtained from all participants, following explanation of the purpose of the study and procedures to be undertaken. The study was conducted as a two part study (meibum study and CL study). Meibomian gland secretions or patient-worn contact lenses were collected from patients for each study.
Meibum studyClinical assessmentThe study consisted of a single visit at which study variables were collected. Screening and the study visit occurred sequentially on the same day. There was no randomization or masking in this study. Ten non-CL wearers were recruited and categorized into 2 groups: a non MGD (non-dry eye) group (n=5) and an MGD (dry eye) group (n=5), based on four factors:
- 1.
Symptom assessment: Participants completed the Ocular Surface Disease Index© (OSDI) symptom assessment tool. Broadly, the OSDI scoring is based on a 0–100 scale, with higher scores representing greater disability or levels of symptoms.
- 2.
Tear film break up time (TFBUT): The slit lamp was set at a magnification of 10–16× using cobalt blue illumination and a yellow barrier filter was used while recording the TFBUT. While holding the right eye open, the examiner instilled a drop of 2% preservative-free sodium fluorescein onto the superior bulbar conjunctiva of the right eye. The participant was instructed to blink several times to mix the fluorescein with the tear film. Immediately following this procedure, TFBUT was measured 3 consecutive times and the average of these was recorded as TFBUT. The time that elapsed between a blink and the first sign of a dark area was recorded as the TFBUT. This procedure was repeated in the left eye.
- 3.
Fluorescein corneal staining: Corneal staining was evaluated approximately 2min following fluorescein dye instillation. Corneal staining was assessed at a magnification of 10–16× using cobalt blue illumination and a yellow barrier filter. The right eye was evaluated first, followed by the left eye. Staining was graded on a 0 (none to minimal) to 4 (severe staining) in 5 regions of the cornea (central, nasal, temporal, inferior and superior). The final score was obtained by summing the scores (0–20).
- 4.
Meibum secretion quality assessment: Meibum secretion quality score was assessed in both eyes. Secretion quality score was assessed using a 0–3 grading scale (grade 0=normal, clear oil expressed; grade 1=opaque, diffusely turbid, normal viscosity; grade 2=opaque, increased viscosity; grade 3=inspissated (thick, toothpaste-like appearance)) meibum or not expressible glands. Meibum was expressed by applying digital pressure on the lower lid and viewed at the slit-lamp. All evaluations were conducted by a single examiner.
Participants were categorized as MGD (dry eye, symptom score ≥13, tear break up time ≤4s, corneal staining score of ≥4, meibum secretion quality score of ≥1 (on a 0–3 scale) in at least one sector (nasal, central or temporal) of lower lid) or as non-MGD (non-dry eye, symptom score ≤12, tear break up time ≥5s, corneal staining score of ≤1, meibum secretion quality score of zero (on a 0–3 scale)). Participants who had any other ocular disease and who used any topical medications that affected ocular health were excluded from the study.
Collection of meibumA Mastrota paddle was placed nasally behind the lower lid to retract the lower lid away from the eye while the patient was looking upward. Using a sterile cotton-tipped applicator, gentle pressure on the lid against the face of the paddle was applied to force the expression of meibum from within the meibomian glands. While keeping the lower lid retracted with the paddle to avoid contact with tears in the lower cul-de-sac, the expressed meibum was collected by carefully gliding a small degreased metal ocular spud (Ellis Eye Spud, Katena Part No. K2-4100) along the lid margin to collect an oily pearl of material. This motion of compression, then collection, was conducted by sliding the paddle along the inside of the lower lid. Approximately 3–4 “collections” were performed for each eye. This procedure was repeated for the left eye and the meibum from both eyes was pooled. Meibum samples were placed on a glass cover slip and laid in a brown glass specimen jar. Nitrogen gas was then blown into the specimen jar, the jar was capped and was stored immediately at −80°C until processing. The spud, paddle and spatula used for meibum collection were pre-sterilized by autoclaving and wiping with an alcohol swab.
Contact lens studyClinical assessmentThis was a prospective, dispensing, single masked, crossover, daily wear study (Fig. 1). Ten CL wearers (5 MGD and 5 non-MGD) participated in this study, who were not the same as those in the meibum study described above. Participants who wore hydrogel or silicone hydrogel CL on a daily wear basis and a monthly/bi-weekly replacement schedule and who wore CL for at least five days per week for a minimum of 10h each day were included in the study. Participants who wore lenses on an extended wear basis were excluded from the study. Participants were categorized into MGD (symptomatic of dry-eye) and non-MGD (asymptomatic of dry eye) based on their subjective evaluation of symptoms of dryness (SESOD).48,49 The SESOD is a self-assessment questionnaire that assessed the subjects’ ocular discomfort due to symptoms of dryness on a 0–4 scale, ranging from “none” to “severe”. Participants who scored ≥2 on SESOD and had a meibum quality score of >1 on a 0–3 scale, were grouped as MGD. Those who scored ≤1 on SESOD and had a meibum quality score of 0 were non-MGD.

Participants were randomized to wear one of the two lenses (etafilcon A or balafilcon A) bilaterally for the first phase (2 weeks) of the study. During the second phase (2 weeks) the lens not worn on the first phase were worn by the participants. Participants were masked to the lens type during the study. A hydrogen peroxide-based disinfection system (Alcon ClearCare, Fort Worth, TX) was dispensed to study participants during both phases of the study.
The use of artificial tears and/or rewetting drops was not permitted during the study for the non-MGD group. However, the MGD group was allowed to use their habitual artificial tears and/or rewetting drops. There were a total of three study visits (Fig. 1). Each visit was separated by 2 weeks. Participants were randomly assigned to one of the two lens groups. The participants were asked to wear their lenses on a daily wear basis for a minimum of eight hours per day. Overall participant preference for the lens type used in the study was also assessed on a 0–100 scale.
Lens collection and storageThe study lenses were collected at the end of each phase (Fig. 1). Study lenses were carefully removed by the participant, with clean powder-free nitrile gloves (SemperCare Nitrile PF) at the end of each two-week phase. Lens collection was randomized, with either the left or right lens being collected for analysis with AFM or LB trough. The same randomization was used for both phases to allow for pair-wise phase comparisons for each participant. Lenses deemed for AFM analysis were placed into a 20mL glass scintillation vial containing 2mL of autoclaved PBS. Blunt metal forceps were used to manipulate the lens into an “open” position in the solution. Lenses were scanned with the AFM within 48h. Lenses deemed for LB trough analysis were placed into empty 20mL scintillation vials with blunt metal forceps, purged with nitrogen gas, capped and stored frozen at −80°C.
Langmuir–Blodgett troughThe Langmuir–Blodgett (LB) microtrough from KSV NIMA (Biolin Scientific, Finland) was used for creating isotherms for lipid analysis and for preparation of solid-supported monolayer samples of meibum films. The lipid solutions in organic solvent were spread at the water–air interface of the trough and let equilibrate for a minimum of 10min to allow for organic solvent evaporation as lipid equilibration. To collect pressure–area isotherms, the lipid films were compressed at a speed of 20cm2/min and a minimum of 3 isotherms were collected for each sample. For lipid films supported on mica, deposition was done at a constant barrier-controlled compression pressure of 10mN/m and a consistent dipping speed of 2mm/min.
Meibum studyMonolayer samples were created using vertical deposition with the LB trough. A freshly cleaved mica slide (ruby, ASTMV-2 quality; Asheville-Schoonmaker Mica, Newport News, Virginia) was placed in a dipper arm of the trough and lowered into the subphase. Meibum secretions were dissolved in 1.0mL of chloroform; concentrations varied due to differences in amount of meibum collected from participants. Dissolved meibum was deposited on the surface of the LB trough and lipids were allowed to spread and equilibrate on the interface for a minimum of 10min, before being compressed via the trough barriers to a compression of 10mN/m. This pressure was then held while the mica was raised at a constant rate through the interface. After a 10-min drying period in air, the monolayer supported on mica was affixed on a glass microscope slide for AFM imaging.
Contact lens studyLenses worn by study participants were extracted twice using 2.0mL of 2:1 chloroform:methanol. These extracts were subsequently dried with a soft stream of inert nitrogen gas and re-suspended in 2.0mL of chloroform. These lipid solutions were then studied using the LB trough at ambient room temperature (25°C) to look at their pressure–area isotherms. Lenses incubated in an artificial tear solution (ATS) for 2 weeks at 37°C, containing a “cocktail” of the 6 most abundant lipids in the human tear film (cholesterol at 0.0018mg/ml, cholesteryl oleate at 0.024mg/ml, oleic acid at 0.0018mg/ml, oleic acid methyl ester at 0.012mg/ml, phosphatidylcholine at 0.0005mg/ml, and triolein at 0.016mg/ml), were also extracted and analyzed using the LB trough pressure–area isotherms. A pressure–area isotherm of the “6-lipid cocktail” itself was also measured for the purposes of another comparison. In this process, the trough is first thoroughly cleaned with chloform; then, aliquots of the lipid solution in chloroform were added to the air–water interface of the trough, with Milli-Q ultrapure water (18.2MΩcm resistivity at 25°C) as a subphase, allowed to equilibrate for 10min, and then compressed via moveable barrier arms to collect the pressure–area isotherms.
AFM imagingThe Atomic Force Microscope utilizes a sharp probe to physically scan across the surface of a sample and gives an image of the topographical features with nanoscale resolution. For both the meibum study samples on mica substrate and the CL study samples, Nanoworld NCH PointProbe uncoated cantilevers (Neuchâtel, Switzerland) with a spring constant of 42N/m and a resonant frequency of 320kHz were used to conduct scans using intermittent contact mode. Imaging was conducted using a JPK Nanowizard II (JPK Instruments AG, Berlin, Germany) atomic force microscope.
Meibum studyMeibum films for AFM imaging were deposited on mica and glass slides using LB deposition and imaged in air in intermittent contact mode. The topography images of supported lipid films were analyzed and processed using JPK image processing software (JPK Instruments AG). All images were subjected to the same processing, namely polynomial line fit and histogram line fit, in order to improve image quality. Quantitative analysis of surface coverage and roughness values was performed using the JPK image processing software and Gwyddion analysis software programs.
Contact lens studyAll of the control lenses used in this study had a power–3.0 dioptres and a diameter of 14.0mm. The balafilcon A lenses had a radius of 8.6mm and the etafilcon A lenses had a radius of 8.7mm. Due to the curvature of the lens, a spherical glass lens holder was created in order to maintain curvature of the sample while doing the AFM scanning. Lenses were scanned in both liquid and air to analyze the difference in imaging techniques and to determine how the lens surface morphology responded to both conditions. Imaging conditions are indicated in figure descriptions. All images were subjected to the same processing as the meibum study. 20 participant-worn lenses were gathered in total for AFM analysis: 10 etafilcon A and 10 balafilcon A. However one lens of each material type was not able to be scanned due to technical difficulties, giving a total of 18 CLs analyzed by AFM
Data analysisClinical data analysis was conducted using Statistica 9.1 and p-values were obtained via an independent t-test. Otherwise, data is reported as mean±standard deviation. LB trough pressure–area isotherms were analyzed and plotted using Microsoft Excel 2007. Statistical analysis on AFM images was performed on the images in order to obtain information on roughness of the samples and the heights of surface features. For each sample series, 20 cross-sections were taken and the data collected from them: 10 across the flat, featureless areas of the sample and 10 across the large aggregates (for the meibum monolayers) or pores (for the human worn lenses).
ResultsMeibum studyTen female participants were enrolled in the study, with a mean age of 55 years (median 56 years, ranging from 40 to 65 years). For the non-MGD group, 5 participants were enrolled in the study with a mean age of 53 years (median 53, ranging from 40 to 62 years). For the group with MGD, 5 participants were enrolled with a mean age of 58 years (median 57, ranging from 61 to 65 years). The mean OSDI (non-MGD=1±1 vs MGD=17±7; p<0.01), TFBUT (non-MGD=5.8±1s vs MGD=2±1s; p<0.01), corneal staining (non-MGD=0.14±0.09 vs MGD=5.8±3.63; p<0.01), quality of meibum (non-MGD=0.0±0.0 vs MGD=1.2±0.2; p<0.01) and meibum expressibility (non-MGD=0.7±0.4 vs MGD=1.8±0.8; p=0.03) scores were all significantly different between the groups.
AFM results for the meibum samples in this study did vary widely, as would be expected due to general lipoidal differences between individuals. However, some trends were visible in the data collected.
For each participant, several images of the meibum deposits on mica were taken of the sample at various areas as well as in various sizes, to ensure consistency in the surface features observed. The common surface features of the samples collected can be seen in the representative images illustrated in Fig. 2. In general, visual inspection suggested that flatter samples with relatively few (but relatively large) spherical lipid aggregates were more common for the non-MGD participants (Fig. 2A). Where present, these lipid “clusters” tended to be larger in height, with heights up to 525nm. Upon taking a closer look at these samples (Fig. 2B), it can be seen that some multilayers were also present, from 3.0 to 8.0nm in thickness. For the MGD participants, a larger number of lipid aggregates of varying sizes were more plentiful than that seen in the non-MGD results, although these clusters were not as large in terms of their height (Fig. 2C). Images of higher magnification show the presence of multilayers as well, ranging from 3.0 to 14nm in thickness.
 and MGD participants (C and D). Images shown are representative images illustrating the common differences observed between MGD and non-MGD sample results. A and C show the sample at a wider scale (30μm×30μm). Figures B and D are zoomed in images (10μm×10μm) of areas from their corresponding larger scale images (A and B are the same participant and sample; C and D are the same participant and sample).")
AFM height images depicting typical monolayer samples from the meibomian gland secretions from non-MGD participants (A and B) and MGD participants (C and D). Images shown are representative images illustrating the common differences observed between MGD and non-MGD sample results. A and C show the sample at a wider scale (30μm×30μm). Figures B and D are zoomed in images (10μm×10μm) of areas from their corresponding larger scale images (A and B are the same participant and sample; C and D are the same participant and sample).
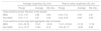
In order to numerically compare the differences between the lipid aggregates and multilayers on the supported films between the MGD and non-MGD results, average roughness (Ra) values were obtained to give a quantitative method of comparison. Ra is a measurement of the changes in height of the sample in question; in this case, we can use these roughness measurements as a way of determining differences in the meibum samples of MGD vs non-MGD participants causing changes in the surface features of the samples, whether it be due to amount of meibum, ratios of lipids, presence of differing lipids, interactions among the lipids present, and so on. As seen in Table 1, Ra values across the lipid multilayers were on average from 0.07 to 1.11nm for the non-MGD samples, as compared with the MGD samples, where the Ra ranged from 0.10 to 1.37nm, indicating that the samples from MGD participants had slightly higher Ra values. Similarly, Ra values were taken across the lipid aggregates and the same trend was observed: non-MGD participant samples had Ra values from 2.14 to 13.77nm while MGD samples had Ra values from 2.91 to 39.18nm. In addition to Ra, peak-to-valley roughness (Rt) values were obtained, which gives a measure of the changes in height of the sample between the minimum valley and maximum peak of the sample, an indication in this case of the largest accumulations of meibum constituents on the solid-support. These measurements, as shown in Table 1, followed a similar trend to that of the Ra, where a wider distribution with higher roughness values were observed for MGD samples than for non-MGD samples.
Estimation analysis for human meibum samples. Cross-sections were taken to give three roughness values form both across the large lipid aggregates accumulated atop the monolayer and across the monolayer itself to detect small domains and features of the monolayer.
| Average roughness (Ra) (nm) | Peak-to-valley roughness (Rt) (nm) | |||||
|---|---|---|---|---|---|---|
| Range | Average | Std. Dev. | Range | Average | Std. Dev. | |
| Cross sections across “flat area” of the sample | ||||||
| MGD | 0.10–1.37 | 0.66 | 0.66 | 0.43–7.31 | 0.59 | 0.81 |
| Non-MGD | 0.07–1.11 | 0.51 | 0.46 | 0.42–4.54 | 0.62 | 0.52 |
| Cross sections across large lipid aggregates atop monolayer | ||||||
| MGD | 2.91–39.18 | 19.21 | 16.09 | 11.21–125.63 | 21.35 | 17.30 |
| Non-MGD | 2.14–13.77 | 10.64 | 8.16 | 7.53–67.17 | 12.85 | 9.65 |
Ten participants were enrolled in this study (8 female, 2 male). The mean age of the participants was 32 years (median 30 years, ranging from 21 to 54 years). For the CL wearing group with no-MGD group, 5 participants were enrolled, with a mean age of 32 years (median 30, ranging from 21 to 40 years). For the CL wearing group with MGD, 5 participants were enrolled with a mean age of 33 years (median 27, ranging from 23 to 54 years).
As expected, the MGD group scored significantly higher on the SESOD questionnaire (MGD group=2.60±0.89 vs non-MGD control group=0.60±0.55; p<0.01) and meibum secretion quality score (MGD=1.2±0.2 vs non-MGD control group=0.0±0.0; p<0.01). The majority of participants (90%) preferred etafilcon A lenses over balafilcon A lenses during the study. For each lens, in at least two different areas, AFM images were taken at four different sizes (30μm×30μm, 20μm×20μm, 10μm×10μm, and 5μm×5μm), resulting in at least eight images for each lens. Fig. 3 displays a few representative samples of such images.

AFM height images of participant-worn contact lenses. A and B are balafilcon A lenses worn by non-MGD and MGD participants, respectively. C and D are etafilcon A lenses worn by non-MGD and MGD participants, respectively. These are representative images showing the common features of these lenses. Each image shows a 5μm×5μm area of the respective contact lens.
Balafilcon A lenses worn by MGD participants showed fewer deposits, although they were larger and distributed unevenly across the surface. These deposits also had an irregular stringy or elongated appearance. In comparison, the non-MGD lenses showed a dusting of small, circular deposits that were evenly distributed on the lens. These observations suggest an irregular deposition and accumulation of tear film components on the lenses worn by MGD participants. Table 2 displays measurements of roughness parameters from the lens images. The individual roughness values from the images in Fig. 3 are as follows: Fig. 3A is a balafilcon A non-dry eye lens with an average roughness of 3.200nm. Fig. 3B is a balafilcon A dry eye lens with an average rouness of 1.422nm. Fig. 3C is an etafilcon A non-dry eye lens with an average roughness of 0.395nm. Fig. 3D is an etafilcon A dry eye lens with an average roughness of 0.758nm.
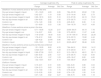
Summary statistics of roughness values from both the “flat” areas of the lens images as well as across the lens pores of balafilcon A and etafilcon A lenses. Average roughness and peak-to-valley roughness are shown. All roughness measurements are in nanometers.
| Average roughness (Ra) | Peak-to-valley roughness (Rt) | |||||
|---|---|---|---|---|---|---|
| Range | Average | Std. Dev. | Range | Average | Std. Dev. | |
| Balafilcon A cross sections across a “flat” area of the lens | ||||||
| Dry eye lenses imaged in liquid | 1.51–10.20 | 4.83 | 2.26 | 7.84–33.39 | 20.62 | 7.35 |
| Dry eye lenses imaged in air | 0.42–2.67 | 1.19 | 0.58 | 3.15–14.44 | 6.55 | 2.73 |
| Non-dry eye lenses imaged in liquid | 0.69–18.74 | 6.03 | 5.10 | 3.13–57.95 | 24.19 | 15.61 |
| Non-dry eye lenses imaged in air | 0.64–9.00 | 2.02 | 1.80 | 3.75–39.75 | 11.01 | 8.14 |
| Control in air | 0.74–1.20 | 0.96 | 0.16 | 4.35–8.00 | 6.06 | 1.14 |
| Control in liquid | 1.31–6.69 | 3.53 | 1.56 | 7.44–19.78 | 14.07 | 4.08 |
| Balafilcon A cross sections across a pore in the lens | ||||||
| Dry eye lenses imaged in liquid | 6.71–16.95 | 12.20 | 2.07 | 24.64–64.91 | 44.19 | 7.78 |
| Dry eye lenses imaged in air | 1.14–5.07 | 2.69 | 1.26 | 5.73–20.53 | 11.67 | 4.48 |
| Non-dry eye lenses imaged in liquid | 7.19–27.60 | 18.40 | 5.93 | 31.79–109.10 | 67.83 | 22.20 |
| Non-dry eye lenses imaged in air | 1.76–6.12 | 3.68 | 1.00 | 9.19–33.74 | 15.82 | 4.44 |
| Control in air | 1.26–4.32 | 2.978 | 0.95 | 7.40–18.47 | 13.64 | 3.53 |
| Control in liquid | 6.03–13.61 | 10.41 | 2.41 | 22.20–48.97 | 38.48 | 8.09 |
| Balafilcon A cross sections across a pore and flat area combined | ||||||
| Dry eye lenses imaged in liquid | 1.51–16.95 | 8.60 | 4.33 | 7.84–64.91 | 32.60 | 14.21 |
| Dry eye lenses imaged in air | 0.423–5.07 | 1.94 | 1.23 | 3.15–20.53 | 9.11 | 4.49 |
| Non-dry eye lenses imaged in liquid | 0.69–27.59 | 12.21 | 8.31 | 3.13–109.10 | 46.01 | 29.11 |
| Non-dry eye lenses imaged in air | 0.64–9.00 | 2.85 | 1.67 | 3.75–39.75 | 13.42 | 6.94 |
| Control in air | 0.74–4.32 | 1.97 | 1.23 | 4.35–18.47 | 9.85 | 4.65 |
| Control in liquid | 1.32–13.61 | 6.97 | 4.10 | 7.44–48.97 | 26.28 | 7.44 |
| Etafilcon A lenses | ||||||
| Dry eye lenses imaged in liquid | 0.15–2.01 | 0.72 | 0.65 | 0.84–9.20 | 3.86 | 3.04 |
| Dry eye lenses imaged in air | 0.24–2.13 | 0.63 | 0.33 | 1.29–9.43 | 3.56 | 1.65 |
| Non-dry eye lenses imaged in air | 0.15–7.69 | 1.16 | 1.70 | 0.78–24.48 | 4.86 | 5.67 |
| Control in air | 0.13–0.35 | 0.20 | 0.06 | 0.74–1.55 | 1.00 | 0.19 |
| Control in liquid | 0.37–1.46 | 0.82 | 0.27 | 1.69–5.73 | 3.96 | 1.18 |
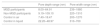
The surface roughness of balafilcon A lenses worn by MGD participants was lower than the surface roughness of non-MGD participant worn lenses on average when measured across a pore, a “flat area” on the lens or a flat and porous region combined. Pore depths in the worn balafilcon A lenses were measured and found to be very variable. On average, pores in the lenses worn by MGD participants were not as deep as the pores in the lenses worn by non-MGD participants. Pore widths were also very variable, with no noticeable difference between MGD and non-MGD participant lenses (Table 3). It was not possible to measure these dimensions on the etafilcon A lenses because this material is not porous.
Pore analysis for balafilcon A human worn lenses. Analysis of the pores for the balafilcon A lenses was performed to investigate the presence of lipid accumulation in or around the edges of the lens pores. Both pore depth (via peak-to-valley roughness measurements) and pore width were taken.
| Pore depth range (nm) | Pore width range (nm) | |
|---|---|---|
| MGD participants | 8.00–64.91 | 239–1880 |
| Non-MGD participants | 9.19–109.10 | 220–1310 |
| Control in air | 7.40–18.47 | 200–1270 |
| Control in liquid | 22.20–48.97 | 310–700 |
Fig. 3C and D display AFM images of worn etafilcon A lenses. This type of lens proved to be much more difficult to scan than the balafilcon A lenses as they were very fragile and tore easily. As a result, two lenses were unable to be imaged. From the images that were gathered, the surface of the non-MGD participant worn lenses appeared to be speckled with small, circular deposits. The MGD participant worn lenses showed larger, irregularly clumped deposits. There were no significant differences in roughness values between non-MGD and MGD participants who wore etafilcon A lenses.
Taking a look at the isotherm data, the 6-lipid cocktail does not exhibit a collapse, the point at which the trough pressure exceeds the sample intermolecular forces and thus, the monolayer can no longer maintain structure and breaks apart; (Fig. 4) the pressure in the trough steadily increased as the surface area decreased. However, the lipid extracts from an etafilcon A lens incubated in an artificial tear solution containing this lipid cocktail did show a collapse, whereas the lipid extracts from balafilcon A lenses did not (Fig. 4).

Comparison of the surface pressure-area isotherms of the six lipid cocktail-based samples. Isotherms included are that of the pure six lipid cocktail, which is representative of the ocular lipids secreted by the meibomian glands, as well as those of lens extracts from balafilcon A and etafilcon A lenses that were incubated in an artificial tear solution containing the six lipid cocktail for a two week period.
Fig. 5 contains representative surface pressure–area isotherms of balafilcon A and etafilcon A lens extracts worn by non-MGD and MGD participants. Both groups of isotherms appear to be fairly featureless as they do not collapse but the surface pressure continues to increase as the surface area of the trough decreases. There are a few characteristic “bends” in the isotherm curve but it cannot be said whether or not there are more of these in the MGD isotherms or vice versa.

Less lipid extract was needed to measure the surface–pressure area isotherms for the etafilcon A material compared to balafilcon A. Also, a higher volume of MGD lens extract was required to produce an isotherm on average compared to the non-MGD extract.
DiscussionThis preliminary study explored the use of AFM and LB methods to examine the differences between CL deposits, CL lipid extracts and meibomian gland secretions in both MGD and non-MGD participants.
For the meibum study, samples of meibum monolayers supported on mica from both the MGD and non-MGD participants deposited at a specific compression pressure chosen to optimize conditions. Recent studies have shown that at ambient room temperature (24°C), meibum is able to reach pressures of over 35mN/m.50 In general, this compressibility of meibum may aid in its function in preventing the tear film from evaporating, especially in relation to the blinking of the eye. Upon compression, lipids associate together to form aggregates atop the monolayer sample, which allows them to endure decreases in surface area without dramatic increases in pressure. This is seen in protein-lipid mixtures that are subjected to extreme changes in surface area, like lung surfactant.51 It is possible that a similar case may be occurring in the meibum films, as meibum has been shown to contain a number of proteins.52–54 However, because meibum is very lipid rich, it is also possible that the lipids present in meibum are able to associate together to form these large aggregates that are visualized.52 Some of these aggregates are likely to be multilayers formed from the amphiphilic phospholipids and sphingolipids present in the meibum, such as sphingomyelin and phosphatidylcholine.55 It is also likely that some of the aggregates were formed due to the presence of triglycerides in the meibum. These lipids have been studied in monomolecular films and found to form multilayers atop the monolayer film, with their three hydrophobic fatty acid tails allowing them to form a close-packing accumulation structure atop the monolayer at higher pressures.56 However, in order to specifically determine the distribution of the various lipids in the meibum film, a method that could differentiate the components would need to be used.
We chose a compression pressure of 10mN/m due in small part to limited amount of meibum sample available from each participant during the extraction process to spread across the subphase of the trough, but primarily to ensure sufficient meibum was available to maintain this pressure during the deposition pressure.
Differences in trends were observed for the monolayer samples of meibum collected from MGD and non-MGD participants. The main trends observed were that the meibum from MGD participants had slightly higher roughness values and a wider distribution of roughness values than compared to the non-MGD participants. These values correspond to what can be visualized in Fig. 2, where there are more lipid aggregates present in the meibum from MGD participants than the non-MGD participants, which led to more features on the surface of the monolayer sample, and thus higher roughness values. However, the lipid aggregates on the surface of the monolayers from MGD participants, though more plentiful, were smaller in height and width than those visualized on the surface of the monolayers from non-MGD participants. This could potentially be attributed to changes in the lipid composition or changes in respective lipid amounts that leads to lipids in the MGD participants’ meibum to not combine well together, resulting in more plentiful but homogeneous smaller aggregates. The reasoning behind this may also be a contributing factor to the instability of the MGD tear film. In contrast, samples of the meibum from non-MGD participants’ show fewer but larger aggregates, which is potentially due to the ability of the different components of the meibum being able to associate together, forming fewer but larger heterogeneous aggregates.
For the CL study, the AFM scans and roughness of the participant worn balafilcon A and etafilcon A lenses suggest that the non-MGD participant worn lenses contained a more uniform spread of smaller lipid deposits with higher roughness values than the MGD lenses. This may be because the tear film structure of a person without MGD is relatively stable and ordered, enabling fewer lipid and protein interactions with the CL once inserted.7 In comparison, the lenses from MGD participants showed an irregular distribution of variable sized deposits with lower roughness values. Those with MGD have an unstable tear film that is highly susceptible to evaporation due to the compromised lipid layer.57 Thus, this unstable structure is further disrupted by the presence of a CL,57 causing more tear film lipid components to interact and deposit onto the CL material.7 This may be one of the reasons that individuals with MGD experience CL intolerance.10,58,59
Balafilcon A pore depth analysis suggests that lipid may accumulate within the pores of the material when worn. This phenomenon was more significant in the lenses worn by MGD patients, as these lenses had shallower pores when compared to non-MGD patient lenses which had deep pores. Again, these results suggest a greater interaction between tear film components and the CL in patients with MGD.
When analyzing the isotherm data, it was found that the isotherms of the etafilcon A lens extracts collapsed at approximately 35mN/m, whereas the isotherms of the balafilcon A lens extracts did not show any collapse. A collapse in a monolayer refers to the breaking apart of the lipid monolayer when it is no longer able to maintain its structure under the pressure being exerted upon it, due to the pressure surpassing the intermolecular forces of the monolayer constituents. These observations in the collapse pressure of the etafilcon A lens extracts compared to the lack of collapse in the balafilcon A lens extracts suggests that different tear film lipids deposit on these two lens materials. It has been speculated that this is due to the fact that the etafilcon A lens is a more hydrophilic material, allowing the more polar lipids to deposit onto the surface.60 Polar lipids form a more uniform monolayer on the surface of the LB trough that is more resistant to increasing pressure and eventually collapses.
In comparison, the balafilcon A isotherm more closely resembled that of the six-lipid stock solution, signifying that the make-up of the lipids deposited on the balafilcon A lens is likely similar to this: a heterogeneous lipid solution. Balafilcon A lenses have hydrophilic silicate islands surrounded by areas of relatively hydrophobic silicone.34,35,61 Due to these surface properties of the lens material, it has been shown to attract both polar and non-polar lipids.47 These isotherms also showed characteristic phase transitions that may be the net result of individual lipid components collapsing while others continue to increase in surface pressure. These “seamless collapses” and phase transitions were also observed in a Langmuir–Blodgett study of meibum lipids.41 It is important when analyzing these data to keep in mind the extraction process for the lipid solutions. The effect that the 2:1 chloroform:methanol solution has on the lens material components itself is unknown.
The fact that a higher volume of MGD lens extract was required to produce an ideal isotherm for both lens types could suggest that less lipid deposits onto the lenses of MGD patients. Similarly, non-MGD samples required less lipid extract to produce an isotherm, thus, they may contain a higher concentration of ocular lipids.
In summary, our results suggest that the lipid deposition on CL differs in terms of amount and pattern between non-MGD and MGD groups and in terms of types of lipids between etafilcon A and balafilcon A lens materials. Lipids from patients with MGD are more disordered and deposit irregularly on CL, whereas lipids from non-MGD patients are relatively ordered and deposit relatively uniformly on CL.
The low sample size and individual variations in lipid expression in this exploratory study made it difficult to correlate the clinical data to the laboratory AFM and LB trough data and perform statistical analysis on the experimental data. It is suggested that future studies should incorporate larger group sample sizes and analysis of individual lipoidal differences using nuclear magnetic resonance, high pressure liquid chromatography and/or mass spectrometry. This study, along with further investigations, can lead to a greater understanding of the interactions between the tear film and contact lenses and ultimately, achieve the goal of more biocompatible lenses, particularly for those with abnormal lipid films such as those seen in patients with MGD.
Conflict of interestOver the past three years, L Jones or his research group has received research funding and/or honoraria from one or more of the following companies: Advanced Vision Research, Alcon, AlgiPharma, Allergan, AMO, Bausch & Lomb, CooperVision, Essilor, Johnson & Johnson Vision Care, Inc., Oculus, Ocusense, Sauflon, TearScience, Visioneering Technologies.
These two authors contributed equally to this publication.
One of the authors (L.J.) has received funding over the past 3 years from the following companies who either are directly involved in products used in this manuscript or are involved in the manufacture of competing products – Alcon, AMO, B&L, CIBA Vision, CooperVision, and Johnson & Johnson.


www.publicationethics.org.


