


To evaluate the agreement between total corneal astigmatism calculated by vector summation of anterior and posterior corneal astigmatism (TCAVec) and total corneal astigmatism measured by ray tracing (TCARay).
MethodsThis study enrolled a total of 204 right eyes of 204 normal subjects. The eyes were measured using a Galilei double Scheimpflug analyzer. The measured parameters included simulated keratometric astigmatism using the keratometric index, anterior corneal astigmatism using the corneal refractive index, posterior corneal astigmatism, and TCARay. TCAVec was derived by vector summation of the astigmatism on the anterior and posterior corneal surfaces. The magnitudes and axes of TCAVec and TCARay were compared. The Pearson correlation coefficient and Bland–Altman plots were used to assess the relationship and agreement between TCAVec and TCARay, respectively.
ResultsThe mean TCAVec and TCARay magnitudes were 0.76±0.57D and 1.00±0.78D, respectively (P<0.001). The mean axis orientations were 85.12±30.26° and 89.67±36.76°, respectively (P=0.02). Strong correlations were found between the TCAVec and TCARay magnitudes (r=0.96, P<0.001). Moderate associations were observed between the TCAVec and TCARay axes (r=0.75, P<0.001). Bland–Altman plots produced the 95% limits of agreement for the TCAVec and TCARay magnitudes from −0.33 to 0.82D. The 95% limits of agreement between the TCAVec and TCARay axes was −43.0 to 52.1°.
ConclusionThe magnitudes and axes of astigmatisms measured by the vector summation and ray tracing methods cannot be used interchangeably. There was a systematic error between the TCAVec and TCARay magnitudes.
Evaluar la concordancia entre el astigmatismo corneal total calculado mediante suma de los vectores del astigmatismo corneal anterior y posterior (TCAVec), y el astigmatismo corneal total medido mediante trazado de rayos (TCARay).
MétodosEste estudio incluyó a un total de 204 ojos derechos de 204 sujetos normales. Los ojos se midieron utilizando un analizador Galilei de doble cámara Scheimpflug. Los parámetros medidos incluyeron el astigmatismo queratométrico simulado utilizando el índice queratométrico, el astigmatismo corneal anterior utilizando el índice refractivo corneal, el astigmatismo corneal posterior, y TCARay. TCAVec se calculó mediante la suma de los vectores del astigmatismo en las superficies corneales anterior y posterior. Se compararon las magnitudes y ejes de TCAVec y TCARay. Se utilizaron el coeficiente de correlación de Pearson y los diagramas de Bland-Altman para valorar la relación y concordancia entre TCAVec y TCARay, respectivamente.
ResultadosLos valores medios de las magnitudes TCAVec y TCARay fueron 0,76±0,57 D y 1±0,78 D, respectivamente (P<0,001). Las orientaciones medias del eje fueron 85,12±30,26 grados y 89,67±36,76 grados, respectivamente (P=0,02). Se encontraron fuertes correlaciones entre las magnitudes de TCAVec y TCARay (r=0,96, P<0,001). Se observaron asociaciones moderadas entre los ejes de TCAVec y TCARay (r=0,75, P<0,001). Los diagramas de Bland-Altman establecieron un 95% de límite de acuerdo para las magnitudes de TCAVec y TCARay de -0,33 a 0,82 D. Los límites de acuerdo del 95% entre los ejes de TCAVec y TCARay fueron de -43 a 52,1 grados.
ConclusiónLas magnitudes y ejes de los astigmatismos medidos mediante suma de vectores y trazado de rayos no pueden intercambiarse. Se produjo un error sistemático entre las magnitudes de TCAVec y TCARay.
Toric intraocular lenses (IOLs) have been developed to reduce corneal astigmatism following cataract surgery.1 The accurate measurement of corneal astigmatism is of the utmost importance for the prevention of astigmatism over- or undercorrection by toric IOLs. Conventional keratometers estimate the corneal refractive power and astigmatism from anterior corneal measurements and a fictitious keratometric index without taking into account the posterior corneal power.2 However, neglecting the effect of posterior corneal astigmatism on anterior corneal astigmatism can lead to unacceptable toric IOL power calculation results. Several studies report that incorporating posterior astigmatism into the toric IOL calculation improves refractive outcomes.3–6 Recently, the development of new technologies, such as slit-scanning devices, Scheimpflug devices, and optical coherence tomography, has made the quantitative measurement of the posterior corneal curvature in a clinical setting possible.7,8 The Galilei dual Scheimpflug system (Ziemer Ophthalmic System AG, Zurich, Switzerland) is a noninvasive diagnostic instrument designed for the analysis of the anterior eye segment characteristics with an excellent repeatability of corneal power measurements.9,10 This system combines both technologies, including Placido imaging, which provides curvature data, and Scheimpflug imaging, which is optimal for precise elevation measurements. This enables the calculation of the total corneal astigmatism using ray tracing of the anterior and posterior corneal surfaces, taking into account the effect of corneal thickness on the corneal power.4,6,11–14 Alternatively, total corneal astigmatism can be calculated from the astigmatism of each surface using vector analysis.5,15–17 However, a confirmation of the agreement between these two total corneal astigmatisms is still lacking and the best method for achieving optimum astigmatic outcomes after toric IOL implantation has not been determined. The purpose of this study was to evaluate the agreement among magnitudes and axis orientations of three corneal astigmatisms, including simulated keratometric astigmatism, calculated total corneal astigmatism using the vector summation of anterior and posterior corneal astigmatism, and Galilei-derived total corneal astigmatism using ray tracing of the anterior and posterior corneal surfaces. Previous studies found an improvement in the prediction of the refractive astigmatism error when the ray tracing method was used to calculate the cylinder power of toric IOLs.3,4,6 Therefore, we considered astigmatism measured by ray tracing to be the gold standard and compared simulated keratometric astigmatism and total corneal astigmatism calculated by vector summation with this benchmark in the current study.
MethodsThis prospective observational case series enrolled 204 right eyes of 204 normal subjects. The only ocular problem was refractive error, and a history or diagnosis of any ocular pathology, such as dry eye, keratoconus, glaucoma, retinal disease, or any previous ocular surgery led to subject exclusion. The study was approved by the Institutional Review Board of the Ophthalmic Research Center, which is affiliated with the Shahid Beheshti University of Medical Sciences, Tehran, Iran, and followed the tenets of the Declaration of Helsinki. Informed consent was signed by all participants after the purpose of the study was explained.
Contact lens users were asked to discontinue the use of lenses for at least 2 weeks and 1-month before the examination for soft and gas-permeable contact lenses, respectively. A complete ocular examination, including slit-lamp biomicroscopy, manifest refraction, uncorrected and best-spectacle corrected visual acuity using the Snellen acuity chart, intraocular pressure measurement, and dilated funduscopy was performed. For measurements using the Galilei dual Scheimpflug analyzer (software version 5.2; Ziemer Ophthalmic System AG), the participants were seated with their chin on a chinrest and forehead against the forehead strap while focusing on the target. The alignment of the scan center with the corneal apex was confirmed using an initial Scheimpflug image formed on the monitor together with a guide line. The measurements were confirmed under a quality-specification window. Good-quality dual Scheimpflug analyzer scans (green check mark displayed on the map) were included in the study. If the comments were marked yellow or red (i.e., not acceptable), then the examination was repeated or the patient's data were excluded.
The following measurements were obtained using the Galilei dual Scheimpflug analyzer: simulated keratometric astigmatism, anterior and posterior corneal astigmatism, total corneal astigmatism, and central corneal thickness. All measurements were made across the 1.0–4.0mm central zone of the cornea. Simulated keratometric astigmatism (KASim) was calculated using the anterior corneal radii and a keratometric index of 1.3375. For the calculation of anterior corneal astigmatism, the anterior corneal radii and air (1.00) and corneal refractive (1.376) indices were used. Posterior corneal astigmatism was calculated using the posterior corneal radii and refractive index of the cornea (1.376) and the aqueous humor (1.336). The Galilei-derived total corneal astigmatism was calculated by tracking the path of incident rays of light through the anterior corneal surface and the posterior corneal surface using a ray tracing method and the Snell law. The actual indices of the refractions of each medium (air=1.00, cornea=1.376, and aqueous=1.336) were used in the total corneal astigmatism calculation using the ray tracing method (TCARay).
The calculated total corneal astigmatism was obtained as the vector summation of anterior and posterior corneal astigmatism (TCAVec).15 Before vector analysis, the power of the flat and steep meridian of the anterior corneal surface was converted to the posterior corneal surface plane using the vergence formula: vergence power=1.376/[(1.376/P)−d], where P is the power of anterior corneal surface in the flat or steep meridian and d is the average pachymetric values over the central 4-mm area. The astigmatism at the posterior corneal surface plane caused by the anterior surface was the difference between the vergence powers of the anterior flat and steep meridians. TCAVec was then obtained by vector summation of the astigmatism at the posterior corneal surface plane created by the anterior corneal surface and the astigmatism from the posterior corneal surface. For vector summation, anterior astigmatism was defined using the positive magnitude and steep axis. Because the posterior corneal surface has a divergent optical effect, the posterior corneal astigmatism was also defined with a positive magnitude but using the flat axis for vector addition.
The astigmatism magnitudes measured by KASim, TCAVec, and TCARay were compared using the power vector analysis according to Thibos et al.18 Each astigmatism value was converted to rectangular vectors J0 and J45 using the following equations: J0=−(C/2)×Cos (2α) and J45=−(C/2)×Sin (2α), where J0 is the Jackson cross-cylinder power at axis 90° and 180°, J45 is the Jackson cross-cylinder power at axis 45° and 135°, C is the negative cylinder, and α is the axis of the flat meridian. In this representation, positive values of J0 indicate with-the-rule (WTR) astigmatism and negative values indicate against-the-rule (ATR) astigmatism. Power J45 represents oblique astigmatism.
Since the significance of the difference of astigmatism axes depends on the magnitude of astigmatism, the weighted axes difference between the KASim and TCARay axes, between the TCAVec, and TCARay axes, and between TCAVec and KASim axes was calculated using the following equations: DA=2×TCARay×sin (2AxisSim−2AxisRay), DA=2×TCARay×sin (2AxisVec−2AxisRay), and DA=2×KASim×sin (2AxisVec−2AxisSim), respectively, where DA is the weighted axes difference, and AxisSim, AxisVec, and AxisRay denote the axis of astigmatism measured by the simulated keratometry, vector summation, and ray tracing methods, respectively.19 DA is a quality criterion based on the power-vector approach. Geometrically, DA is the length of the difference vector between both methods given that the astigmatism power found with the two methods are comparable. This approach makes it possible to compare axis values, even when the actual astigmatism powers are different.19
Statistical analysisData were analyzed using SPSS statistical software version 21 (IBM Corp., Armonk, NY, USA). Values indicating means and standard deviations, ranges, frequencies and percentages were used to express the data. The normal distribution of continuous variables was confirmed using a Kolmogorov–Smirnov test and Q–Q plot. The magnitudes and orientations of three different astigmatisms were compared using repeated measure ANOVA and Friedman tests with the Bonferroni correction for multiple comparisons. The absolute mean difference of astigmatism magnitude between KASim and TCARay was compared with that between TCAVec and TCARay using a paired t-test and Wilcoxon signed rank test. The MacNemar test was used to compare the percentage of eyes that had magnitudes and axis orientations of KASim and TCAVec different from those of TCARay. The Pearson correlation coefficient was calculated to assess the relationship between KASim and TCARay and between TCAVec and TCARay with respect to the magnitudes and axis orientations. Bland–Altman plots and the 95% limits of agreement (95% LoA; mean difference ±1.96 standard deviation) were applied to determine the agreement between KASim and TCARay and between TCAVec and TCARay in terms of magnitudes and axis orientations. P<0.05 was considered a statistical significance. All P-values are two-sided.
ResultsA total of 204 right eyes of 204 normal subjects (88 male subjects) were analyzed. The mean participant age was 29.9±5.9 years (range, 20 to 54 years). The mean spherical equivalent refraction was −2.68±1.87D (range, −13.88 to +0.75D). The mean simulated keratometry and keratometric astigmatism were 43.74±1.14D (range, 41.09–45.98D) and 1.09±0.82D (0.06–4.45D), respectively. The mean anterior corneal astigmatism magnitude using the corneal refractive index was 1.22±0.91D (range, 0.06–4.94D). Regarding the anterior corneal surface, 155 eyes (76.0%) had WTR astigmatism (the steep meridian was within 60–120°), 21 eyes (10.3%) had ATR astigmatism (the steep meridian was within 0–30° or 150–180°), and 28 eyes (13.7%) had oblique astigmatism. The mean posterior corneal power was −6.30±0.20D (range, −6.84 to −5.83D), and the mean posterior corneal astigmatism magnitude was −0.31±0.14D (range, −0.82 to −0.08D). Regarding the posterior corneal surface, 1 eye (0.5%) had WTR astigmatism (the steep meridian was within 0–30° or 150–180°), 198 eyes (97.1%) had ATR astigmatism (the steep meridian was within 60–120°), and 5 eyes (2.4%) had oblique astigmatism. The principle meridians of the anterior and posterior corneal astigmatism coincided in the same patient in 172 eyes (84.3%).
Table 1 shows and compares the magnitudes, axis orientations, J0, and J45 among KASim, TCAVec, and TCARay in the entire study group. As demonstrated, the magnitudes of these three astigmatisms were significantly different. KASim yielded the highest magnitude and TCAVec had the lowest magnitude. The results of multiple comparisons revealed that TCAVec produced significantly lower astigmatism magnitude than KASim (P<0.001) and TCARay (P<0.001). The KASim magnitude was significantly higher than the TCARay magnitude (P<0.001). The absolute mean difference in the magnitudes of astigmatism between KASim and TCARay (0.16±0.09D, range, 0.0–0.45D) was significantly lower than that between TCAVec and TCARay (0.28±0.26D, range, 0.0–1.30D; P<0.001). The astigmatic magnitudes of KASim were within ±0.50D of the TCARay magnitudes in all eyes (100%). The percentages of eyes with the magnitudes of TCAVec within ±0.50D and ±1.0D of the TCARay magnitudes were 84.3% and 97.6%, respectively. There was no significant difference in the J0 and J45 values among the three methods of astigmatism measurement (Table 1 and Fig. 1).
Comparisons of keratometric astigmatism (KASim), total corneal astigmatism calculated by vector summation (TCAVec), and total corneal astigmatism measured by ray tracing (TCARay) in terms of magnitude, axis, and component of Jackson cross cylinder at 0 and 90° (J0) and at 45 and 135° (J45).
| KASim | TCAVec | TCARay | P value | |
|---|---|---|---|---|
| Magnitude (D) | 1.09±0.82 (0.06 to 4.45) | 0.76±0.57 (0.05 to 3.52) | 1.00±0.78 (0.06 to 4.29) | <0.001 |
| Axis orientation (°) | 85.55±30.51 (1.0 to 176.0) | 85.12±30.26 (1.03 to 175.89) | 89.67±36.76 (2.0 to 177.0) | 0.002 |
| J0 (D) | 0.020±0.46 (−2.13 to 1.55) | 0.024±0.32 (−1.68 to 1.25) | −0.044±0.47 (−2.14 to 1.55) | 0.08 |
| J45 (D) | 0.037±0.52 (−1.86 to 2.05) | 0.021±0.35 (−1.15 to 1.37) | −0.034±0.42 (−1.61 to 1.70) | 0.11 |
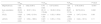
 Vector analysis of astigmatic magnitude measured by keratometric astigmatism versus ray tracing. (B) Vector analysis of astigmatic magnitudes measured by vector summation of the anterior and posterior corneal astigmatism versus ray tracing (J0=Jackson cross-cylinder power, axes at 90° and 180°; J45=Jackson cross-cylinder power, axes at 45° and 135°).")
Vector analysis of astigmatic magnitudes measured by the three methods, plotted as an astigmatic vector for each eye. (A) Vector analysis of astigmatic magnitude measured by keratometric astigmatism versus ray tracing. (B) Vector analysis of astigmatic magnitudes measured by vector summation of the anterior and posterior corneal astigmatism versus ray tracing (J0=Jackson cross-cylinder power, axes at 90° and 180°; J45=Jackson cross-cylinder power, axes at 45° and 135°).
The axis orientations of astigmatisms measured by the three methods were significantly different (Table 1). The results of multiple comparisons revealed a significant difference in axis orientations between KASim and TCARay (P=0.04) and between TCAVec and TCARay (P=0.02). There was no significant difference between KASim and TCAVec in terms of axis orientations (P>0.99). The percentages of eyes with the KASim axis within ±5°, ±10°, and ±15° of the TCARay axis were 66.2%, 80.9%, and 88.2%, respectively. The percentages of eyes with the TCAVec axis within ±5°, ±10°, and ±15° of the TCARay axis were 61.8%, 79.9%, and 87.8%, respectively. Weighted axes difference was −0.16±1.75D between KASim and TCARay, −0.17±1.74D between TCAVec and TCARay, and −0.04±0.43D between KASim and TCAVec (P<0.001). This approach revealed that the length of the difference vector was longest between TCAVec and TCARay and shortest between KASim and TCAVec.
Strong statistically significant correlations were found between the KASim and TCARay magnitudes (r=0.98, P<0.001) and between the TCAVec and TCARay magnitudes (r=0.96, P<0.001). Moderate significant associations were observed between the KASim and TCARay axes (r=0.77, P<0.001) and between the TCAVec and TCARay axes (r=0.75, P<0.001) (Fig. 2).
 and total corneal astigmatism measured by ray tracing (TCARay) and between total corneal astigmatism calculated by vector summation (TCAVec) and TCARay in terms of magnitudes and orientations. (A) The relationship between the magnitudes of KASim and TCARay; the regression formula was TCARay magnitude=−0.03+0.94×KASim magnitude (r=0.98, P<0.001). (B) The relationship between the axis orientations of KASim and TCARay; the regression formula was TCARay orientation=10.46+0.93×KASim orientation (r=0.77, P<0.001). (C) The relationship between the magnitudes of TCAVec and TCARay; the regression formula was TCARay magnitude=0.003+1.32×TCAVec magnitude (r=0.96, P<0.001). (D) The relationship between the axis orientations of TCAVec and TCARay; the regression formula was TCARay orientation=11.68+0.92×TCAVec orientation (r=0.75, P<0.001). Dotted lines indicate 95% confidence intervals for the regression line.")
Scattergrams illustrating the relationships between keratometric astigmatism (KASim) and total corneal astigmatism measured by ray tracing (TCARay) and between total corneal astigmatism calculated by vector summation (TCAVec) and TCARay in terms of magnitudes and orientations. (A) The relationship between the magnitudes of KASim and TCARay; the regression formula was TCARay magnitude=−0.03+0.94×KASim magnitude (r=0.98, P<0.001). (B) The relationship between the axis orientations of KASim and TCARay; the regression formula was TCARay orientation=10.46+0.93×KASim orientation (r=0.77, P<0.001). (C) The relationship between the magnitudes of TCAVec and TCARay; the regression formula was TCARay magnitude=0.003+1.32×TCAVec magnitude (r=0.96, P<0.001). (D) The relationship between the axis orientations of TCAVec and TCARay; the regression formula was TCARay orientation=11.68+0.92×TCAVec orientation (r=0.75, P<0.001). Dotted lines indicate 95% confidence intervals for the regression line.
Bland–Altman plots produced a 95% LoA for the KASim and TCARay magnitudes from −0.40 to 0.21D (mean difference=−0.10D). This range was wider for the TCAVec and TCARay magnitudes (from −0.33 to 0.82D; mean difference=0.24D) (Fig. 3). The mean difference between the KASim and TCARay axes was 4.1° (±95% LoA: −42.2 to 50.4°), which was similar to that between the TCAVec and TCARay axes (4.5°, ±95% LoA: −43.0 to 52.1°) (Fig. 3).
 Difference in the magnitudes of keratometric astigmatism (KASim) and total corneal astigmatism measured by ray tracing (TCARay) against the mean magnitudes of KASim and TCARay. (B) Difference in the axes of KASim and TCARay against the mean axes of KASim and TCARay. (C) Difference in the magnitudes of total corneal astigmatism calculated by vector analysis (TCAVec) and TCARay against the mean magnitudes of TCAVec and TCARay. (D) Difference in the axes of TCAVec and TCARay against the mean axes of TCAVec and TCARay. The solid lines represent mean differences and dotted lines are the upper and lower borders of the 95% limits of agreement.")
Bland–Altman plots show the difference between two measurements divided by the mean of two measurements. (A) Difference in the magnitudes of keratometric astigmatism (KASim) and total corneal astigmatism measured by ray tracing (TCARay) against the mean magnitudes of KASim and TCARay. (B) Difference in the axes of KASim and TCARay against the mean axes of KASim and TCARay. (C) Difference in the magnitudes of total corneal astigmatism calculated by vector analysis (TCAVec) and TCARay against the mean magnitudes of TCAVec and TCARay. (D) Difference in the axes of TCAVec and TCARay against the mean axes of TCAVec and TCARay. The solid lines represent mean differences and dotted lines are the upper and lower borders of the 95% limits of agreement.
Since posterior corneal imaging became possible, it has received increasing clinical interest, particularly for the accurate correction of astigmatic errors by toric IOLs.3–6 Three methods are used to determine the effect of posterior corneal astigmatism on anterior corneal astigmatism. Simulated keratometry measures the radius of the anterior corneal surface only and uses the keratometric index (1.3375 for most devices) to compensate for the posterior corneal surface and to convert anterior measurements into total corneal power and astigmatism without knowing the curvature of the posterior corneal surface.2 The keratometric index is used on the basis of the premise that the anterior and posterior corneal curvatures have a constant and linear relationship.20,21 However, this premise is not always true because the anterior-posterior curvature ratio varies from eye to eye.20,21 Total corneal astigmatism can also be calculated from the astigmatism of anterior and posterior surfaces using vector summation.5,15–17 This method uses the paraxial approximation with the assumption of parallel rays approaching the posterior corneal surface.22 Another method is the ray tracing of the anterior and posterior corneal surfaces.3,4,6,11–14 Ray tracing propagates incoming parallel rays and uses the Snell law to refract these rays through the anterior and posterior corneal surfaces, taking into account the effect of corneal thickness on the corneal power. This approach, instead of assuming that parallel rays reach the posterior corneal surface, accounts for the refraction of rays by the anterior corneal surface.22 To the best of our knowledge, no study has evaluated whether the astigmatism magnitudes and axis orientations measured by vector summation and ray tracing can be used interchangeably.
We evaluated different corneal astigmatisms from a dual Scheimpflug topographer because studies have shown that the system has excellent repeatability of corneal power measurements.9,10 The advantage of the Galilei dual Scheimpflug analyzer is that KASim, anterior and posterior corneal astigmatism, and TCARay are measured simultaneously, thereby eliminating the potential disagreement among the measurements that may be caused by the realignment of the eye. The results of the current study show disagreement among KASim, TCAVec, and TCARay in terms of magnitude and axis orientation. Compared with TCARay, KASim overestimated and TCAVec underestimated the astigmatism magnitude. The agreement was narrower between the KASim and TCARay magnitudes than between the TCAVec and TCARay magnitudes. Similar to our results, previous studies reported that the TCARay magnitude was significantly lower than the KASim magnitude, which is due to the contribution from the posterior corneal surface.12–14 However, contradicting results have been reported. Zhang et al.4 and Srivannaboon et al.11 reported no significant difference between the KASim and TCARay magnitudes. This discrepancy is likely due to the participant's age, which was older in the study by Zhang et al.4 (68.0 years) and Srivannaboon et al.11 (66.14 years) than in our study (29.9 years). Anterior corneal astigmatism shifts toward ATR from WTR with increasing age, while the orientation of posterior astigmatism remains unchanged.17,23 Thus, the compensating effects of the posterior corneal surface on anterior corneal astigmatism decreases with advancing age. This explains the discrepancy between our results and the results obtained by Zhang et al.4 and Srivannaboon et al.11
The method we used to calculate total corneal astigmatism by vector summation was performed according to the approach adopted by Ho et al.15 They reported that the vector summation of posterior corneal astigmatism to anterior corneal astigmatism resulted in a reduction in the astigmatism of the anterior corneal surface, which is consistent with our findings.15 Similarly, Prisant et al.16 observed that vector summation of Orbscan measurements of posterior and anterior corneal surface toricity resulted in an astigmatism reduction in overall topographical astigmatism compared to anterior topographical astigmatism.
Despite the identification of a significant difference among the three methods of astigmatism magnitude measurement, a strong association was found between the KASim and TCARay magnitudes and between the TCAVec and TCARay magnitudes in the present study. This finding indicates that the difference was caused by a systematic error and not by a random error. The presence of a fixed systematic bias may allow appropriate conversion equations to be derived such that the KASim and TCAVec magnitudes can be changed to the TCARay magnitude. The intercept and slope parameters reported in the current study can be used for this purpose. As previously mentioned, the systematic measurement difference between the KASim and TCARay magnitudes mainly arises from neglecting the posterior corneal astigmatism in the KASim calculation. The potential explanation for the systematic measurement difference between the TCAVec and TCARay magnitudes can be attributed to the assumption by which the posterior corneal astigmatism is calculated. Corneal astigmatism from the posterior corneal surface is calculated using the paraxial approximation with the assumption of parallel rays approaching the posterior corneal surface.12 However, the rays propagating to the posterior surface have already been refracted by the anterior surface; therefore, the “effective” posterior power will be less than what is calculated using parallel incident rays and a paraxial formula.22 Thus, the vector summation of anterior and posterior corneal astigmatism would underestimate total corneal astigmatism, which was the case in the current study. This may result in an underestimation of the cylinder power of the toric IOLs when using TCAVec. Ray tracing does not rely on paraxial optics and is the better method with which to calculate total corneal refractive power.
The KASim and TCAVec axes were significantly different from the TCARay axis. An axis difference of more than 10° was detected in 19.1% of eyes between KASim and TCARay and in 20.1% of eyes between TCAVec and TCARay. These rates are very similar to those reported in a previous study by Koch et al.12, who found that the difference in the location of the steep meridian between KASim and TCARay was higher than 10° in 17.2% of eyes. The axis orientations of KASim and TCAVec were comparable. In addition, weighted axes difference revealed that the length of the difference vector was shortest between KASim and TCAVec. These findings are consistent with those obtained in previous studies, demonstrating that the axis location was similar between KASim and TCAVec.15,16 A potential explanation may be the small difference between the anterior and posterior principal meridians, which we observed in most eyes included in the current study. Because the anterior and posterior principal meridians were closely aligned, the modification in axis induced by vector summation was not statistically significant.
The results of the current study indicate that compared to the ray tracing method, residual postoperative astigmatism can be as high as 0.82D and axis misalignment can vary from −43.0 to 52.1° if the vector summation method is used for toric IOL calculation. However, the limitation of our study is that we did not validate the outcomes of toric IOL implantation calculated by TCAVec versus TCARay. Therefore, we are not certain whether TCARay is superior to TCAVec in regard to toric IOL calculation. Several studies have shown that toric IOL calculation using TCARay provides a more accurate residual astigmatism prediction than calculation using KASim. Savini and Næser3 reported a mean 0.59-D cylinder overcorrection for WTR eyes and a mean 0.32-D undercorrection for ATR eyes when KASim was used to select the cylinder power of the toric IOLs. When Pentacam-derived TCARay was used, the error in refractive astigmatism was not statistically significant from zero.3 Zhang et al.4 reported that the prediction error of the vector mean astigmatism after toric IOL implantation was slightly smaller when the Galilei-derived TCARay was used than when the KASim was used. However, the difference did not reach a significant level.4 They reported that using keratometric measurements tended to overcorrect WTR astigmatism and undercorrect ATR astigmatism, whereas these biases were not observed with TCARay.4 Using the Galilei TCARay values to calculate the cylinder power of toric IOLs, Koch et al.6 found a significant WTR prediction error of 0.57D in the WTR group but no significant WTR/ATR prediction errors in the ATR group. They concluded that the Galilei TCARay may still underestimate the posterior corneal astigmatism in WTR eyes.6 Only one study testing the accuracy of toric IOL calculation using TCAVec has been published. Eom et al.5 reported that toric IOL calculation using TCAVec provided a more accurate residual astigmatism prediction (0.30D) than calculation using KASim (0.50D). However, the results of the study by Eom et al.5 cannot be compared with the results by Savini and Næser3, Zhang et al.4 and Koch et al.6 because the former authors estimated posterior corneal astigmatism from anterior corneal astigmatism using linear regression analysis parameters of the reference subjects.
In summary, the current study indicates a discrepancy among simulate keratometric astigmatism, total corneal astigmatism calculated by vector summation, and total corneal astigmatism measured by ray tracing. Although we did not validate the outcomes of toric IOL implantation in a clinical setting, our findings may be helpful for a more accurate correction of astigmatism using toric IOL implantation. Our results suggest that the direct measurement of total corneal astigmatism by Scheimpflug imaging and ray tracing may be the best option with which to calculate the astigmatism to be surgically corrected and that using vector summation of anterior and posterior corneal astigmatism may cause a significant error (undercorrection) in the cylinder power of toric IOLs. A study is warranted to assess which of the investigated methods (vector summation versus ray tracing) allows the best refractive outcomes in patients undergoing toric IOL implantation during cataract surgery.
FundingThe authors have no financial or propriety interest in any of the materials used in this manuscript.
Conflicts of interestThere are no conflicts of interest.


