


To compare and analyze the interchangeability of three measuring systems, each based on a different technique, for central corneal thickness (CCT) analysis.
MethodsCCT measurements were measured using optical coherence tomography (OCT), non-contact specular microscopy (NCSM), and ultrasonic pachymetry (USP) in 60 eyes of 60 healthy patients with a mean age of 66.5±15.0 years and a mean spherical equivalent of 0.43±1.14 D. Analysis of variations in measurement concordance and correlation among the three different methods were performed. Comparison of CCT measurements were done using Bland–Altman plots (with bias and 95% confidence intervals), intraclass correlation coefficient (ICC), and paired t-student analysis.
ResultsMean CCT values were: 549.20±26.91μm for USP (range 503–618μm), 514.20±27.49μm for NCSM (range 456–586μm) and 542.80±25.56μm for OCT (range 486–605μm). CCT values obtained with NCMS were significantly lower than those obtained with OCT and USP methods. NCMS CCT value was 36.08±10.72μm lower than USP value (p<0.05), and NCMS CCT value was 7.88±8.86μm lower than OCT value (p<0.05). ICC between USP–NCSM pair was 0.488 and 0.909 between USP–OCT pair.
ConclusionOCT and UPS offered highly comparable results, whereas NCSM offered lower mean CCT values compared to the other two methods. Therefore, NCSM should not be considered a reliable method for measuring CCT and should rather be considered for assessing longitudinal changes in the same patient.
Comparar y analizar la intercambiabilidad de tres sistemas de medición, basado cada uno de ellos en una técnica diferente, para estudiar el espesor corneal central (ECC).
MétodosSe realizaron mediciones del ECC utilizando tomografía de coherencia óptica (OCT), microscopía especular (NCSM), y paquimetría ultrasónica (USP) en 60 ojos de 60 pacientes sanos, con una edad media de 66,5±15 años y un equivalente esférico medio de 0,43±1,14 D. Se realizaron análisis de las variaciones de concordancia de las mediciones, y correlación entre los tres métodos diferentes. Se compararon las mediciones del EEC utilizando gráficos de Bland-Altman (con desviaciones, e intervalos de confianza del 95%), coeficiente de correlación intra-clase (ICC), y análisis de t pareada de Student.
ResultadosLos valores medios de ECC fueron: 549,2±26,91μm para USP (rango 503-618μm), 514,2±27,49μm para NCSM (rango 456-586μm) y 542,8±25,56μm para OCT (rango 486-605μm). Los valores de ECC obtenidos con NCMS fueron significativamente inferiores que los obtenidos con los métodos OCT y USP. El valor de ECC obtenido mediante NCMS fue inferior en 36,08±10,72μm al valor obtenido mediante USP (p<0,05), y el valor de ECC obtenido mediante NCMS fue inferior en 7,88±8,86μm al obtenido mediante OCT (p<0,05). El ICC entre el par USP-NCSM fue de 0,488, y de 0,909 entre el par USP-OCT.
ConclusiónLos métodos OCT y UPS aportaron resultados altamente comparables, mientras que NCSM aportó unos valores medios de ECC inferiores a los aportados por los otros dos métodos. Por tanto, NCSM no debería considerarse un método fiable en la medición del ECC, debiéndose utilizar en la valoración de los cambios longitudinales del mismo paciente.
Central corneal thickness1–3 measurement is required for several procedures in ophthalmology such as corneal dystrophy follow-up, contact lens wear complications, glaucoma and postoperative studies after corneal surgery.1,4–6
Ultrasonic pachymetry (USP) instruments measure the CCT by, emitting short electrical pulses which are transformed into ultrasonic waves by a crystal probe at 20MHz frequency and 1640m/s speed. The measurement is performed between the corneal epithelium and Descemet's membrane. Due to the high reproducibility this technology is currently considered as the Gold Standard.7–13,18 However, CCT measurements with USP depend on a highly accurate location and positioning of the probe (orthogonal to the corneal surface). At the same time, USP requires local anaesthetic eye drop instillation as some corneal indentation occurs because of probe contact. Some authors suggest that CCT values may be altered by up to 10μm because of corneal anaesthesia instillation.7
Besides USP, other techniques offer the possibility of measuring CCT by direct methods. Among them, anterior segment optical coherence tomography (15) offers fast and non-contact CCT measurement by analysing infrared interferometry.14 It uses a 1310nm diode light with a rate of 4000scans/s to scan captured images. The OCT device captures a corneal sectional image, which is then analyzed by software. In this case, the CCT value is calculated from tear film to corneal endothelium.15
Non-contact specular microscopy (NCSM) is commonly used for studying the number, shape and size of endothelial cells,16 but can be used to measure CCT values. In NCSM technology, images and corneal thickness values, are obtained by photographic cell reflection acquisition, where each interface (tear film, corneal epithelium and aqueous humour) causes a light reflection due to a different refractive index. NCSM technology obtains CCT values by considering the space between the tear film and the corneal endothelium.17
Both OCT and NCSM systems use optical technologies and do not require anaesthetic drop instillation. Therefore, the advantages of optical systems are a faster data acquisition and a fewer inherent complications related to corneal contact.
The existence of different CCT measurement methods makes it important to understand their strengths and weaknesses. In this respect, some studies have compared different methods for calculating CCT values,6,16,18,19 and substantial progress has been made in this field. One study2 has previously analyzed the inter-instrument reproducibility of CCT measurement using USP, slit-lamp optical coherence tomography and specular microscopy, but Cirrus HD-OCT has greater axial and transversal resolution. Furthermore no statistical tests have been properly used to quantify the agreement among the three different instruments. Consequently, at present it is not easy to know if CCT values obtained with different instruments are comparable and equivalent.
Therefore, in this study we have analyzed the agreement of 3 different CCT measurement systems.
MethodsThis prospective study was carried out with a sample of 60 patients. Inclusion criteria were: age between 27 and 85 years, and spherical equivalent error between −1.50 and +4.50 D. Exclusion criteria included: ocular disease, history of ocular surgery or inflammation, and astigmatism >0.75D. An experienced clinician made three consecutive CCT measurements in selected eyes and the average value was considered for each case.
All subjects underwent a complete eye examination, which included refraction, screening for ocular and systemic diseases, slit-lamp biomicroscopy, and examination of the fundus. All subjects were free of any ocular pathology and had best-corrected monocular visual acuity of 20/20 (0 logMAR). All measurements were performed between 11a.m. and 2p.m. by only one observer.
Each device used in the study was correctly calibrated by technical staff before examinations. Subjects underwent CCT examinations with three different techniques. In each case the last measurement was always performed with the contact technique in order to avoid corneal impression. With non-contact techniques, subjects were asked to blink several times before measurements were taken in order to ensure a smooth tear film over the cornea's anterior surface.
The study followed the tenets of the Declaration of Helsinki and was approved by the Institutional Review Board. Informed Consent was obtained from all patients after explaining the nature and possible consequences of the study.
Instruments used in the studyOptical coherence tomographyCirrus HD-OCT S-5000 spectral optical coherence tomography (15) (Carl Zeiss Meditec AG – Germany) equipment was used for anterior segment analysis. It captures high resolution images of the cornea using non-contact OCT, and can also assess corneal thickness without direct contact. The captured image is aligned with the corneal apex area, looking for further corneal reflection. The system obtained 5 different images, separated by 0.25mm with 5μm of axial resolution and 15μm of transversal resolution. Once the image is saved, the instrument's calliper tool is used to identify the corneal limits (epithelium and endothelium) in order to obtain the CCT value in the different images.13,20 The mean value was taken as the CCT value.
Non-contact endothelial specular microscopyTopcon SP3000P non-contact endothelial specular microscopy (NCSM) (Topcon Corporation, Tokyo, Japan) was used for endothelial and pachymetric analysis. This instrument obtains central corneal images through a central fixation spot. This system provides an auto alignment that simplifies the capturing procedure, making its automated measuring system very fast and simple.18 The software automatically displays the CCT measurement, and the captured image is analyzed by software, providing the endothelial cellular density, pachymetry, hexagonality and variation coefficient.18,21 Participant's head movement was restricted with a chin-and-forehead rest and they were asked to look at the green fixation spot inside the apparatus. When the microscope obtained the endothelial focus by an automated process, it used a low-intensity flash to acquire the endothelial images. If the captured image was not perfectly clear and the endothelial cell outlines were not clearly visible, the image was eliminated and the process was repeated. Three consecutive measurements of each eye were taken, the mean value being used for this study.
Ultrasonic pachymetryUltrasonic corneal pachymetry was measured with a DGH Pachette3 USP (DGH Technology Inc. – Exton, PA – USA). Calibration was checked prior to each exam session and the velocity of ultrasound was set to 1640m/s. Cornea was anesthetized with one topical drug (oxybuprocaine 0.4% and tetracaine 0.1%) that was instilled in each eye. Three minutes later the CCT measurement was made using Pachette3 contact ultrasonic corneal pachymeter. The system made 10 consecutive measurements and the mean value was taken as the CCT value. Each subject was seated on a chair and asked to fixate on the wall opposite. The pachymeter probe was sterilized and aligned perpendicularly to the central cornea within the pupil area.21
Statistical analysisStatistical data was analyzed using SPSS 22.0 software (Inc, Chicago, IL – USA). Quantitative variables are given as a mean±standard deviation (SD). In this study Bland-Altman concordance method with the 95% limits of agreement (LoA) and intraclass correlation coefficient (ICC) in groups (USP–NCMS and USP–OCT) were used. Sample size was calculated using Granmo software v7.12 (Institut Municipal d’Investigació Mèdica, Barcelona, Spain) according standard deviation observed in previous pilot study: the software indicated a minimum of 44 observations required for α=0.05, risk β=0.20 in bilateral contrast with a detectable minimum difference of 6 measurement units, which was less than the difference between OCT and USP.
These tests were used to achieve the goal of this study: paired t-student analysis was performed to assess the mean values between pairs (USP–NCSM; USP–OCT; NCSM–OCT); Bland–Altman is a graphical method used to analyze the agreement between two different variables,22 and ICC indicates the degree to which measurements in the different devices resemble each other.23 Only after a complete analysis of all the statistical results can we establish a relationship of equivalence among the data obtained with the three devices.
After normality and equality of variances were assessed (Kolmogorov–Smirnov (K–S) method), parametric tests were performed to assess the bias between instruments. Differences were considered to be statistically significant when the p value was <0.05 (i.e., at the 5% level). One-way ANOVA test was performed with Bonferroni correction factor.
ResultsThis study included 60 eyes of 60 participants (28 men and 32 women) with a mean age of 66.5±15.0 years (range: 27–85) and a mean spherical equivalent of 0.43±1.14D (range: 1.50 to +4.50).
The highest CCT value was obtained with the USP (mean value 549.20±26.91μm; range from 503 to 618μm), followed by the OCT (mean value 542.80±25.56μm; range from 486 to 605μm). Finally, the lowest value was obtained with the NCSM (mean value 514.20±27.49μm; range from 456 to 586μm). The highest difference between pairs was found between NCSM and USP (−36.08±10.72μm; confidence interval −38.83 to −33.31μm; p<0.001), while the lowest difference was found between OCT and USP (−7.88±8.86μm; CI −10.17 to −5.59; p<0.001). The difference between NCSM and OCT was close to the NCSM and USP pair (−28.20±9.52μm; CI −30.66 to −25.74μm; p<0.001). One-way Anova test showed statistically significant differences between groups (p<0.001 in all cases). t-Student analysis showed statistically significant differences between mean values from all paired instruments (p<0.001 in all cases).
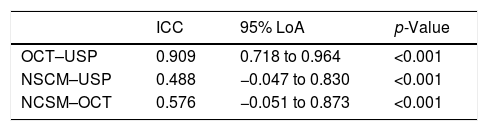
At the same time, the agreement between pairs of measurements was calculated using ICC values, and these values are shown in Table 1. The agreement between all pairs was significant (p<0.001).
Finally, Figs. 1 and 2 shows the results obtained in the Bland–Altman analysis. The highest concordance was found between OCT and USP (Fig. 1), with differences between 9.47 and −25.24μm (mean±1.96 SD) and a mean deviation of −7.88±8.86μm. Conversely, NCSM and USP (Fig. 2) showed the lowest concordance, with differences between −15.08 and −57.09μm (mean±1.96 SD) and a mean deviation of −36.08±10.72μm. The limits of agreement 95% (LoA=mean of the difference±1.96×SD of the differences) indicate that the values on the error between the pairs of measurement have exceeded the limits of concordance.
 and ultrasonic pachymeter (USP). Mean value and lower and upper limits of agreement (mean: 7.88μm; LoA: −25.24 to 9.48μm).")
 and ultrasonic pachymeter (USP). Mean value and lower and upper limits of agreement (mean: −36.08μm; LoA: −57.09 to −15.08μm).")
This study shows that CCT measurement with OCT is equivalent for non contact corneal thickness measurement system compared to USP. Among the methods for CCT estimation, USP has been the most commonly used in the last decades,1,4–6,9–11 although the necessary instillation of oxybuprocaine 0.4% for the accomplishment of the CCT measurement with USP has been also described previously as inducing changes in pachymetry, it has been shown that the mean of the pre and post anaesthetic CCT measures are not significantly different7,24,25 and CCT returns to baseline within 80s.24 On the other hand, today, however, many modern optically based pachymetric techniques are commercially available. The main advantage of the new measuring systems is that they avoid contact with the cornea, thus reducing the possibility of bacterial contamination, eye diseases infection, or epithelial damage.
For this reason, systems that provide rapid measurements, good portability and low costs should be taken into account due to being useful tools for screening data acquisition.7,11,12 At the same time, given the importance of this key parameter it is also important to assess the consistency and precision26 of CCT measurements with different devices. Previous studies have analyzed this relationship3,5,6,9,11,27–29 and the relationship between different SD-OCT devices from other manufactures.30–32 In most of those papers difference between OCT and USP measurement was similar to the differences shown in this work. Similarly with measures obtained with different NCMS devices.1–3 The fact that the differences results obtained between the devices in our study were similar to those previously published, gives consistency to our work, however not all of that previous papers had analyzed and/or compared the different devices under consideration by quantifying the degree of concordance and interchangeability. Therefore, in this study we have comprehensively analyzed the relationship among the CCT values obtained using USP, SD-OCT and NCSM systems, and we have also quantified the agreement of CCT values across these devices.
In relation to the average CCT values, the greatest NCSM–USP difference and the smallest OCT–USP difference obtained are similar to previous studies9,33 that showed equivalent differences between CCT measurements with NCSM and USP. The difference between values suggests a strong correlation between OCT and the reference test, that is, the USP. On the contrary, the largest difference between measurements made with NCSM and USP would indicate a worse relationship between them. As mentioned previously, USP is currently the gold standard measurement system; therefore, the smaller the difference with USP measurements, the better the relationship between values, especially in OCT.
Regarding these results, it should be noted that the difference between CCT obtained with each device is consistent regardless of the measurement obtained. This consistent difference is explained by the different operating principles of each device: NCSM uses light reflection and USP uses ultrasound reflection in each interphase. The posterior limit of the cornea is located in the space between Descemet's membrane and the anterior chamber,18 whereas NCSM considers the posterior limit in the endothelial cells stratus.
On the other hand, spectral OCT systems take nearly 26,000 A-scans per second with 5μm axial resolution. This high-speed scanning makes ocular movements negligible during measurements, giving a minimal corneal variation in the exam which results in a good repeatability.34 Moreover, it is quite difficult to measure within the same central corneal area. OCT and NCSM have macular fixation points, but the USP is manipulated by the clinician who chooses where to make the measurement. This might be considered a measure bias in the study and explain the small differences between OCT and USP. Besides this consideration, all the devices gave statistically significant different values. These results suggest that the relationship among them is not perfect. Therefore, in order to determine whether the different methods are comparable and interchangeable, we performed other statistical analyses.
In order to confirm the interchangeability of the measurements between different techniques we determined the ICC. The ICC analyses the correspondence between pairs of measurement values of each system. It analyses the average correlations between all possible orderings of the pairs of data available, thereby avoiding the problem of order dependence of the correlation coefficient.1 The relationship between values obtained by NCSM compared with the USP ones have a low ICC (Table 1), while matching values obtained with OCT and USP showed a significantly higher ICC. If we follow the Landis–Koch classification23 we can describe the relationship between NCSM and USP as “Regular” (0.21–0.40), and the relationship between OCT and USP as “Almost Perfect” (0.81–1.00). These relationships, coupled with the differences, confirm that the CCT measurements obtained by NCSM are neither comparable nor interchangeable with those obtained by USP. On the contrary, the lower differences between OCT and USP and their high ICC allow us to establish an agreement between these two devices and the possibility of interchanging their values. Therefore, according to the ICC values of each device, the reliability of the measurements with respect to USP–NCSM would be compromised, the measurement obtained by OCT being more reliable.
Finally, we also calculated the difference between measurement pairs USP–OCT by comparing the average value of each pair. These results are presented in Bland–Altman diagrams. This analysis helped us to determine graphically the relationship between value differences and how they relate to the mean value in the whole measurement range.
In this case (Fig. 1) the dots are aligned with the mean error line. It is important to note that vertical scale indicates the difference between measurements, which means that in the OCT–USP pair the measurement is more consistent with the average difference with the values showed in Bland–Altman diagram between NCSM and USP (Fig. 2). These results confirm the contribution of the ICC value.
ConclusionsCCT measurement with OCT has a good agreement and concordance with USP, and can be considered a reliable noncontact corneal thickness measurement system. Furthermore, is acceptable to interchange values between OCT and USP. On the other hand, CCT measurement obtained by NCSM reveals a very poor concordance versus the gold standard technique, making the technique more suited to longitudinal follow-up of corneal pathology patients.
FundingNo funding support was needed.
Conflicts of interestThe authors have no conflicts of interest to declare.
This research was made possible thanks to the technical staff, equipment and the optometry department of the Instituto de Ciencias Visuales (INCIVI) – Hospital La Zarzuela. Thanks to Professor M.A. Zato and the optometry department staff for their scientific and personal support.


