


The study of oxygen consumption rate under” in vivo” human cornea during contact lens wear has been technically a challenge and several attempts have been made in the last 20 years to model the physiology of the human cornea during contact lens wear. Unfortunately, some of these models, based on a constant corneal oxygen consumption rate, produce areas on the cornea where the oxygen tension is negative, which has no physical sense. In order to avoid such inconsistency, different researchers have developed alternative models of oxygen consumption, which predict the likely oxygen metrics available at the interface cornea/post lens tear film by determination of oxygen flux, oxygen consumption, and oxygen tension through the different layers (endothelium, stroma, and epithelium). Although oxygen deficiency produces corneal edema, corneal swelling, hypoxia, acidosis, and other abnormalities, the estimation of the oxygen distribution below the impact of a contact lens wear is interesting to know which lens transmissibility was adequate to maintain the cornea and avoid epithelial and stromal anoxia. The estimation of minimum transmissibility for a lens for extended wear applications will be very useful for both clinicians and manufacturers. The aim of this work is to present a complete discussion based on Monod kinetics model that permits give an estimation of oxygen partial pressure distribution, the profile distribution of corneal flux and oxygen consumption rate, and finally the estimation of the relaxation mechanism of the cornea depending on the oxygen tension at the interface cornea/post lens tear film. Relaxation time in this context can quantify the capability of the corneal tissue to adapt to increasing concentrations of oxygen. It is proposed this parameter as a biological meaningful indicator of the interaction between contact lens polymers and living tissues such as the corneal cellular layer.
Traditionally oxygen consumption has been considered constant across the cornea and the diffusion equation treated at steady state, and not as time-dependent.1,2 However, such consideration negative values of the oxygen tension in the cornea are frequently found, which has no physical sense.1–6
In order to solve this problem, the mathematical models used by different investigators determine the oxygen consumption in the cornea based on the determination of the oxygen partial pressure at the interface cornea-tear from in vivo estimations provided by Bonano et al.8,9 All these models describe the variation of oxygen consumption in the cornea as a function of the oxygen pressure Qc(pc).3–17 Other researchers have developed models in which oxygen consumption Qc(pc) is described by the sigmoidal model and even following a linear function of oxygen tension in the cornea, the so-called linear model.14 Finally, others have opted for the metabolic model to describe the oxygen consumption in the cornea.18–20 These last models describe oxygen consumption Qc(pc) as a function of oxygen partial pressure in the cornea considering aerobic metabolism.3–20 This model consider that when the oxygen tension is zero throughout the whole cornea, aerobic metabolism is not present and hence, the oxygen consumption is zero. It is known that metabolic reactions are limited by the reaction that occurs between oxygen and enzymes that act as catalysts. For high oxygen pressures, the reaction is saturated with oxygen and then Qc is independent of the oxygen pressure. In this case, the reaction involves aerobic respiration according to the reaction.21–23
In these cases the aerobic metabolism is quantified by the so-called metabolic model, also called Monod Kinetics Model or Michaelis-Menton Model, where one mole of glucose and six moles of oxygen react to produce six moles of carbon dioxide and six moles of water, with 36 mol of adenosine triphosphate (ATP).6,9,14–20
Conversely, in the case of having a small partial pressure of oxygen anaerobic respiration occurs, in which glucose generates lactic acid and the reaction is less energy-producing, resulting in only 2 mol of ATP per mole of glucose consumed.6,18–23
This reaction will lead to excessive corneal acidity resulting in an increase in pH with loss of transparency and corresponding physiological changes.24–27 In a physiologically healthy cornea, approximately 85% of corneal glucose consumption occurs through anaerobic glycolysis while the rest is through aerobic reaction.2,22 Of course, this same assumption must be made in the case of closed eyes, and therefore when the amount of oxygen decreases, anaerobic respiration is increased.28,29 The problem generated is the acidification of the stroma, with potential damage to the endothelium, which, although not suffering from oxygen deprivation because it is in contact with the aqueous humor can be altered with this more acidic environment. In 1981 Klyce,29 noted that the lactic acid production was doubled in rabbit eyes when they were in anaerobic condition resulting in the epithelium being under a hypoxic state, generating in the cornea the following reaction:5,18,29
The aforementioned reactions are critical to understanding how oxygen affects the swelling of the cornea and therefore their physiology. This is particularly relevant when contact lenses are being used and depending on their characteristics, oxygen permeability (P = Dk) and thickness (t). The transmissibility (Dk/t), defines the actual transfer of oxygen through the lens and depends on the permeability (Dk) of the material which is the product of the diffusion (D) and solubility (k) and thickness (t) of the lens. Consequently, when a contact lens is placed on a cornea, its physiology will be subject to the oxygen transmissibility induced by the material of the lens and, therefore, the surface of the corneal epithelium will be exposed to different degrees of hypoxia, swelling, lack of transparency, epithelial keratitis, neovascularization, mycrocysts, corneal acidosis, etc.30–35 As is known, the production of lactic acid is an indication that the cells of the cornea are not receiving enough oxygen by the oxidation of glucose.23
Alternatively, when there is a decrease in oxygen, the cells of the epithelium become hypoxic resulting in high production of lactic acid and the acidosis is generated.30,33,35 For all these reasons, the development of mathematical models that allow us to quantify the oxygen flux in the cornea, as well as the variation of the partial pressure of oxygen in the cornea (epithelium, stroma, and endothelium) are essential to predict the minimum contact lens oxygen transmissibility required to avoid hypoxia-induced corneal abnormalities.2–20
Finally, when hypoxia is transient, the relaxation to the steady-state is of short, less than 23 s, according to the experimental data of Bonanno et al.12,23 Del Castillo et al23 have analyzed the corneal relaxation time concluding that changes in corneal relaxation time are based only on passive diffusion coupled to enzymatic reactions to produce ATP. This description is far from when the cornea swells, because the physiological processes of the cornea are mechanisms that involve passive and active ion transport, and the recovery times are extended to 60 min or more.24 It is known that acidosis occurs in the anterior layer of the cornea (epithelium). For prolonged contact lens wear and lower diffusive of oxygen into the cornea persist hypoxia and hypercapnia are present, this causes retardation of the normal carbon dioxide efflux, and then corneal acidosis promotes endothelial polymegethism, epithelial microcysts, corneal edema, striate lines, infiltrative keratitis, neovascularization or limbal hyperemia among others.25 However, CLs with higher transmissibility may overcome some of these complications to promote a healthy cornea and from our point of view, such CLs providing relaxation times lower than 8 s because the amount of oxygen into the cornea is enough to facilitate the normal physiological processes.24–36 Relaxation time in this context represents the inertia of the biological corneal energetic system to adapt to a new changing oxygen environment. The shorter this time, the more rapid the tissue adapts and can take advantage of an increase in the oxygen availability after periods of hypoxia. Compared to other indicators, such as the biological oxygen apparent transmissibility (BOAT) or the partial concentration of oxygen, the relaxation time might directly correlate with the energy generation dynamics within the living cells.
We suppose that oxygen consumption rate varies with the lens wear onto the cornea and the oxygen consumption is a function of the oxygen partial pressure at the interface cornea-tears-lens that can be determined using the "Dye" technique, as has been used by Bonanno et al.8,9,13
In this work, based on the data provided Bonanno et al.,8,9,13 we carried out a refined model that allow us to quantify the oxygen flux in the cornea, as well as the variation of the partial pressure through the epithelium, stroma, and endothelium. For it, our model consider a system composed of six layers (endothelium / stroma / epithelium / tear / lens / tear) where the maximum consumption rate is focused on the epithelium when they were in an anaerobic situation resulting from the epithelium being in a hypoxic state. Such statement is founded in agreement with a work published before,37 where using the Monod kinetics model for oxygen consumption reaction with glucose, we observed an apparent discontinuity, around 105 mmHg of oxygen tension, at the interface cornea/post lens tear film. Such behavior was considered a consequence of an increase of acidosis and a decrease in the anaerobic transition where the corneal oxygen relaxation time can be a new biological parameter to stimate the corresponding physiological changes when a contact lens is wear.
Theoretical modelOur metabolic model considers the cornea, in first approximation, as a homogenous one-dimensional system formed by six layers to quantify the oxygen transport through the different layers of the cornea-tear-lens-tear system (endothelium, stroma, epithelium, internal tears, lens and external tear), as shown in Fig. 1. The oxygen tension profile can be understood as a function of position and time pc(x, t) and following the second law of Fick.5,7,8,19
. When the eye is closed oxygen flows from the palpebral conjunctiva (PC) and from the aqueous humor (AH) in the anterior chamber, while under open eye condition oxygen reaches the anterior surface of the cornea from the atmospheric air and AH.")
Schematic representation of a human cornea with a contact lens (right side). When the eye is closed oxygen flows from the palpebral conjunctiva (PC) and from the aqueous humor (AH) in the anterior chamber, while under open eye condition oxygen reaches the anterior surface of the cornea from the atmospheric air and AH.
The differential equation of transport of Oxygen in the cornea is given by
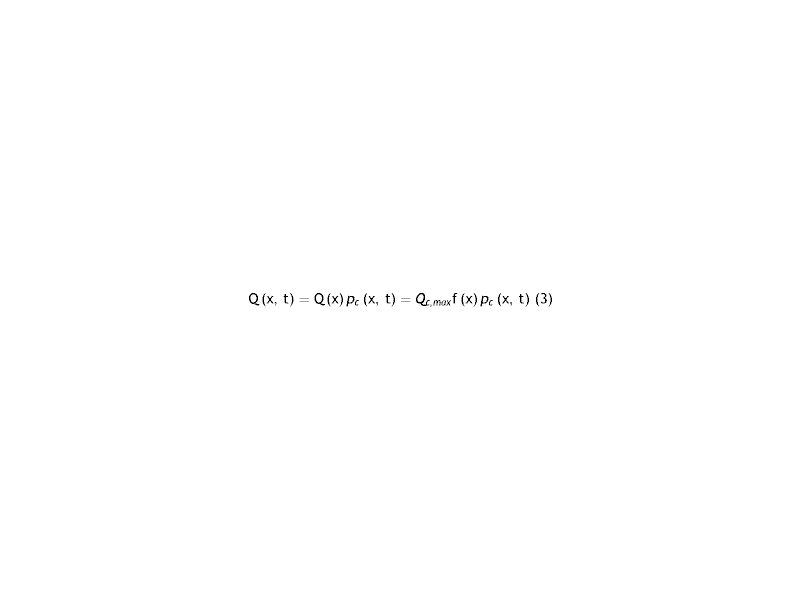
Where the sub-index i express each layer of the cornea (endothelium/stroma/epithelium), pc is the partial pressure of oxygen at any point of the cornea at time t, pc(x, t). Dc and kc represent the oxygen diffusion coefficient and oxygen solubility respectively, and Qc the oxygen consumption. We consider the general treatment of oxygen transport in the cornea, using the method of separation of variables. The following assumptions are introducedWith Where f (x) is the fraction of the dependence with the partial pressure of oxygen.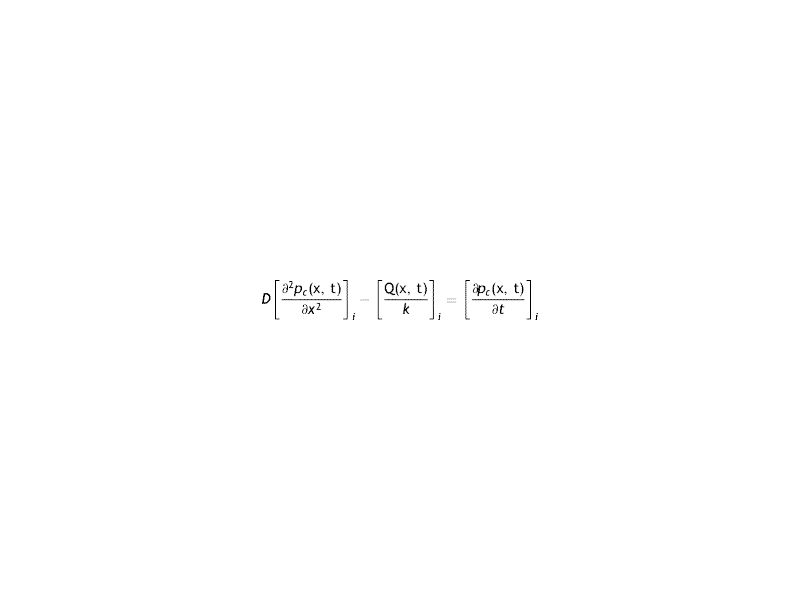


replacing the Eq.s (2) and (3) in (1) we have
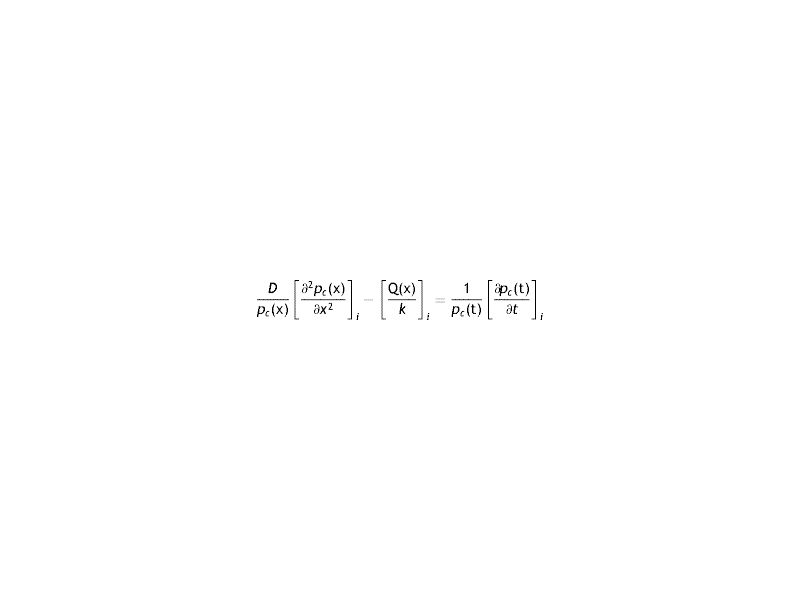
Since on each side of the equation the variations with x and t are independent, the equality is expressed as a constant (τ). It is the time of relaxation of the cornea to a variation of partial pressure of oxygen. Later it will be seen that this constant will depend on each lens used.
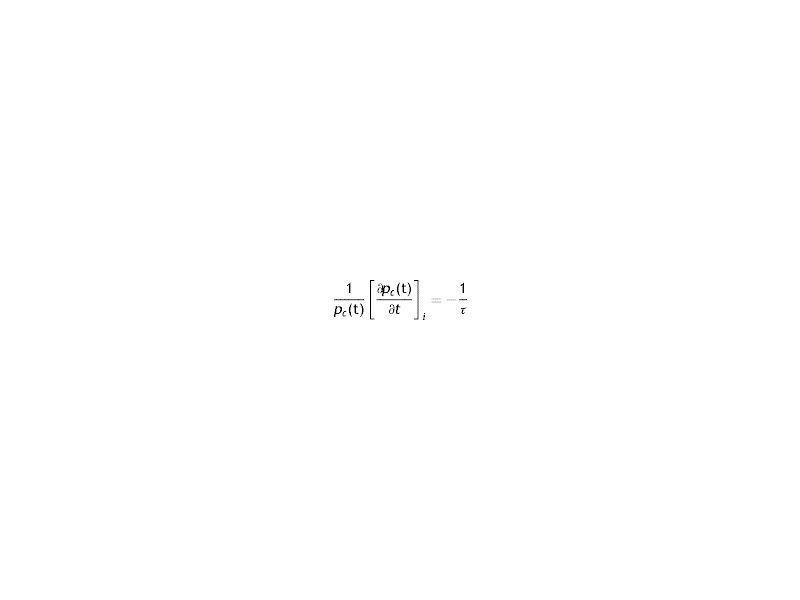
For solution of the previous equation the following relation is proposed
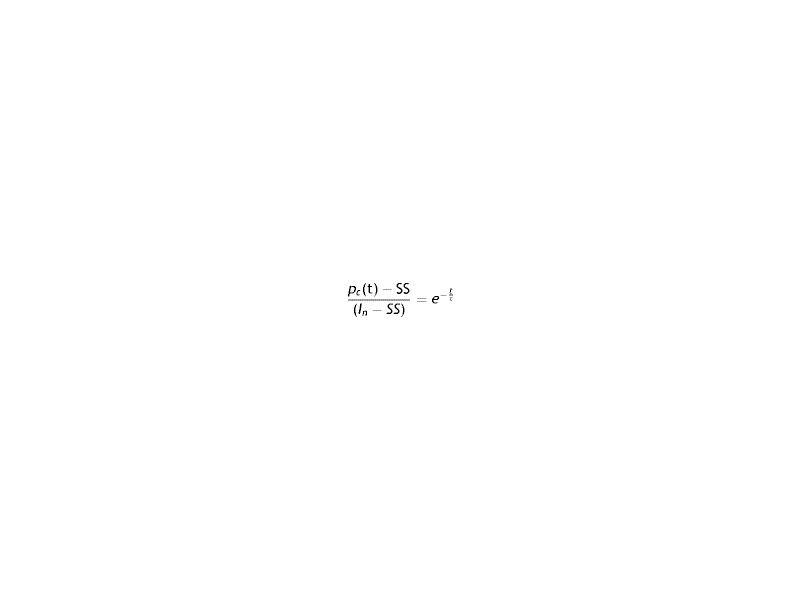
Which can be rewritten as

Which meets the experimental condition of the Bonano data.
If t = 0 then pc(0)=In. On the other hand, If t→∞, then pc(∞)=SS. Consequently, the equation for position dependence will be
It has
Arranging the terms of the equation we see the presence of a linear term in the partial pressure. Comparing this term with that of oxygen consumption, it is seen that the latter exceeds the former
That is

In fact, according to a numerical estimate of typical values, there is at least one difference greater than one order of approximation Qc,max≈10-4 cm3 of O2 cm-3s-1, k≈10-5 cm3 of O2 cm-3 and τ>1 s.
Under these conditions, the equation to be solved with the respective conditions to the boundary is the following
which, in general, will depend on the local oxygen tension at each point in the cornea.
The solution of Eq. (13) will depend on the models used for oxygen consumption in the cornea. That is, it will depend if the oxygen consumption, and therefore the oxygen partial pressure in the cornea will be different and therefore also the flow.The different oxygen consumption rate proposed to data are: a) constant with the oxygen tension,1,2,12 b) vary linearly,15 c) changes according to a sigmoidal variation,14 d) described as a metabolic model, also naimed Monod kinetics model,5,14–20 and e) metabolic model with the parameters used by Larrea and Büxler.15
On the other hand, the solution of eq(13) provides the profiles of oxygen partial pressure and flows, depending on the choice of boundary conditions. In the case of a human cornea it is common to consider that the aqueous humor oxygen tension is 24.1 mmHg,3,12,16–19,30,31 and at the interface cornea/post lens tear film the value is determined by the partial pressure in the atmospheric air (155 mmHg) in case of a cornea without lens below open eyes conditons and 61.5 mmHg from palpebral conjuntive below close eyes conditions, and depending of the transmissibility of the contact lens used in case of a lens wear, that is
The solutions of Eq. (13) in the cornea are function Qc(pc) as a result of aerobic metabolismat the epithelium, stroma and endothelium, respectively.
For the tears and lens, we have:
Note that the tear and lens have not oxygen consumption, and; therefore, Eq. (13) is simplified in tear and lens to expressions (14) and (15), respectively.
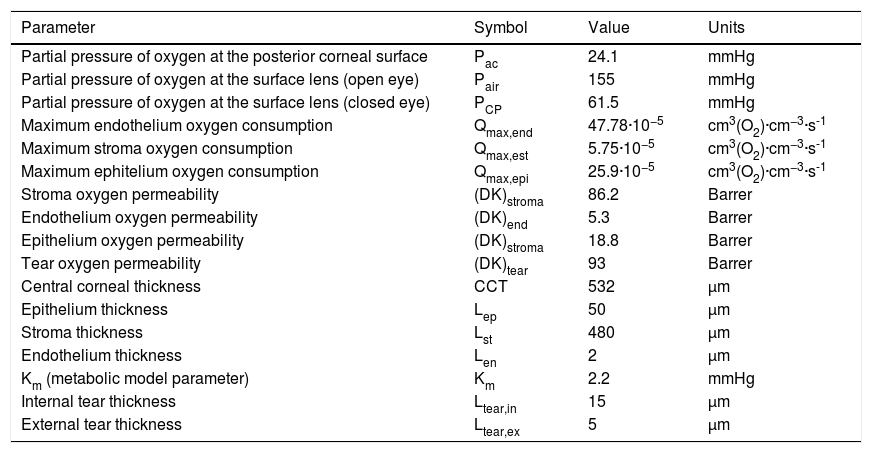
Parameters of the physiological modelSeveral authors have developed models with different parameters to study the distribution of oxygen through the cornea under different conditions. Most of them have made a one-dimensional analysis.1–5,7–19Table 1 lists the values that we have considered appropriate to develop an optimal model of the system endothelium/stroma/epithelium/tear/lens/tear with the current values of thickness of each region of the cornea (epithelium, stroma, and endothelium), internal and external tears, and values of diffusivities, solubility’s and oxygen consumption in each layer. Our model takes fixed parameters for the partial pressures of oxygen in the posterior cornea (aqueous), with value 24.1 mmHg3,12,16–19,37,38 compared to the value of 55 mmHg previously used by some researchers,21,39 and the oxygen tension in the front of the cornea, that is at the interface cornea-tear. The latter is determined by the transmissibility of the lens placed on the cornea. While some of these parameters, for many years, have been consistent with each other in the literature, others have changed widely. For example, the value of the flow in the anterior cornea has been reported in the literature within a wide range of values ranging from 1.6 to 10.9 μL·cm−2. h-1.40–44
Values of the parameters used to obtain the profiles of oxygen partial pressures and flow of oxygen through the cornea.
| Parameter | Symbol | Value | Units |
|---|---|---|---|
| Partial pressure of oxygen at the posterior corneal surface | Pac | 24.1 | mmHg |
| Partial pressure of oxygen at the surface lens (open eye) | Pair | 155 | mmHg |
| Partial pressure of oxygen at the surface lens (closed eye) | PCP | 61.5 | mmHg |
| Maximum endothelium oxygen consumption | Qmax,end | 47.78·10−5 | cm3(O2)·cm−3·s-1 |
| Maximum stroma oxygen consumption | Qmax,est | 5.75·10−5 | cm3(O2)·cm−3·s-1 |
| Maximum ephitelium oxygen consumption | Qmax,epi | 25.9·10−5 | cm3(O2)·cm−3·s-1 |
| Stroma oxygen permeability | (DK)stroma | 86.2 | Barrer |
| Endothelium oxygen permeability | (DK)end | 5.3 | Barrer |
| Epithelium oxygen permeability | (DK)stroma | 18.8 | Barrer |
| Tear oxygen permeability | (DK)tear | 93 | Barrer |
| Central corneal thickness | CCT | 532 | μm |
| Epithelium thickness | Lep | 50 | μm |
| Stroma thickness | Lst | 480 | μm |
| Endothelium thickness | Len | 2 | μm |
| Km (metabolic model parameter) | Km | 2.2 | mmHg |
| Internal tear thickness | Ltear,in | 15 | μm |
| External tear thickness | Ltear,ex | 5 | μm |
Fatt Dk unidades = 10−11 (cm2 s-1)[ml O2· cm-3 mmHg-1)]) = Barrer.
Fatt Dk/Lav unidades = 10−9 (cm ml O2)/(cm-3 s ·mmHg).
The values of the solubilities were calculated from the values of the permeabilities and diffusion coefficients assuming P = Dk for each layer of the cornea. We have considered that each layer have different diffusivities and they are given by the relationship: D = Dstroma = 1.59 Depithelium = 5.66 Dendothelium.1,2,10 Oxygen consumption used was the given by Fatt et al.,1,11 Qstroma = 5.75 × 10⁻⁵ cm3 of O2 cm-3 s-1 = 0.02xQend.15 and Qepithelium = 25.9 × 10⁻⁵ cm3 of O2 cm-3 s-1 given by Alvord et al.14
In this study, we have taken a value of 532 μm for the thickness of the total cornea, formed by three layers: epithelium, stroma, and endothelium of thicknesses; 50 μm, 480 μm, and 2 μm thick, respectively. Such thicknesses are very close to the values considered by other researchers.20 Each layer have a specific oxygen consumption which values are given in Table 1.3,14
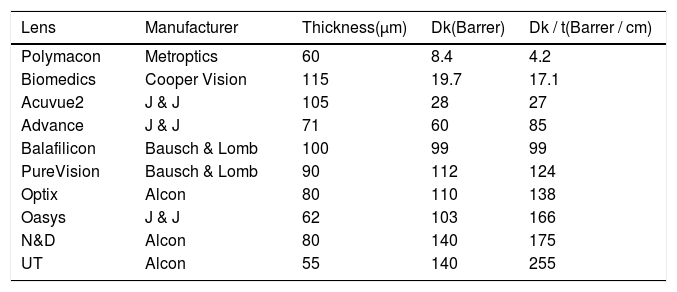
Working with the cornea oxygen consumption constant model or using the Monod kinetics model, it can be seen that we always find a minimum in the profile of the pressure gradient of oxygen in the cornea. This minimum depends on the pressure of oxygen on the surface of the anterior surface of the cornea, p (x = xc).3,10,21 In the position x = xmin, the derivative of the oxygen pressure relative to the position is: ∂pc∂xxmin=0 and therefore according to Fick's first law, the flow of oxygen at that point will be zero (J = 0). That is, at the minimum the oxygen flow providing from the endothelium (aqueous humor) with that coming from the surface of the anterior cornea (interface cornea-tear) after crossing epithelium is balanced. Therefore, a thorough understanding of such a position allows knowing what is the distribution of the oxygen partial pressure through the cornea and thus makes it possible to measure the density of cells that can saturate all available oxygen consumption. For this reason, we have carried out the study induced by the use of different contact lenses (CLs) with different transmissibilities analyzing the oxygen tension at the interface cornea/tear/lens caused by each contact lens. The characteristics parameters of each lens are gathered in Table 2.
Characteristic parameters, permeability, transmissibility, and thickness of the lenses used in determining the oxygen partial pressure at the interface of the cornea-tear cornea-tear-lens system in humans. These parameters have been measured by manufacturer.
| Lens | Manufacturer | Thickness(μm) | Dk(Barrer) | Dk / t(Barrer / cm) |
|---|---|---|---|---|
| Polymacon | Metroptics | 60 | 8.4 | 4.2 |
| Biomedics | Cooper Vision | 115 | 19.7 | 17.1 |
| Acuvue2 | J & J | 105 | 28 | 27 |
| Advance | J & J | 71 | 60 | 85 |
| Balafilicon | Bausch & Lomb | 100 | 99 | 99 |
| PureVision | Bausch & Lomb | 90 | 112 | 124 |
| Optix | Alcon | 80 | 110 | 138 |
| Oasys | J & J | 62 | 103 | 166 |
| N&D | Alcon | 80 | 140 | 175 |
| UT | Alcon | 55 | 140 | 255 |
To obtain in vivo a correlation between oxygen consumption and oxygen tension at the interface cornea-tear at the interface cornea-tear is required. For this, the "Dye" technique applied in vivo for human cornea with the arrangement of different contact lenses is the method more appropriate and frequently used.8,9,13 The technique allows obtaining in the time domain the variation of oxygen tension "in vivo" at the interface cornea-tear both in the case of open eyes (OA) and closed eyes (OC) when contact lenses are worn. With this information, we can have an experimental procedure that allows us to evaluate the time-dependent oxygen tension at the interface cornea-tear from the initial state to the steady-state value.
From the profile of oxygen tension, we have calculated the flows and oxygen consumption rate in each part of the human cornea, during contact lens wear considering a six-layer model for the total system where the parameters and main characteristics of the lens are given in Tables 1 and 2, respectively.
MethodsOne convenient method to obtain the solution of Eq. (13) is by using FiPy45 (public domain procedure http://www.ctcms.nist.gov/fipy) which solves numerically a wide number of partial differential equations (PDE) using the finite volume approach, and based on the Python language (Python Software Foundation).46 This leads to the numerical solution of the pressure profile, and from it is also possible to obtain the total profile of the oxygen flow in each of the layers of the cornea (endothelium, stroma and epithelium), taking into account the values of the parameters gathered in Tables 1 and 2. Further details of the procedure followed can be found in previous studies conducted for different types of lenses: scleral conventional hydrogels and silicone hydrogels carried out by our research group.5,7,10,17,37
In what follows we will analyze the solution to Eq. (13) to calculate the flow and oxygen consumption in a human cornea considered as a system composed of six layers (endothelium / stroma / epithelium / tear / lens / tear) where the maximum consumption rate was focused on the epithelium, which maximum oxygen consumption values were obtained previously for the same lenses, depending on the oxygen tension at the interface cornea/post lens tear film during contact lens wear using the monod kinetics model.37
ResultsIn the last years, the most frequently used model to characterize and quantify the aerobic metabolism is the Monod model.14,16,47 This model is based on the absorption kinetics of oxygen in the cornea and shows the relationship between corneal oxygen consumption and oxygen tension as
Where Km is the equilibrium dissociation constant and Qc,max represents the maximum oxygen consumption. Eq. (16) provide the functional relationship of oxygen consumption in the cornea by means of the function Qc(pc). The value of Qc(pc) varies from Qc(pc = 0) = 0 to the maximum oxygen consumption Qc,max, which should be obtained when oxygen tension at the interface cornea-tear is pxc = 155 mmHg. Such value is given at sea level in the case of open eyes (OE). In the case of closed eyes (CE), the variation will be from Qc(pc = 0) = 0 until the value considered for the oxygen tension at the palpebral conjunctiva (60.1 mmHg). The first value 155 mmHg in OE represents oxygen tension when corneal aerobic metabolism consumption reaches the maximum, identically; is the pressure necessary for the cornea to be in equilibrium, and therefore the reaction of aerobic metabolism of glucose with oxygen (Krebs cycle), is saturated. Therefore, in such circumstances, the cornea will begin to have an oxygen consumption independent of the partial pressure.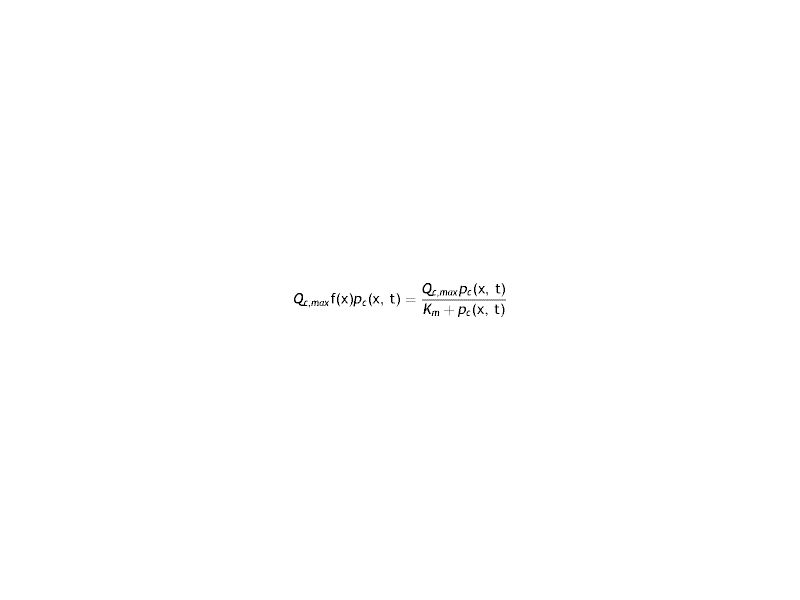
Corneal oxygen tension and oxygen flux profiles were calculated for the six-layer model considering the cornea with a contact lens wear. The complete system is divided by endothelium/stroma/epithelium/ internal tear /lens/ external tear. Applying the Monod kinetics model for the corneal oxygen consumption, we can get the oxygen tension and oxygen flux profiles for different oxygen partial pressure generated at the interface cornea-tear when a contact lens of different transmissibility is worn on human cornea. Depending on the transmissibility of the lens, different transitories of oxygen tensions are obtained at the interface cornea/post lens tear film. Fig. 5 shows the fit to the experimemntal data provided by Bonanno et al.8,9 using six layer for the metabolic model together with the parameters given in tables 1 and 2.
As we can see Fig. 2 show that the model together with the values of the parameters given in Table 1 provide good results for the distribution of the oxygen tension at the interface cornea/post lens tear film, and perfectly reproduce the experimental data of Bonanno et al.8,9 in both OE and CE conditions.

Oxygen tension measured at the interface cornea/tear film interface after 5 min of closed-eye lens wear for the different lenses analyzed in this study. The lines represent the numerical solution using six layers for the metabolic model and parameters given in tables 1 and 2. Symbols are the data provided by Bonanno et al.8,9.
Fig. 3 shows the steady-state oxygen tension profiles for the total corneal thickness, external tear/lens/internal tear/epithelium/stroma/endothelium, for all the lenses studied under OE and CE conditions, respectively. As we can see the oxygen tension profiles show non-negative values for the entire cornea. Besides this, Fig. 3 suggests that xmin moves as oxygen tension decreases at the interface cornea/post lens tear film. On the other hand, from the transitory obtained in Fig. 2, we have calculated the value of the steady-state oxygen tension at the interface cornea/post lens tear film when a lens is wear. Knowing the oxygen tension at the cornea/postlens tear film the value of average Qc,max in the endothelium, stroma, and epithelium, were estimated using Eq. (11). To this end, we have solved the differential equation given by the partial differential Eq. (2), inserting the equation for Q(p) corresponding to the metabolic model discussed above eq.(16). The values obtained are given in Table 3. A detailed development of the procedure used in the numerical solution can be found in the appendix of Compañ et al. showed in the references5,7,17,37 and discussed in Appendix A of reference 46, available at http://links.lww.com/OPX/A261.

Steady-state oxygen tension profile through the different parts of the cornea, lens, and tears, for each one of the lenses: Polymacon, Biomedics, Acuvue2, Advance, Balafilcon, PureVision, Optix, Oasys, N&D and UT, respectively, considering open eye and closed eye conditions. Also the case of a cornea without lens is considered.
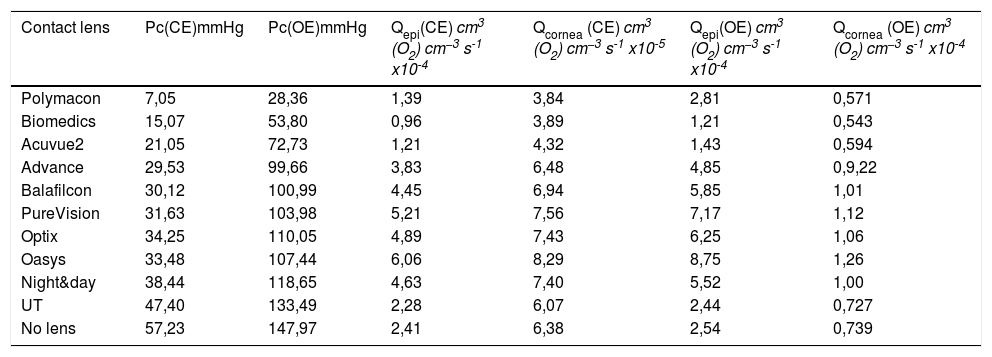
Oxygen tension at the interface cornea/post lens tear film in close eyes (CE) and open eyes (OE) conditions and calculated average oxygen consumption in the epithelium and total cornea during soft contact lens wear.
| Contact lens | Pc(CE)mmHg | Pc(OE)mmHg | Qepi(CE) cm3 (O2) cm−3 s-1 x10⁻⁴ | Qcornea (CE) cm3 (O2) cm−3 s-1 x10⁻⁵ | Qepi(OE) cm3 (O2) cm−3 s-1 x10⁻⁴ | Qcornea (OE) cm3 (O2) cm−3 s-1 x10⁻⁴ |
|---|---|---|---|---|---|---|
| Polymacon | 7,05 | 28,36 | 1,39 | 3,84 | 2,81 | 0,571 |
| Biomedics | 15,07 | 53,80 | 0,96 | 3,89 | 1,21 | 0,543 |
| Acuvue2 | 21,05 | 72,73 | 1,21 | 4,32 | 1,43 | 0,594 |
| Advance | 29,53 | 99,66 | 3,83 | 6,48 | 4,85 | 0,9,22 |
| Balafilcon | 30,12 | 100,99 | 4,45 | 6,94 | 5,85 | 1,01 |
| PureVision | 31,63 | 103,98 | 5,21 | 7,56 | 7,17 | 1,12 |
| Optix | 34,25 | 110,05 | 4,89 | 7,43 | 6,25 | 1,06 |
| Oasys | 33,48 | 107,44 | 6,06 | 8,29 | 8,75 | 1,26 |
| Night&day | 38,44 | 118,65 | 4,63 | 7,40 | 5,52 | 1,00 |
| UT | 47,40 | 133,49 | 2,28 | 6,07 | 2,44 | 0,727 |
| No lens | 57,23 | 147,97 | 2,41 | 6,38 | 2,54 | 0,739 |
From oxygen tension profiles given in Fig. 3, the oxygen consumption profiles were obtained using Eq. (2) and (11). For this, a value constant of 2.2 mmHg for the parameter Km and the values of oxygen permeability, in the endothelium, stroma and epithelium, indicated in Table 1. The results are shown in Fig. 4.

Oxygen consumption for epithelium, stroma, and endothelium considering a human cornea with a contact lens Polymacon, Biomedics, Acuvue2, advance, Balafilcon, PureVision, Optix, Oasys, N&D and UT, wear, respectively, below conditions of OE and CE. Also the case of a cornea without lens has been considered.

Flux profiles versus depth from endothelium obtained for the complete system cornea/internal tear/lens/external tear following the metabolic model considering the values of oxygen consumption rate and permeabilities of tear and lens given in tables 1 and 2.
Once we get the oxygen consumption, for each oxygen tension at the interface cornea/post lens tear film, we have studied the change of the oxygen consumption in the cornea. As we can see in Fig. 4, the values of oxygen consumption in the epithelium, stroma and endothelium are quite different and also this consumption depends on the type of lens, i.e. on the value of the oxygen tension at the interface cornea/post lens tear film.
Table 3 show the values calculated, for the average oxygen consumption into the epithelium and total cornea obtained for a human cornea during a contact lens disposed on the cornea, below closed eyes(CE) and open eyes (OE) conditions.
The most important thing we must note is that oxygen consumption Qc,max expected should be the same regardless of the type of lens, however as we can see the consumption differs from one lens to another, as can be drawn from the values tabulated in Table 3. For example for the N&D lens, below open eyes conditions, the average oxygen consumption is 9.99x10⁻⁵ cm3 of O2/cm3 tissue s, being the consumption in the epithelium of 5.5x104 cm3 of O2/cm3 tissue s. This consumption is two times higher than consumption obtained for the lens UT which in the epithelium has been consumed 2.44x10⁻⁴, being the average around 7.3 × 10⁻⁵ cm3 of O2/cm3 tissue s. While in closed eye conditions the average oxygen consumption was 7.4x10⁻⁵ cm3 of O2/cm3 tissue s, being the average oxygen consumption in the epithelium of 4.63x10-4 x10-4 cm3 of O2/cm3 tissue s. While in the same conditions for the UT lens the total consumption values were 6.1x x10−5 cm3 of O2/cm3 tissue s. However, the oxygen tension at the interface cornea/post lens tear film is about 118.6 mmHg for N&D lens while in the case of the UT lens the oxygen tension was 133.4 mmHg in OE and in CE conditions the values was, respectively, 38.4 mmHg and 47.4 mmHg.
It is quite significant that lenses producing low oxygen tension at the interface cornea/post lens tear film produce low oxygen consumption in the cornea when compared to others. For example, it can be seen that the Biomedics lens in OE leads to an average oxygen consumption in the complete cornea of 5.4 × 10⁻⁵ cm3 of O2/cm3 tissue s (1.2 × 10⁻⁴ cm3 of O2/cm3 tissue s in the epithelium) for an oxygen tension at the interface of 53.8 mmHg, while this values in CE is for the total cornea of 3.9x10⁻⁵ cm3 of O2/cm3 tissue s with an oxygen tension at the interface cornea/tear of 15.1 mmHg.
Considering all the lenses studied the estimated average value in vivo for the oxygen consumption in a human cornea below OE conditions is about 8.8 × 10⁻⁵ cm3 of O2/cm3 tissue s and 6.2 × 10⁻⁵ cm3 of O2/cm3 tissue s in CE conditions, using a six layers Monod kinetics model. However, this value is lower than the expression obtained considering Larrea et al.,15 which average was 2.07 × 10⁻⁴ cm3 of O2/cm3 tissue s, and quite similar to the obtained by Chhabra et al.16 of 1.05 × 10⁻⁴ cm3 of O2/cm3 tissue s. Assuming as valid the Monod kinetics model with the parameters given in tables 1 and 2, our results are considerably higher, than the average rate of 5.75 × 10⁻⁵ and 4.85 × 10⁻⁵ cm3 of O2/cm3 tissue s, obtained in vivo with human corneas considering a constant oxygen consumption.11,48,49
We calculated oxygen flux for the complete cornea from the oxygen tension profiles and oxygen consumption showed in Figs. 3 and 4. For this, we have takimg into account that the flux slope at each point in the steady state represents oxygen consumption, because
Where the sub-index i express each layer of the cornea (endothelium/stroma/epithelium) and pc(x) is the partial pressure of oxygen at any point of the cornea.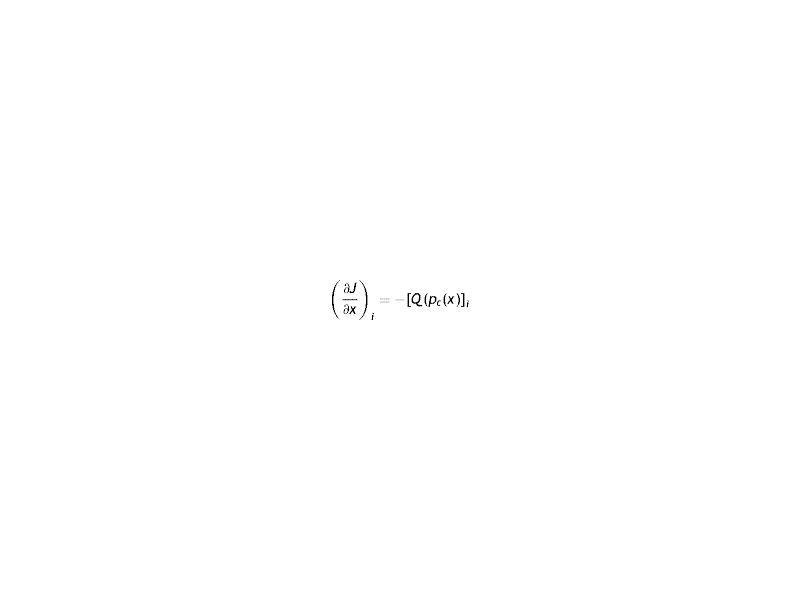
Oxygen fluxes profiles versus depth from endothelium obtained for the complete system cornea/internal tear/lens/external tear following the metabolic model considering the values of oxygen consumption rate and permeabilities of tear and lens given in tables 1 and 2, are shown in figue 5.
Fig. 6 shows the relationship between oxygen consumption and the oxygen partial pressure at the interface cornea/post lens tear film, for a human cornea during different soft contact lens wear below OE and CE conditions. Surprisingly we observed that around 105 mmHg of oxygen tension a maximum consumption value is reached in OE conditions and a decrease is found at higher levels of oxygen tensions at the interface for Hy-Si contact lenses. A similar behavior is observed in CE conditions where a maximum consumnption is observed around 33 mmHg with an identical distribution of the lens in the range of oxygen tension at the interface cornea/post lens tear film. These behavior could be related with the "Dye" technique, as has been used by Bonanno et al.8,9,13
.")
Change of average oxygen consumption with oxygen tension at the interface cornea/post lens tear film, obtained for a human cornea during different soft contact lens wear below OE and CE conditions. The colour correspond to the same lens that in OE and CE. (Polymacon "black", Biomedics "red", Acuvue2 "green", Advance "blue", Balafilcon “yellow", PureVision "orange", Oasys "cyan", Optix", N&D "dark-yellow", UT "violet", No lens "olive").
Hovewer, we can observe at lower oxygen tension end of the open eye data fit very well with the upper end of the closed eye data, which is consistent with that could be expected if corneal physiology responds to oxygen level.
Indeed, the values determined for the average oxygen corneal consumption below OE conditions for the contact lenses, fall with a tendency predicts non-zero oxygen consumption even when the oxygen tension at the interface cornea-tear is zero, which seems correct, given the contribution from the aqueous humor. This study may have some limitations, but this is linked to the experimental values obtained under indirect measurements taken at the corneal tear interface when a contact lenses is wear.
DiscussionAccording to the Monod kinetics model, where the oxygen consumption rate is given by Eq.(16), we can see that when pc(O2) = 0 the oxygen consumption is also zero (Q(pc) = 0), and consumption increases with pressure to reach a saturation limited by the experimental values obtained by Bonanno et al.7,8 At low oxygen tension, the metabolic activity is reduced and the cells react to compensate for the absence of oxygen with an increase in the thickness of the cornea. Research recently conducted, aimed at modeling the distribution of oxygen in the cornea, has shown that for oxygen tension of about 70 mmHg at the interface cornea/post lens tear film, a small portion of the stroma is anoxic, and for oxygen tension below 40 mmHg, basal epithelial cells are hypoxic.11,12 For high pressure, oxygen consumption is limited by the equilibrium concentration of the activated complex formed by reactions between oxygen and enzymes that act as catalysts in the reactions. In such circumstances, the reaction is saturated and oxygen consumption reaches its maximum value Qc(pc) = Qc,max, corresponding to a pressure of pc = 155 mmHg oxygen in open eye conditions at sea level.
The Monod kinetics model predicts, however, that the rate of epithelial oxygen consumption represents approximately 50-60% of total oxygen consumption in the cornea for the entire range of oxygen tensions analyzed. In the stroma, the percentage varies between 33 and 43% of total corneal oxygen consumption.
Clearly, the variation of average of oxygen consumption is a function of the oxygen tension. However, from the results shown in Fig. 6, for oxygen tension around 105 mmHg an apparent discontinuity resembling a phase transition is observed.37 It can also be noted that this discontinuity is inherent to the metabolic model. A detailed observation of Fig. 6 shows a Lambda shape behavior which appears when there is a phase transition of matter. One possible explanation for discontinuity observed might be the following: The average of oxygen consumption increases with acidosis and decreases with anaerobic transition.5,11 Furthermore, we also observed that greater reductions in oxygen tension at the cornea/post lens tear film are accompanied by a decrease in oxygen consumption, therefore, a lower amount of glucose will react with the oxygen, and anaerobic respiration occurs, in which glucose generates lactic acid and the reaction is less energy-producing, resulting in only a few moles of ATP per mole of glucose consumed. It is possible due to changes in the concentration of oxygen related with the anaerobic respiration.
To include these effects (acidosis and lack of oxygen) in the models of oxygen distribution when a contact lens is arranged on the cornea, we should modify the equation describing the metabolic model by adding additional terms that better reproduce the behavior of the cornea. The biological interpretation of the shape of Fig. 6, is justified among 106 and 135 mmHg pressure through expression
being Qs the consumption at the discontinuity where p = ps, and pH and KpH two parameters characterizing acidosis. The minus sign in Eq. (18) reflects the fact that the reference value is to the left of the pressure range considered where oxygen consumption decreases.
Furthermore, considering the pressure range below the maximum pressure ps (ps values between 50 and 106 mmHg), it is possible to analyze such variation due to the change in glucose concentration. This variation can be described by the expression.19
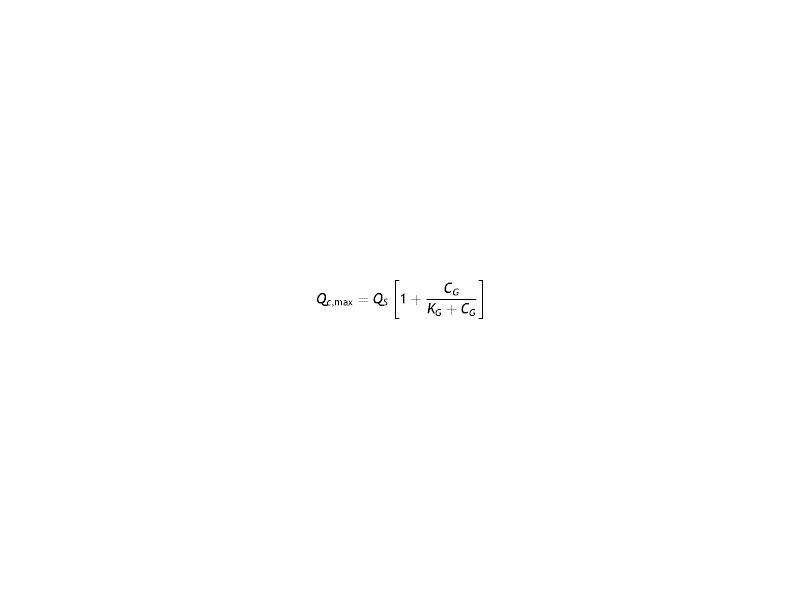
CG being glucose concentration and KG+Kob, and b being estimated as b = 12.2 nM from the value of KG = 0.4 mM.19,37
As a consequence of the above discussion, in the corneal metabolism, this transition is assumed to be discontinuous. It has to be understood not only as a result of metabolic reactions that occur in the Krebs cycle but also from other reactions that occur in the cornea when a lack of oxygen is present.19,16 Also, other phenomena in addition to the above can occur such as corneal swelling, acidosis, limbal hyperemia, neovascularization, keratitis, lack of transparency,32–34 which may be described as a nonlinear function of the pressure.3,19,43 Such an assumption is based on different clinical studies. For example, the works of Holden and Mertz's35,50 and Uniake51 found that corneal swelling showed a linear relationship with the oxygen flux (i.e. transmissibility) when a contact lens is placed onto the cornea. Furthermore, Bonanno et al8,9 and Giasson et al.31 observed that hydrogel contact lenses placed onto the cornea may induce acidosis. Harvitt and Bonanno48 postulated that acidosis increases 1.8 times the consumption of oxygen in the cornea with respect to a normal pH, considering that acidosis activates the pH regulatory mechanism in the cornea. Thus the increase in energy demand for these processes causes an increase in oxygen consumption producing additional molecules of ATP through oxidative phosphorylation. Therefore, the maximum in Fig. 6 in OE can be explained in biochemical terms. Finally, in the case of OE at low pressures in Fig. 6, it could also be explained following the work of Frahm et al.,52 where it is clear a drop of oxygen consumption following a decrease in glucose concentration due to anaerobic respiration. Only excess glucose is independent of the glucose concentration in breathing. Therefore, we can say that the metabolic model for the reaction of oxygen consumption by glucose consumption explains the maximum as a transition from aerobic to anaerobic metabolism.
Thus as has been suggested previously we also feel that the simplest mechanism to describe the transition is modifying the expression supporting consumption in the metabolic model by adding a factor or term containing other variables than the partial pressure of oxygen, such as described by Eq.s 18 and 19.
Finally, we calculate the time required for the partial pressure of oxygen at the cornea/post lens tear film interface to reach the stationary state under stress conditions. These transient-relaxation time were obtained for the different lenses using the Eq.(8) to fit the experimental data of oxygen tension showed in Fig. 2. From the transitoris, we separate the Fick`s diffusion behavior given by the passive CL and tears from the active cornea by subtraction of the time-lags of both CL (τl) and tears (τtears). For this, the eq.(8) were modified to the expression.53
where κc is the inverse of the relaxation time of the cornea alone and SS the stationary value of oxygen tension for a given CL being IN the initial value.The eq.(20) allowed the estimation of the corneal relaxation time wearing a contact lens.The cornea relaxation time obtained to different oxygen tension measured at the cornea/post lens tears interface for each lens are plotted in Fig. 7.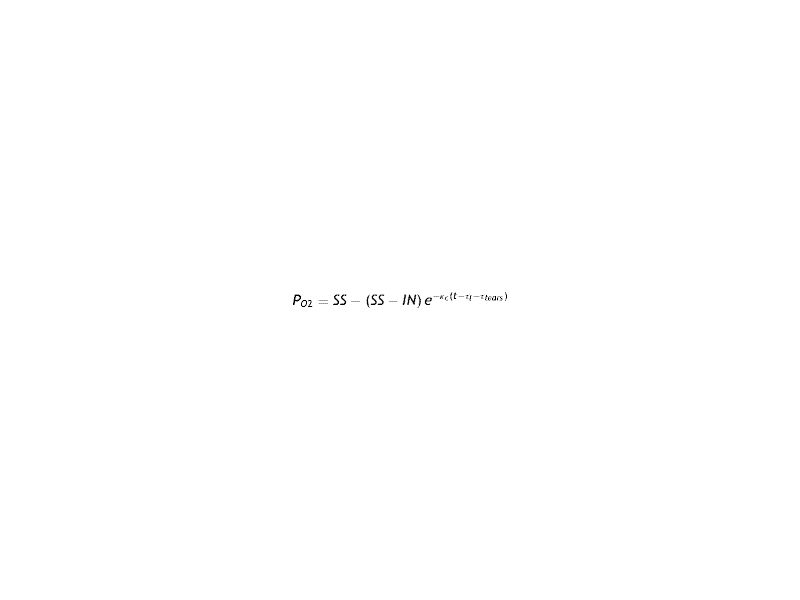

Variation of the relaxation time of the cornea versus oxygen tension at the cornea/post lens tear film interface for each one of the lenses considered in this study using the Monod kinetics model. In the Inset we plot the oxygen transmissibility coefficient of the lenses as a function of the oxygen tension at the interface cornea/post lens tear film.
A close observation of Fig. 7 let us conclude that conventional hydrogel CLs with relaxation times bigger than 8 s ( are displayed on the left side of this figure, while the cohort of silicone-hydrogel CLs, with relaxation times below 8 s, are on right side of the same figure. To give a more general and complete evaluation, we must also include the following two cases in the plot.
First when the cornea is in open eyes condition the tear surface is in contact with the ambient atmosphere at sea level (oxygen tension ≅155 mmHg) and the transient -relaxation time τ is about 1 s. This value represents the aerobic response of the cornea where six moles of carbon dioxide and water are produced for each mole of glucose consumed, and 36 mol of adenosine triphosphate (ATP) are produced.
On the other hand, in Fig. 7, the opposite case is considered, where the anterior tear surface over the cornea is exposed to an oxygen partial pressure of zero where the relaxation time will be equal to 21.5 s. This value represents the rate of production of ATP by glycolysis. In such a situation the anaerobic breakdown of glucose requires the consumption of 1 mol of glucose to produce two moles of lactic acid, and only two moles of ATP are produced. The result is a rate equal to 36/2. Comparing these two extreme values with the ten experimental values of CL generated data obtained from the Bonnano et al. it was found the resulting straight line as shown in Fig. 7. On the other hand, we can observe that the cornea is sufficiently oxygenated in all layers (epithelium, stroma, and endothelium) when the interface cornea/post lens tear film is maintained at a pO2 above 70−80 mmHg, but may suffer hypoxia, acidosis, swelling, etc. below this value. Moreover, our study show that in case of conventional hydrogel contact lenses the cornea relaxation times are bigger than 8 s., while in case of Si-Hy contact lenses the cornea relaxation time associated to the oxygen diffusion process is below of 8 s. Said cut-off time correspond to an oxygen tension at the interface cornea/tears-lens of around 80 mmHg. This value is observed in the inset figure corresponding to the intersection of the straight lines that make up both types of oxygen diffusion, which we associate to different relaxation times. Relaxation time in this context can quantify the capability of the corneal tissue to adapt to increasing concentrations of oxygen. It is proposed this parameter as a biological meaningful indicator of the interaction between contact lens polymers and living tissues such as the corneal cellular layer. This parameter could be a substitute of the oxygen transmissibility, which is characteristic of the lens, since although both are determined by indirect experimental procedures, the measurement of the corneal relaxation time is taken for the lens placed on a human cornea, while the transmissibility is measured with an experimenta equipment without to be in contact with an human cornea.
This description is far to be complete when the cornea swells, because the physiological processes of the cornea are mechanisms that involve passive and active ion transport, and the recovery times are extended to 60 min or more.54 Most of the acidosis occurs in the anterior layers of the cornea. For prolonged contact lens wear, when hypoxia and hypercapnia are present, this causes retardation of the normal carbon dioxide efflux. Corneal acidosis promotes endothelial polymegethism, epithelial microcysts, corneal edema, striate lines, and infiltrative keratitis.36
Finally the inset show the variation of the oxygen transmissibility coefficient versus the oxygen tension at the interface cornea/tear-lens measured for each one of lenses studied. From this inset we can conclude that in case of conventional hydrogel contact lenses the cornea relaxation times are bigger than 8 s., while in case of Si-Hy contact lenses the cornea relaxation time associated to the oxygen diffusion process is below of 8 s. The oxygen tension at which the change of transmissibility coefficient change from sub-diffusive to over-diffusive is around 80 mmHg of oxygen tension.
This study presents some limitations. First, the relaxation times are derived from indirect measures that should be verified experimentally by direct methods. However, such methods are not available at present to measure this properties in the living eye. Advances in non-invasive in vivo corneal imaging techniques such as confocal miscroscopy or optical coherence tomography coupled with fluorophotometric methods or other molecular methods that could reveal the actual energy generation within the cornea, might be crucial for these direct experimental evidences.
ConclusionsThe application of the Monod kinetic model successfully reproduces the experimental results for the transients of oxygen tension at the interface cornea/post lens tear film after eye closing while wearing contact lens, and the value at steady state for all the lenses were analyzed. Our study suggests that the position of least stress of hypoxia (xmin) changes with the decrease of the oxygen partial pressure, being a linear function of the oxygen tension at the interface cornea-tear. Of course, this result is not intrinsic to the cornea but depends on the model.
The results show that the position of minimum oxygen tension varies from the value of xmin of 1,25 μm for oxygen tension above 155 mm Hg (open eye at sea level) until about 340 μm for a pressure of 18 mmHg at the interface cornea/post lens tear film for a lens as Polymacon.
The Monod kinetics model predicts, however, that the rate of epithelial oxygen consumption represents approximately 50-60% of total oxygen consumption in the cornea for the entire range of oxygen tensions analyzed. In the stroma, the percentage varies between 33 and 43% of total corneal oxygen consumption.
The cornea is sufficiently oxygenated in all layers (epithelium, stroma, and endothelium) when the cornea-tear interface is maintained at a pO2 above 70−80 mmHg, but may suffer hypoxia, acidosis, swelling, etc. below this value.
When a contact lens is worn on a human cornea, our study suggests the emergence of discontinuous transition kinetics. This transition must be understood not only as a result of metabolic reactions that occur in the Krebs cycle but also from other possible reactions that can take place in the cornea as a result of changes in the oxygen pressure. Thus, for pressure changes at high oxygen tensions (between 100 and 155 mmHg), a pH change can occur leading to increased oxygen consumption. On the other hand, in the range of low to moderate pressures, other different phenomena can occur, such as corneal swelling, acidosis, loss of transparency, keratitis, neovascularization, and limbal hyperemia, and other, which may be described by a nonlinear function with pressure.
The peak observed in Fig. 6 may be explained in biochemical terms. Only excess glucose respiration is independent of glucose concentration. Monod kinetics model to the reaction of oxygen consumption indicates that the maximum of glucose is a transition from aerobic to anaerobic metabolism. Normal diffusive behavior occurs when the cornea is considered as a non-reactive single homogenous tissue with a specified width and characterisc diffusion coefficient (it leads to a transient-relaxation time of 8 s). The higher-diffusive regime accounts for faster responses due to the oxygen flow around the areas where the aerobic chemical reaction produces ATP (less than 8 s). When the hypoxia is transient, the relaxation to the steady-state is short (less than 23 s) according to the experimental data analyzed, implying changes based only on passive diffusion coupled to enzymatic reactions to produce ATP.
Finally, when lower diffusive processes into the cornea persist, particularly under very low levels of oxygen partial pressure, different complications might be observed including corneal swelling, corneal acidosis, decreased corneal transparency, keratitis, neovascularization or limbal hyperemia among others. However, CLs with higher transmissibility may overcome some of these complications to promote a healthy cornea, and from our point of view, providing relaxation times lower than 8 s. In this sense, we propose this parameter as a biological meaningful indicator of the interaction between contact lens polymers and living tissues such as the corneal cellular layer.
This work will promote to the clinisians the discussion of the possible implications of our calculations in the context of the physiology of the cornea, both under normal conditions and in the presence of CLs. To manufacturers, to develop highly transmissibility contact lenses so that they are capable of providing an oxygen tension at the interface corneal/ post lens tear film up of 80 mmHg with the intention to provide relaxation times higher than 8 s.
Conflicts of interestThe author has no proprietary interests or conflicts of interest related to this submission. This submission has not been published anywhere previously and it is not simultaneously being considered by any other publication.
Finally the authors are very grateful to the comments made by the reviewers with the sole interest of the refining the manuscript.
This work was supported by the Government of Spain (project no. PID2019-108434GB-100 AEI/FEDER,UE), and Universitat Jaume I (project no. UJI-B2018-53). This research was funded by DGTIC-UNAM, with access to the Miztli-UNAM supercomputer, with the project LANCAD-UNAM-DGTIC-055. This work was supported by UNAM-PAPIIT projects IG 100618, IG 114818, IN114318, IN120120.The authors want to thank Alberto López, Cain González, Alejandro Pompa, and Alan Ortega for technical help.


