


To assess the feasibility of a novel method for simulating a Rigid Gas Permeable Contact Lenses (RGP-CL) fitting using 3-D printed sclero-corneal surfaces (SCSs).
MethodsThe experiment involved the fabrication of two resin SCSs with biconic corneal geometry and the participation of 22 optician-optometrists as observers. Participants compared the fluorescein patterns of three RGP-CL fitted on each SCS with theoretical patterns generated through computer simulation. To standardize visualization, comparisons were conducted through a multiple-choice questionnaire composed of 6 questions. Each question presented one main fluorescein pattern (either theoretical or experimental) and four additional patterns obtained using the other technique. Optometrists were required to select the fluorescein pattern more similar to the main pattern. A statistical analysis was performed to evaluate the accuracy of the comparison between the two methods.
ResultsThe surface quality of the printed SCSs was sufficient to produce consistent and interpretable fluorescein patterns. In all questions, at least 70 % of optometrists selected the correct pattern. In four questions, more than 90 % identified the correct pattern, and in one question accuracy reached 100 %. The correct option was always the most frequently chosen, with a significantly higher rate than the second most selected option (p = 0.05).
ConclusionsThe ability of most optometrists to correctly identify patterns suggests that, even without polishing, 3-D printed SCSs can simulate fluorescein patterns closely resembling theoretical ones. This approach shows promise as a supportive tool for training in RGP-CL fitting.
Fitting rigid gas permeable contact lenses (RGP-CL) can be a complex process, especially for toric and other rotationally asymmetric designs.1 The traditional method employs corneal data (typically keratometer and white-to-white measurements) as the first step to evaluate different fluorescein patterns with real trial lenses.2
In particular, learning to fit contact lenses (CLs) in a clinical facility allows students to observe real-time fluorescein patterns, eyelid interactions, and evaluate the centering and stability of the CLs on the corneal surface. However, in a real clinical environment, it is also challenging to have available a wide range of significant cases. Furthermore, patient chair time availability is also limited. Both limitations complicate the learning process for different types of RGP fittings and the ability to address irregular cases effectively2. Patients with irregular corneas have been shown to be the ones that would benefit from RGP-CL since their visual acuity that cannot be achieved with glasses or soft contact lenses.3–5
As an alternative method, software simulation of fluorescein patterns based on topographical data allows modifications of CL parameters and visualization of the expected fitting changes without requiring patient involvement. Because of its inherent versatility, learning with computer fluorescein pattern simulation can be flexible, fast and affordable.2,6,7 However, when learning from computationally generated fluorescein patterns,8,9 students do not have the opportunity to gain proficiency in handling of the CLs or applying fluorescein. With this scenario, as a mixed solution between clinical practice with real eyes10 and the observation of computed fluorescein patterns, it seems interesting to have a set of artificial Sclero-Corneal Surfaces (SCSs) on which students can train the process of fitting RGP-CLs. The use of SCSs models combines hands-on manipulation of RGP-CLs on artificial ocular surfaces with the benefits of computer-generated fluorescein patterns, such as the ability to simulate a diverse array of corneal geometries without patient participation.
To provide a wide set of artificial SCSs, a manufacturing technique capable of accurately reproducing the geometry of sclero-corneal surfaces is essential. Prior to the development of 3-D printing technologies, computer-controlled microlathing was the closest method to achieving similar spatial resolution. However, microlathing is not easily accessible to the public, nor is it particularly suited for producing highly asymmetric shapes, such as those found in patients with irregular corneas.11
As far as we know, Zhao et al.12 is the first and only attempt of using 3-D printing technology to fabricate solid models of corneal surface to simulate RGP fittings.12,13 However, the scope of the pioneering work of Zhao and colleagues was limited since a low accurate Fused Deposition Modelling 3-D printing technique was used and lack of analysis results.
The aim of this study is to evaluate the viability of a new method of contact lens fitting simulation using sclero-corneal surfaces manufactured with a 3-D resin printer. As a first step to validate the accuracy of this methodology, a comparative analysis was conducted between fluorescein patterns obtained with 3-D printed SCSs and different CLs and the corresponding theoretical patterns calculated under the same conditions.
Materials and methodsTo evaluate the agreement between fluorescein patterns performed on 3-D printed SCSs and those computer-generated, first, the SCSs were modeled using a custom-written Matlab Application (MATLAB version R2020b, MathWorks, Inc., Natick, MA, USA), 3D printed (Moai 130 from Peopoly, China, 2018) and characterized with a topographer (Eye Surface Profiler, Eaglet Eye, Netherlands).
Second, a set of Theoretical Fluorescein Patterns (TFPs) were calculated in MATLAB based on the surface topography of each SCS and the back surface geometry of a representative set of tricurve RGP-CLs.
Third, after fitting a sample of rigid CLs over all manufactured SCSs, a set of experimental fluorescein patterns (EFPs) were registered with a smartphone photographic camera (i-phone 14 pro (Apple, Cupertino, CA, USA)).
Finally, the agreement between the pictures corresponding with EFPs and TFPs was quantified by means of a digital questionnaire answered by optometrists experts in CLs. For the sake of clarity Fig. 1 illustrates a graphical flowchart of how the EFPs and TFPs were generated and analyzed. The following subsections provide further details of each step of the process.
 and Experimental fluorescein pattern (EFP). Each step is illustrated, along with the result.")
Each SCS consists of two coaxial surfaces: a peripheral scleral-type surface described by the equation of a sphere with 12 mm of radii of curvature, and a biconic corneal surface14 described by Eq. (1).

Eq. (1). Bi-conic equation employed to model the corneal 3-D printed surface.14
Where Cvx=1/Rx (Rx is the curvature radii of the x axis); Cvy=1/Ry (Ry is the curvature radii of the y axis); ccx is the conic constant in the x axis and ccy the conic constant in the y axis.
This equation was entered in a custom-built MATLAB Application (App) for the generation of the surfaces (see Fig. 2). The inputs of corneal radii (Rcx for x-axis and Rcy for y-axis), conic constant (ccx and ccy), corneal diameter (DTx and DTy), scleral radii (Rsx and Rsy), scleral diameter (DTsx and DTsy) and the total points for generating the surface (Nx) must be entered to generate the representation (Fig. 1. “3D button”). For creating the 3D model, the stereolithography file was generated with 2 mm of thickness (“Stlwrite” button).
. ccx, ccy: Corneal conic constants (mm). DTx, DTy: Total corneal diameters (mm). LTotalx, LTotaly: Total length of the base (mm). Rsx, Rsy=Scleral radii (mm). DTsx, DTsy=Total scleral diameters (mm). Nx=Number of points for representing and generating the surface.")
A section of the designed Matlab R2020b App for creating the SCSs. Rcx, Rcy: Corneal radii for x-axis and y-axis (mm). ccx, ccy: Corneal conic constants (mm). DTx, DTy: Total corneal diameters (mm). LTotalx, LTotaly: Total length of the base (mm). Rsx, Rsy=Scleral radii (mm). DTsx, DTsy=Total scleral diameters (mm). Nx=Number of points for representing and generating the surface.
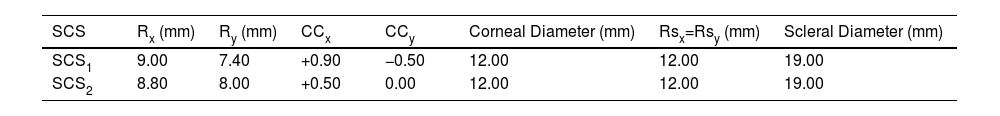
The parameters entered in the MATLAB App to define the surfaces (SCS1 and SCS2) are detailed in Table 1.
Nominal inputs for SCSs generation.
| SCS | Rx (mm) | Ry (mm) | CCx | CCy | Corneal Diameter (mm) | Rsx=Rsy (mm) | Scleral Diameter (mm) |
|---|---|---|---|---|---|---|---|
| SCS1 | 9.00 | 7.40 | +0.90 | −0.50 | 12.00 | 12.00 | 19.00 |
| SCS2 | 8.80 | 8.00 | +0.50 | 0.00 | 12.00 | 12.00 | 19.00 |
Rx: x-axis radii (at 0°), Ry: y-axis radii (at 90°), CCx: x-axis conic constant, Ccy: y-axis conic constant, Rsx and Rsy: scleral x-axis and y-axis radii.
The convex astigmatic geometries SCS1 and SCS2 were selected to exhibit approximately 2 and 4 diopters of corneal equivalent astigmatism, respectively, and to encompass a broad range of curvature and conic constant values. Both surfaces were used during the experiment in the nominal and x-y transposed position.
For 3-D printing, in contrast to Zhao’s work,12 stereolithography technology was chosen for the manufacture of SCSs given its high spatial resolution and surface printing quality.15,16
The 3-D printing of the SCSs included the following three-step procedure:
Step#1: Stereo-lithography file; a “Standard Template Library” (.stl) file contains the information of the SCSs which was generated with the MATLAB App specifically in the “Stlwrite” button (Fig. 2). Supports were added for each model to ensure proper support with the program Chitubox64_V1.9.0 (Chitu Systems Inc., China, 2023).
Step#2: Printing parametrization; the slicing of the generated SCSs models was carried out using the program Ultimaker Cura_V.4.13.0 (Ultimaker B.V., Netherlands, 2023) obtaining a final machine code file (.gcode) with layer height of 0.06 mm and a transversal diameter resolution of 0.02 mm. Finally, the file was then sent for 3-D printing.
Step#3: Printing process; the fabrication of the SCSs was carried out using the Peopoly Moai 130 3-D resin printer (Peopoly, China, 2018) which uses blue scanning laser technology (wavelength 405 nm) to induce cross-linking of the functional groups composing the resin.17–19 A UV curable acrylate-based resin developed by Peopoly specifically for SLA printers was used.20 A post washing and curing process was applied to remove the partially cured resin.21
Two different kinds of fluorescein patterns were used in this study. Theoretical Fluorescein Patterns and Experimental Fluorescein Patterns. Calculating the TFP required knowledge of the 3-D printed SCS shape and the nominal geometry of the CLs back surface (see Table 2). Obtaining the EFP required the application of fluorescein solution between the SCS and the CLs, along with blue light illumination and a digital camera equipped with a yellow filter. To increase the diversity of synthetic fluorescein patterns, both 3-D printed surfaces were also used with a 90° of rotation in both experimental and theoretical methods.
Nominal back surface geometry of the 3 spherical tricurve rigid CLs (Polycon II).
| CLs | R0 (mm) | R1 (mm) | R2 (mm) | DT0 (mm) | DT1 (mm) | DT2 (mm) | Geom. |
|---|---|---|---|---|---|---|---|
| CLA | 7.65 | 8.50 | 9.70 | 8.20 | 8.90 | 9.50 | Sph. |
| CLB | 8.10 | 9.10 | 10.70 | 8.20 | 8.90 | 9.50 | Sph. |
| CLc | 8.50 | 9.80 | 11.00 | 8.20 | 8.90 | 9.50 | Sph. |
R0, R1, R2 and DT0, DT1, DT2 – are respectively Curvature Radii and final diameter bound for the first (base), second, and third CL spherical curves (mm). Geom.: Geometry. Sph.: Spherical.
To generate both types of fluorescein patterns, the parameters of the CLs back surface used are detailed in Table 2. These lenses were made of Polycon II, a RGP material commonly used in CL manufacturing. All possible combinations between CLs and rotated and unrotated SCSs were used to generate a set of 12 fluorescein patterns of each method.
Theoretical fluorescein pattern calculationThe geometrical characterization of the 3-D printed SCSs were performed using the Eye Surface Profiler (ESP), a novel clinical topographer that employs Fourier-domain profilometry with a dual blue-light projection system and a yellow-filtered camera.22,23 To obtain topographical SCS information, the device uses the green-yellow fluorescence emitted by a thin fluorescein layer ideally aligned parallel to the measured surface.24
Following height data acquisition, a nonlinear regression was performed to characterize the central region of the 3-D printed height data. The geometric characterization involved fitting the measured data to a biconic model over a 9.5 mm aperture diameter, the same as the CLs used in this work. The nonlinear regression was carried out using MATLAB’s “lsqnonlin” function. Moreover, the root mean square error (RMSE) between the data and the model was calculated as a measure of the goodness of fit. To enable a more detailed surface analysis, the differences between the biconic model and each experimental corneal surface were expressed via normalized Zernike polynomials using the ANSI/ISO single-index scheme (Noll ordering) up to radial order 10.25 Then, the relative contributions of low (radial order≤2) and high-order (radial order>2) polynomials were quantified as percentages. Because only corneal CLs were employed in this work, no attempt was made to characterize the scleral surface.
TFPs were calculated using a custom-built MATLAB App (see Fig. 3), following the guidelines from Contact Lens Optics and Lens Design.14 In order to do that, the SCS parameters obtained from the corneal biconic fittings and the nominal back surface geometry of 3 tricurve spherical RGP CLs (Table 2) were used. Fig. 3 highlights the section of the developed App where the theoretical fluorescein pattern was computed using these parameter data. To increase the diversity of synthetic fluorescein patterns, the SCS1 and SCS2 biconic models were also used with 90° of rotation.
, corneal conic constants (ccx, ccy), corneal and scleral diameters (DTx, DTy, DTsx, DTsy), Nx indicates the number of surface points used for generation, CLs base curves and diameters (R1–R3x/y, DT1–DT3x/y) and CLs conic constants (ccx, ccy).")
Section of the MATLAB App used to compute theoretical fluorescein patterns. A linear green scale was applied, where 0 mm tear height corresponds to black. Corneal and scleral radii (Rcx, Rcy, Rsx, Rsy), corneal conic constants (ccx, ccy), corneal and scleral diameters (DTx, DTy, DTsx, DTsy), Nx indicates the number of surface points used for generation, CLs base curves and diameters (R1–R3x/y, DT1–DT3x/y) and CLs conic constants (ccx, ccy).
To generate the corresponding 12 experimental fluorescein patterns, the 3 Spherical CLs (Table 2) were fitted onto the SCSs in normal and 90 degrees rotated positions. To visualize the fluorescein pattern, a solution was prepared by adding 0.04 g of fluorescein sodium to every 10 mL of Systane Lubricant Eye Drops (Alcon Inc., Ginebra, Suiza; 2024). This mixture helped maintain a uniform tear film for a longer period of time. The CLs were properly centered on the corneal surface.
Fluorescein pattern images were captured using the main camera of an iPhone 14 Pro (Apple, Cupertino, CA, USA) equipped with a yellow filter (ROSCO, e-Colour± Filter #104 Deep Amber, ROSCO Laboratories, Inc., USA). Images were illuminated using a modified Burton lamp, originally a handheld magnifier (AURIOL, Model No Z29376, Milomex Ltd., UK), in which the original ring of white LEDs were replaced with 470 nm blue LEDs (TG Blue LED, Toyoda Gosei Co., Ltd., Japan). Experimental fluorograms were obtained using the mode where only four LEDs of the ring were illuminated.
Following image acquisition, contrast was uniformly adjusted using the “Contrast” function in the Photos app integrated in iOS (version 17.5.1). This adjustment operates non-linearly on image luminance, minimally affecting color perception. The app’s contrast scale ranges from −100 (maximum reduction) to ±100 (maximum enhancement), with 0 indicating no adjustment. A value of ±20 was applied to all images, selected by one of the authors (D. Gargallo) to achieve maximal visual similarity with the experimental fluorescein patterns as perceived during capture. Finally, all images were cropped to an 800 × 800 pixel square for analysis.
Fluorescein patterns questionnaireIn order to evaluate the feasibility and reliability of the EFP, those were compared against the TFP through a structured questionnaire-based assessment consisting of 6 questions (single answer multiple-choice test). A total of 22 optometrists with experience in CLs fitting participated in this study answering the questionnaire.
In the questionnaire, each question showed a main fluorescein pattern generated using either experimental or theoretical method. Additionally, four alternative fluorescein patterns were shown, generated using the other method. The optometrists had to identify which of the four patterns corresponded to the same CL and SCS parameters as the main fluorescein pattern. (Further information can be found in Appendix A).
All participants completed the questionnaire using the same laptop model (ASUS ROG Strix G513ICHN004W), same display settings 1920×1080 resolution, IPS panel, 144 Hz refresh rate and 100 % sRGB color coverage and the same surrounding lighting conditions (736 lx).
Data analysisData analysis involved evaluating the percentage of optometrists’ answers (pp) for each question. To assess the uncertainty associated with each proportion, a 95 % confidence interval (CI) was calculated using Eq. (2), with a sample size of N = 22.

Eq. (2). Calculation of the CI proposed by Agresti and Caffo.26
In order to assess the statistical significance of the most prevalent response, the CIs for the most prevalent response option were compared with those of the second most prevalent respectively for each question. If the CIs of these options overlapped, this suggested that the optometrists may have had difficulty distinguishing between them, potentially leading to a random choice. In contrast, non-overlapping CIs indicated that the most prevalent answer was more likely selected intentionally, rather than by chance. Nevertheless, the proportion of optometrists selecting the correct answer for each question was quantified as well. All the calculations and the graphics were carried out using Microsoft Excel.
To enhance the analysis, the similarity between each response and its corresponding reference fluorescein image was quantified using the Structural Similarity Index (SSIM). SSIM is a widely used metric that assesses image similarity through a perceptual comparison of quality. It evaluates three key aspects of image appearance: luminance, contrast, and structural information.27 The SSIM index ranges from 0 to 1, where 1 indicates perfect structural similarity, and lower values reflect increasing dissimilarity. In practice, values near 0 indicate very low similarity, while values closer to 1 represent highly similar images in terms of the three evaluated components.
ResultsGeometrical characterization of the corneal printed surfacesTable 3 summarizes the main parameters obtained from fitting a biconic model to the central region (9.50 mm diameter) of the 3-D printed corneal surfaces. The root mean square difference (RMS_Dif) between the fitted biconic model and the corneal height data obtained from topography was approximately 10.50 µm for both printed surfaces.
Fitting results for a biconic model for the central region of the 3-D printed elements.
| N° SCS | Rx (mm) | Ry (mm) | CCx | CCy | RMS_Dif (µm) | ZLO_Dif ( %) | ZHO_Dif ( %) |
|---|---|---|---|---|---|---|---|
| SCS1 | 9.06 | 7.66 | +1.16 | −0.27 | 10.77 | 4.12 | 95.88 |
| SCS2 | 8.92 | 8.23 | +0.66 | +0.12 | 10.28 | 16.25 | 83.75 |
N° SCS: Number of each SCS, Rx: x-axis corneal radii, Ry: y-axis corneal radii, CCx: x-axis conic constant (Q-value), CCy: y-axis conic constant (Q-value). RMS_Dif: The spatial average of the root mean square differences between the fitted values and the measured surface. ZLO_Dif and ZHO_Dif represent the percentage of the difference between the actual and fitted surfaces corresponding to low and high-order Zernike polynomials, respectively.
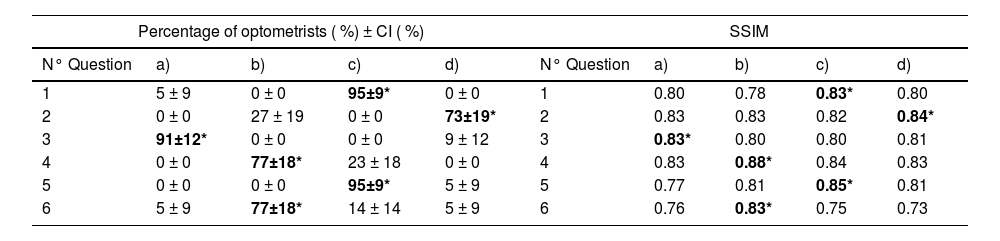
The results of the percentage of optometrists who chose each answer option in each question and its CI are shown in Table 4A), the results corresponding to correct answers are written in bold numbers and marked with an asterisk (*). As shown in Table 4A), for all questions, the correct answer was also the most prevalent in relation to the second more frequently selected option. Considering CI overlapping, this higher prevalence of the correct answers was not due to chance p < 0.05.
A) Left side: Percentage of optometrists who chose each option in each question and each confidence interval calculated with p-value=0.05. B) Right side: Structural Similarity Index calculated between each reference fluorescein pattern and each question option.
Nª: Number of question.
Bold numbers*: correct answer to each question.
The SSIM of each possible answer was calculated relative to the reference image used for comparison. The SSIM values for the correct answers ranged from 0.83 to 0.88, with a mean of 0.83 and a standard deviation of 0.02. In contrast, the incorrect answers showed SSIM values ranging from 0.73 to 0.84, with a mean of 0.77 and a standard deviation of 0.08. Correct responses consistently exhibited higher SSIM values than incorrect ones. The overall SSIM results are presented in Table 4B).
The percentages of optometrists who selected the correct and the second most frequently selected answer for each question are represented in Fig. 4. The results for the correct answer correspond to the bold numbers of Table 4A) and the black bars of the figure. The mean percentage of correct answers across all questions was 84.67 % with a standard deviation of 10.07 % and a range interval from 77 to 95 %. For questions number 1, 3, 5 more of the 90 % of the optometrists chose the correct answer.
Discussion and the second more frequently selected answer (white bar). Correct results correspond to the bold numbers shown in Table 4A). Confidence intervals were calculated following Agresti and Caffo.26.")
The capabilities of 3-D printing for high-precision optical components have been previously demonstrated. Vaidya and Solgaard21 explored the fabrication of 3-D printed optics with nanometer-scale surface roughness, showcasing the potential of Stereolithography (same printer model used in our study) to achieve accurate surface geometries. Our findings align with their results, as the SLA-printed models in this study exhibited good surface quality and dimensions comparable to natural corneal topography. In the field of optics and optometry, 3-D printing has also been applied to the design of CLs. Alam et al.15 employed computer-aided design tools to model commercial lens geometries, using 3-D printing techniques followed by post-processing to decrease surface roughness.
The surfaces fabricated via 3-D printing in our study were specifically designed for the experimental simulation of fluorescein patterns. Consequently, it was unnecessary to apply post-processing techniques typically used in optical applications to achieve nanometric surface roughness. The quality of the obtained fluorescein patterns images (see Appendix A) indicates that the surface roughness achieved with our resin printer is sufficient for accurate visualization of fluorescein patterns. Furthermore, without implementing specific geometric calibration, the fabricated corneal surfaces closely resembled the intended biconic model. In particular, the observed differences between the nominal biconic models (see Table 1) and the biconic parameters obtained for the 3-D printed surfaces (see Table 3) were relatively small for the vertex radius of the flattest meridians (9.06 mm vs. 9.00 mm for SCS1, and 8.92 mm vs. 8.80 mm for SCS2), and more pronounced for the steepest meridians (7.66 mm vs. 7.40 mm for SCS1, and 8.23 mm vs. 8.00 mm for SCS2). Moreover, a clear systematic trend towards reduced curvature was observed, with the vertical meridian exhibiting the most significant deviation from the nominal values.
Regarding the difference between the nominal conic constant values and those measured on the 3-D printed corneal surfaces, a general trend toward more oblate shapes was found, with a maximum difference of +0.36 for the horizontal meridian of SCS1 and a minimum of +0.12 for the vertical meridian of SCS2.
To further quantify the differences between the ideal biconic model and the actual surfaces, the low-order (ZLO_Dif) and high-order (ZHO_Dif) components were calculated from the residual maps using Zernike decomposition. The results showed a reduced contribution of ZLO_Dif (ranging from 4.12 % to 16.25 %) to the overall surface deviation. The higher contribution of ZHO_Dif (ranging from 83.75 % to 95.88 %). Low-order aberrations, ZLO\_Dif, typically correspond to second-order surface forms such as defocus and astigmatism, although these low-order deviations could theoretically produce noticeable differences in the fluorescein images, their small absolute magnitudes, 0.44 µm and 1.67 µm, suggest a minimal impact on image similarity with the computationally simulated reference, in contrast, high-order aberrations, ZHO\_Dif, likely reflecting irregular imperfections introduced during the 3D printing and curing process, exhibited larger absolute values ranging from 8.61 µm to 10.33 µm, nevertheless, given the high degree of agreement between the simulated fluorescein patterns and the experimental patterns obtained in this study, it can be concluded that both low and high-order contributions exerted a negligible influence on the visual resemblance of the acquired images.
The average discrepancies of approximately 10.50 µm found for a conicoid with a 9.50 mm diameter suggest the viability of this technology for effectively producing biconic surfaces. Furthermore, considering the apparent small and systematic trend of the differences, and the findings reported by Vaidya and Solgaard,21 it is reasonable to expect that applying an appropriate calibration method would result in fabricated surfaces more closely aligned with the intended specifications.
More closely aligned with the objectives of this study, Zhao et al.12,13 printed 3-D corneal models with varying diameters and heights using Fused Deposition Modeling (FDM) and analyzed the resulting fluorescein patterns when fitting some CL. However, the lack of topographical measurements and the rougher surface finish of FDM may have compromised the accuracy of their results. In contrast, our study employed resin-based SLA printing, achieving a smoother surface and a more precise geometry that closely resembles the natural cornea. This improved surface quality contributed to fluorescein patterns that better aligned with theoretical expectations. Furthermore, by incorporating topographical measurements, our analysis provided a more rigorous validation of the printed models.
Zhao et al. highlighted the utility of 3-D printed corneal models for visualizing lens positioning, corneal eccentricity and the existence of bubbles under the CL.13 However, they did not assess the fidelity of the resulting fluorescein patterns in relation to theoretical simulations. In contrast, our study showed that when optometrists compared experimental fluorescein patterns with theoretical ones in the questionnaire, their consistency in correct responses suggests that the experimental patterns generated with 3D-printed SCSs closely matched the theoretical patterns. The fact that the correct option was always the most selected reinforces the similarity between both methods and supports the feasibility of using 3-D printed SCSs as a novel method for evaluating RGP CL fittings. This reinforces the potential of our approach as a complementary tool in RGP fittings, offering a tangible representation that enhances pattern assessment with the use of 3-D printing technology to simulate real corneal surfaces.
Regarding the questionnaire developed in this study to assess similarity between fluorescein patterns, the SSIM values obtained showed consistency with the expected perceptual similarity of each image presented. SSIM was employed to compare the acquired fluorescein images with computationally simulated references because it captures not only luminance and contrast but also the spatial structure of the patterns. This is particularly relevant for fluorescein assessment, where the visual arrangement of the bands, rather than absolute intensity, determines the perceived similarity. By reflecting these structural features, SSIM provides an objective metric suitable for quantifying pattern resemblance in a consistent and reproducible manner. However, it is important to note that, to date, no validated metric exists for evaluating the similarity of fluorescein patterns across different media, which places such analysis beyond the scope of this study.
Nevertheless, assuming that the SSIM provides a reasonable approximation of perceptual similarity in the context of this task, the results indicate that correct responses consistently corresponded to higher SSIM values compared to incorrect ones. However, the relatively small difference in mean SSIM values between correct and incorrect answers (0.83 vs. 0.77), along with the higher variability observed among incorrect responses, suggests that further refinement of the stimuli could improve discrimination and reduce potential ambiguity.
This study also represents an initial and controlled step toward validating the correlation between fluorescein patterns observed on 3-D printed SCS and those seen in real eyes. However, the clinical use of SCSs with patient-specific geometry to fit various CLs should be explored in future studies to evaluate its effectiveness in real-world clinical settings.
Additionally, future studies should explore the applicability of this method for other types of CLs, such as scleral lenses, soft or hybrid lenses and expand its potential uses in fitting a broader range of lens designs. Future work will also involve measuring the potential impact of the methodology in RGP CL fitting education, especially to enhance learning experiences and training outcomes.
Strengths and limitationsWhile our findings point out the potential of 3-D printed SCSs as a valuable tool for simulating RGP CL fitting, certain aspects require further investigation to fully establish the scope and applicability of this approach. A critical assessment of the strengths and limitations of our methodology is essential to guide future research and improvements.
One of the strengths of this study is the novelty of the proposed method to simulate rigid CL fittings. Unlike previous studies, our approach includes the characterization of the 3-D printed SCS using an optical topographer, ensuring a more significant evaluation. Additionally, the surface quality of the printed models was sufficient to generate fluor patterns without requiring additional mechanical processing, allowing for a better comparison with the theoretical fluorescein patterns. Another strength of this work is the statistical significance analysis performed, which reinforces the reliability of our findings.
However, due to its pioneering nature, this study has some limitations as well. The most significant is the limited range of corneal surfaces and contact lenses analyzed. A more comprehensive study is needed to determine the limitations of this new approach. Additionally, the analysis method based on digital pictures can be also considered a limitation because more information can be obtained with a real time observation of fluorescein patterns over SCS. In this work, due to the difficulty in standardizing participant interaction with the experimental setup, it was considered that a comparison between digital images provides clearer information about the influence of the proposed method on the appearance of the fluorescein pattern.
Furthermore, the lack of uniformity in the difficulty level of some questions represents a limitation that should be addressed in future studies. Ensuring a more consistent level of difficulty across items is expected to enhance the robustness and comparability of the results.
ConclusionsIn conclusion, our study demonstrates that fitting RGP CL on 3-D printed SCSs could simulate fluorescein patterns closely resembling those obtained through software simulations in RGP CL fittings. Because the fitting of contact lenses on 3D-printed ocular models enables testing under controlled and safe conditions, this approach bridges the gap between theoretical simulations and practical fitting techniques, offering potential applications in both research and clinical practice. Incorporating this method into RGP CL fitting education as a supplementary tool to existing methods could represent a significant advancement, one that future studies may explore further.
FundingThis research was supported by Ministerio de Ciencia, Innovación y Universidades (Grant PID2020–114311RA-I00); Gobierno de Aragón (Grant E44- 20R).
None.


