

To validate a modified ETDRS visual acuity (VA) chart developed for European-wide use, in populations that use the Cyrillic, Latin or Greek alphabet.
MethodsThe charts were validated in three groups: 310 school children in Bulgaria (mean age 13±1 years), 227 school children in Greece (mean age 14±1 years) and 85 patients with no ocular pathology in Belgium (mean age 26±5 years). VA was assessed with the habitual refractive correction, using the standard ETDRS charts and the modified European-wide charts. The intra-class correlation coefficient (ICC) was used to assess the test–retest reliability of the European-wide chart. The Bland–Altman comparison method was used to assess agreement between the two different versions of the new chart, as well as to compare these to the standard ETDRS-charts. Limits of agreement were calculated for differences in VA scores (test–retest variability (TRV)) between measurement sessions for the European-wide charts.
ResultsThe TRV of the European-wide charts was found to be ±0.10 logMAR, corresponding to 5 ETDRS letters, for both chart 1 and chart 2. The ICC was estimated to be 0.968 for the RE and 0.961 for the LE. The European-wide charts generated on average slightly higher logMAR scores compared to the standard ETDRS charts in all three groups.
ConclusionsThe “European-wide” charts appear to be a valid alternative to the standard ETDRS acuity charts, offering the advantage of containing letters readable by all European citizens.
Validar un test ETDRS de agudeza visual modificado, desarrollado para su uso en Europa, en poblaciones que utilizan el alfabeto cirílico, latino o griego.
MétodosLos tests fueron validados en tres grupos: 310 escolares en Bulgaria (edad media 13±1 años), 227 escolares en Grecia (edad media 14±1 años) y 85 pacientes sin patología ocular en Bélgica (edad media 26±5 años). Se evaluó la agudeza visual con la corrección refractiva habitual, utilizando los tests ETDRS estándar y los tests para uso europeo modificados. Se utilizó el coeficiente de correlación intraclase (ICC) para evaluar la fiabilidad intraobservador del test para uso europeo. Se utilizó el método de comparación Bland–Altman para evaluar la concordancia entre las dos versiones diferentes del nuevo test, así como para comparar éstas con los tests ETDRS estándar. Se calcularon los límites de concordancia para las diferencias en las puntuaciones de la agudeza visual (variabilidad test–retest) entre las sesiones de medición para los tests de uso europeo.
ResultadosSe comprobó que la variabilidad test–retest de los tests de uso europeo era de ±0,10 logMAR, correspondiente a 5 letras ETDRS, tanto para las láminas 1 y 2. Se estimó que el ICC era de 0,968 para el ojo derecho, y 0,961 para el izquierdo. Los tests de uso europeo generaron, de media, unas puntuaciones logMAR ligeramente superiores a las de los tests ETDRS estándar en los tres grupos.
ConclusionesLos tests “de uso europeo” parecen ser una alternativa válida a los tests de agudeza visual ETDRS, con la ventaja de que ofrecen letras legibles por todos los ciudadanos europeos.
VA is by far the most commonly used vision test. Since it measures foveal function, it is the preferred test for the assessment of the quality of the optical image and is the standard procedure used to quantify the severity of most ocular disorders and the efficacy of their therapeutic interventions. Snellen's original chart,1 introduced in 1862, met worldwide acceptance for more than a century, despite the well-documented limitations from the early years owing to the inconsistent progression in letter size between successive lines,2–5 and its poor reliability.6–8 In 1976, Bailey and Lovie9 incorporated the advantages of Green's4 logarithmic (geometric) progression in their chart and developed a rigorous chart design and test protocol, which has now become an international standard, largely because it was implemented by the US National Eye Institute (NEI) in the Early Treatment Diabetic Retinopathy Study (ETDRS).10 Although the ETDRS charts included Louise Sloan's letter which offered comparable legibility,11 a revised set of ETDRS charts was more recently proposed,12 aiming to minimize the differences in relative difficulty between lines on the charts. Today, ETDRS acuity is considered the gold standard in research, education and clinical settings.3
A limitation of the original ETDRS charts is that they do not allow for European-wide implementation, since they contain letters from the Latin (Roman) alphabet, which are not readable by all European citizens. To facilitate reliable VA screening for clinical trials and exchange of patient data between clinics and researchers throughout Europe other symbols, such as the Landolt C and the tumbling E, have been in common usage. However, measuring VA with such optotypes results in lower VA scores compared to a letter chart in both normal and visually impaired patients,13–16 since different visual processes are implemented (i.e. gap detection) in comparison to the discrimination character of letter acuity.
More recently a modified ETDRS chart with selected Sloan letters has been developed, as a common tool for countries using the Latin, Greek and Cyrillic alphabets.17 The modified charts have been validated against the original ETDRS in a Greek population.17 In this study the charts are also validated in populations using the Cyrillic and the Latin alphabets.
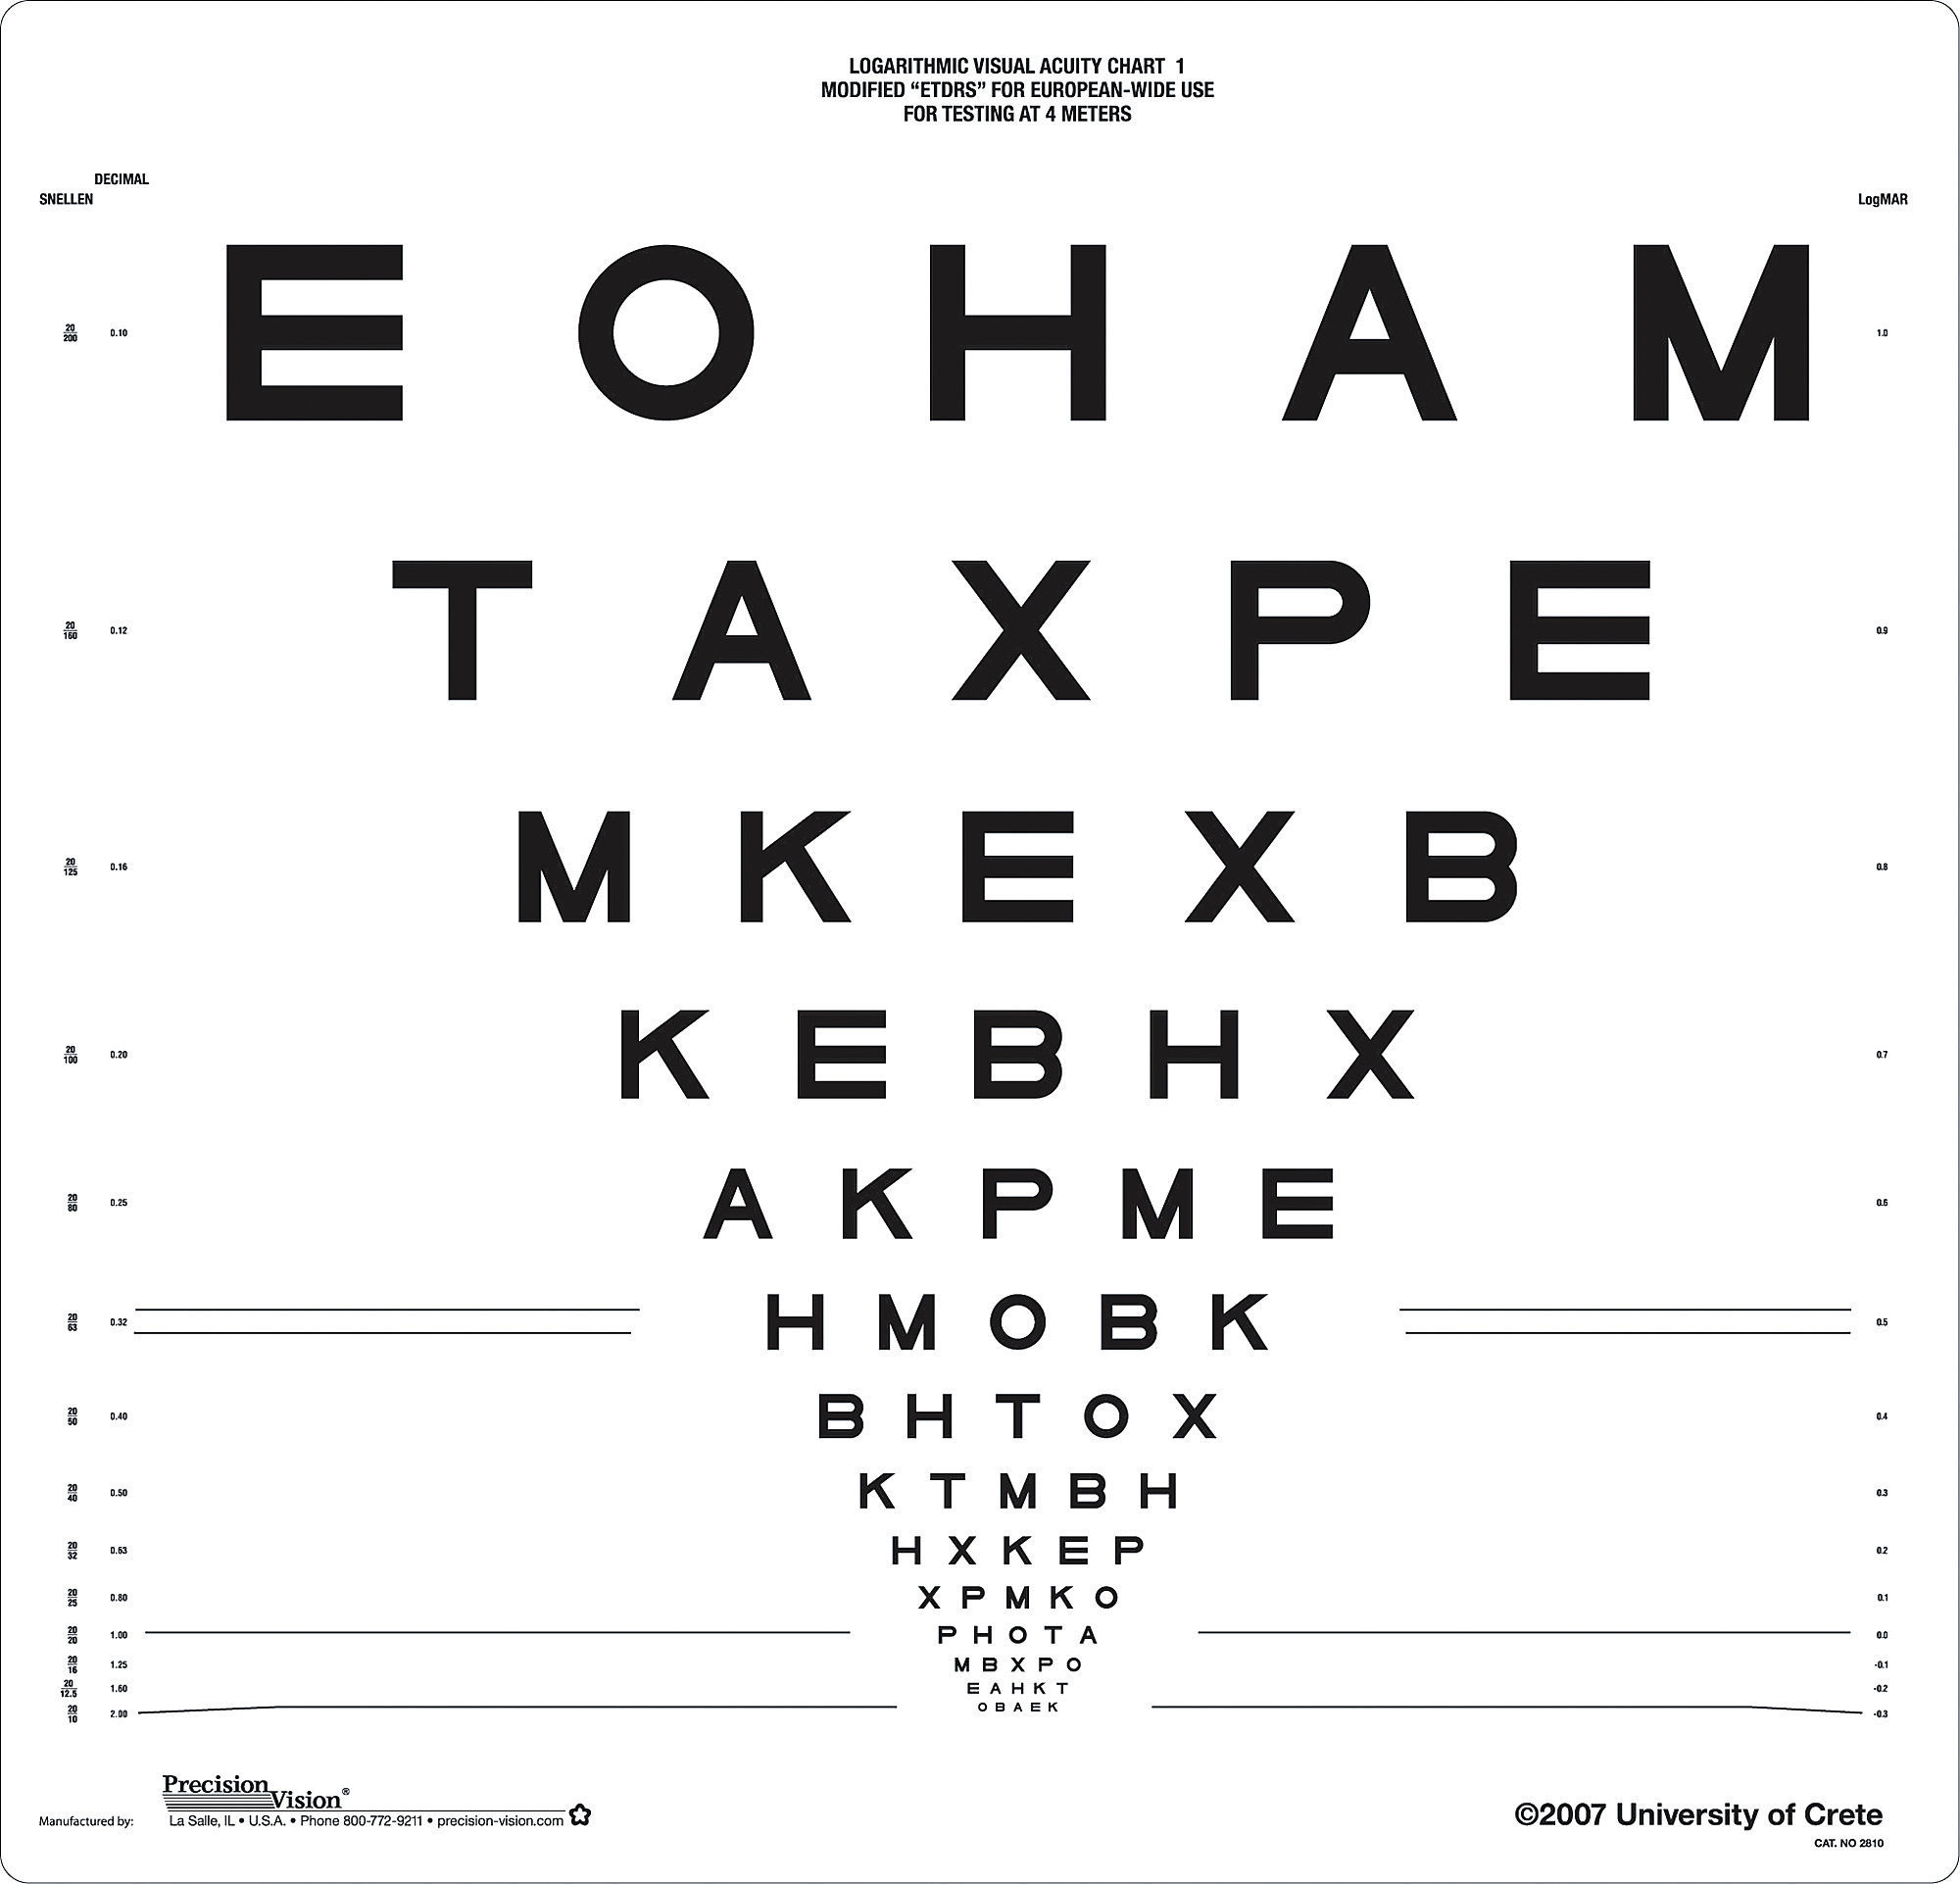
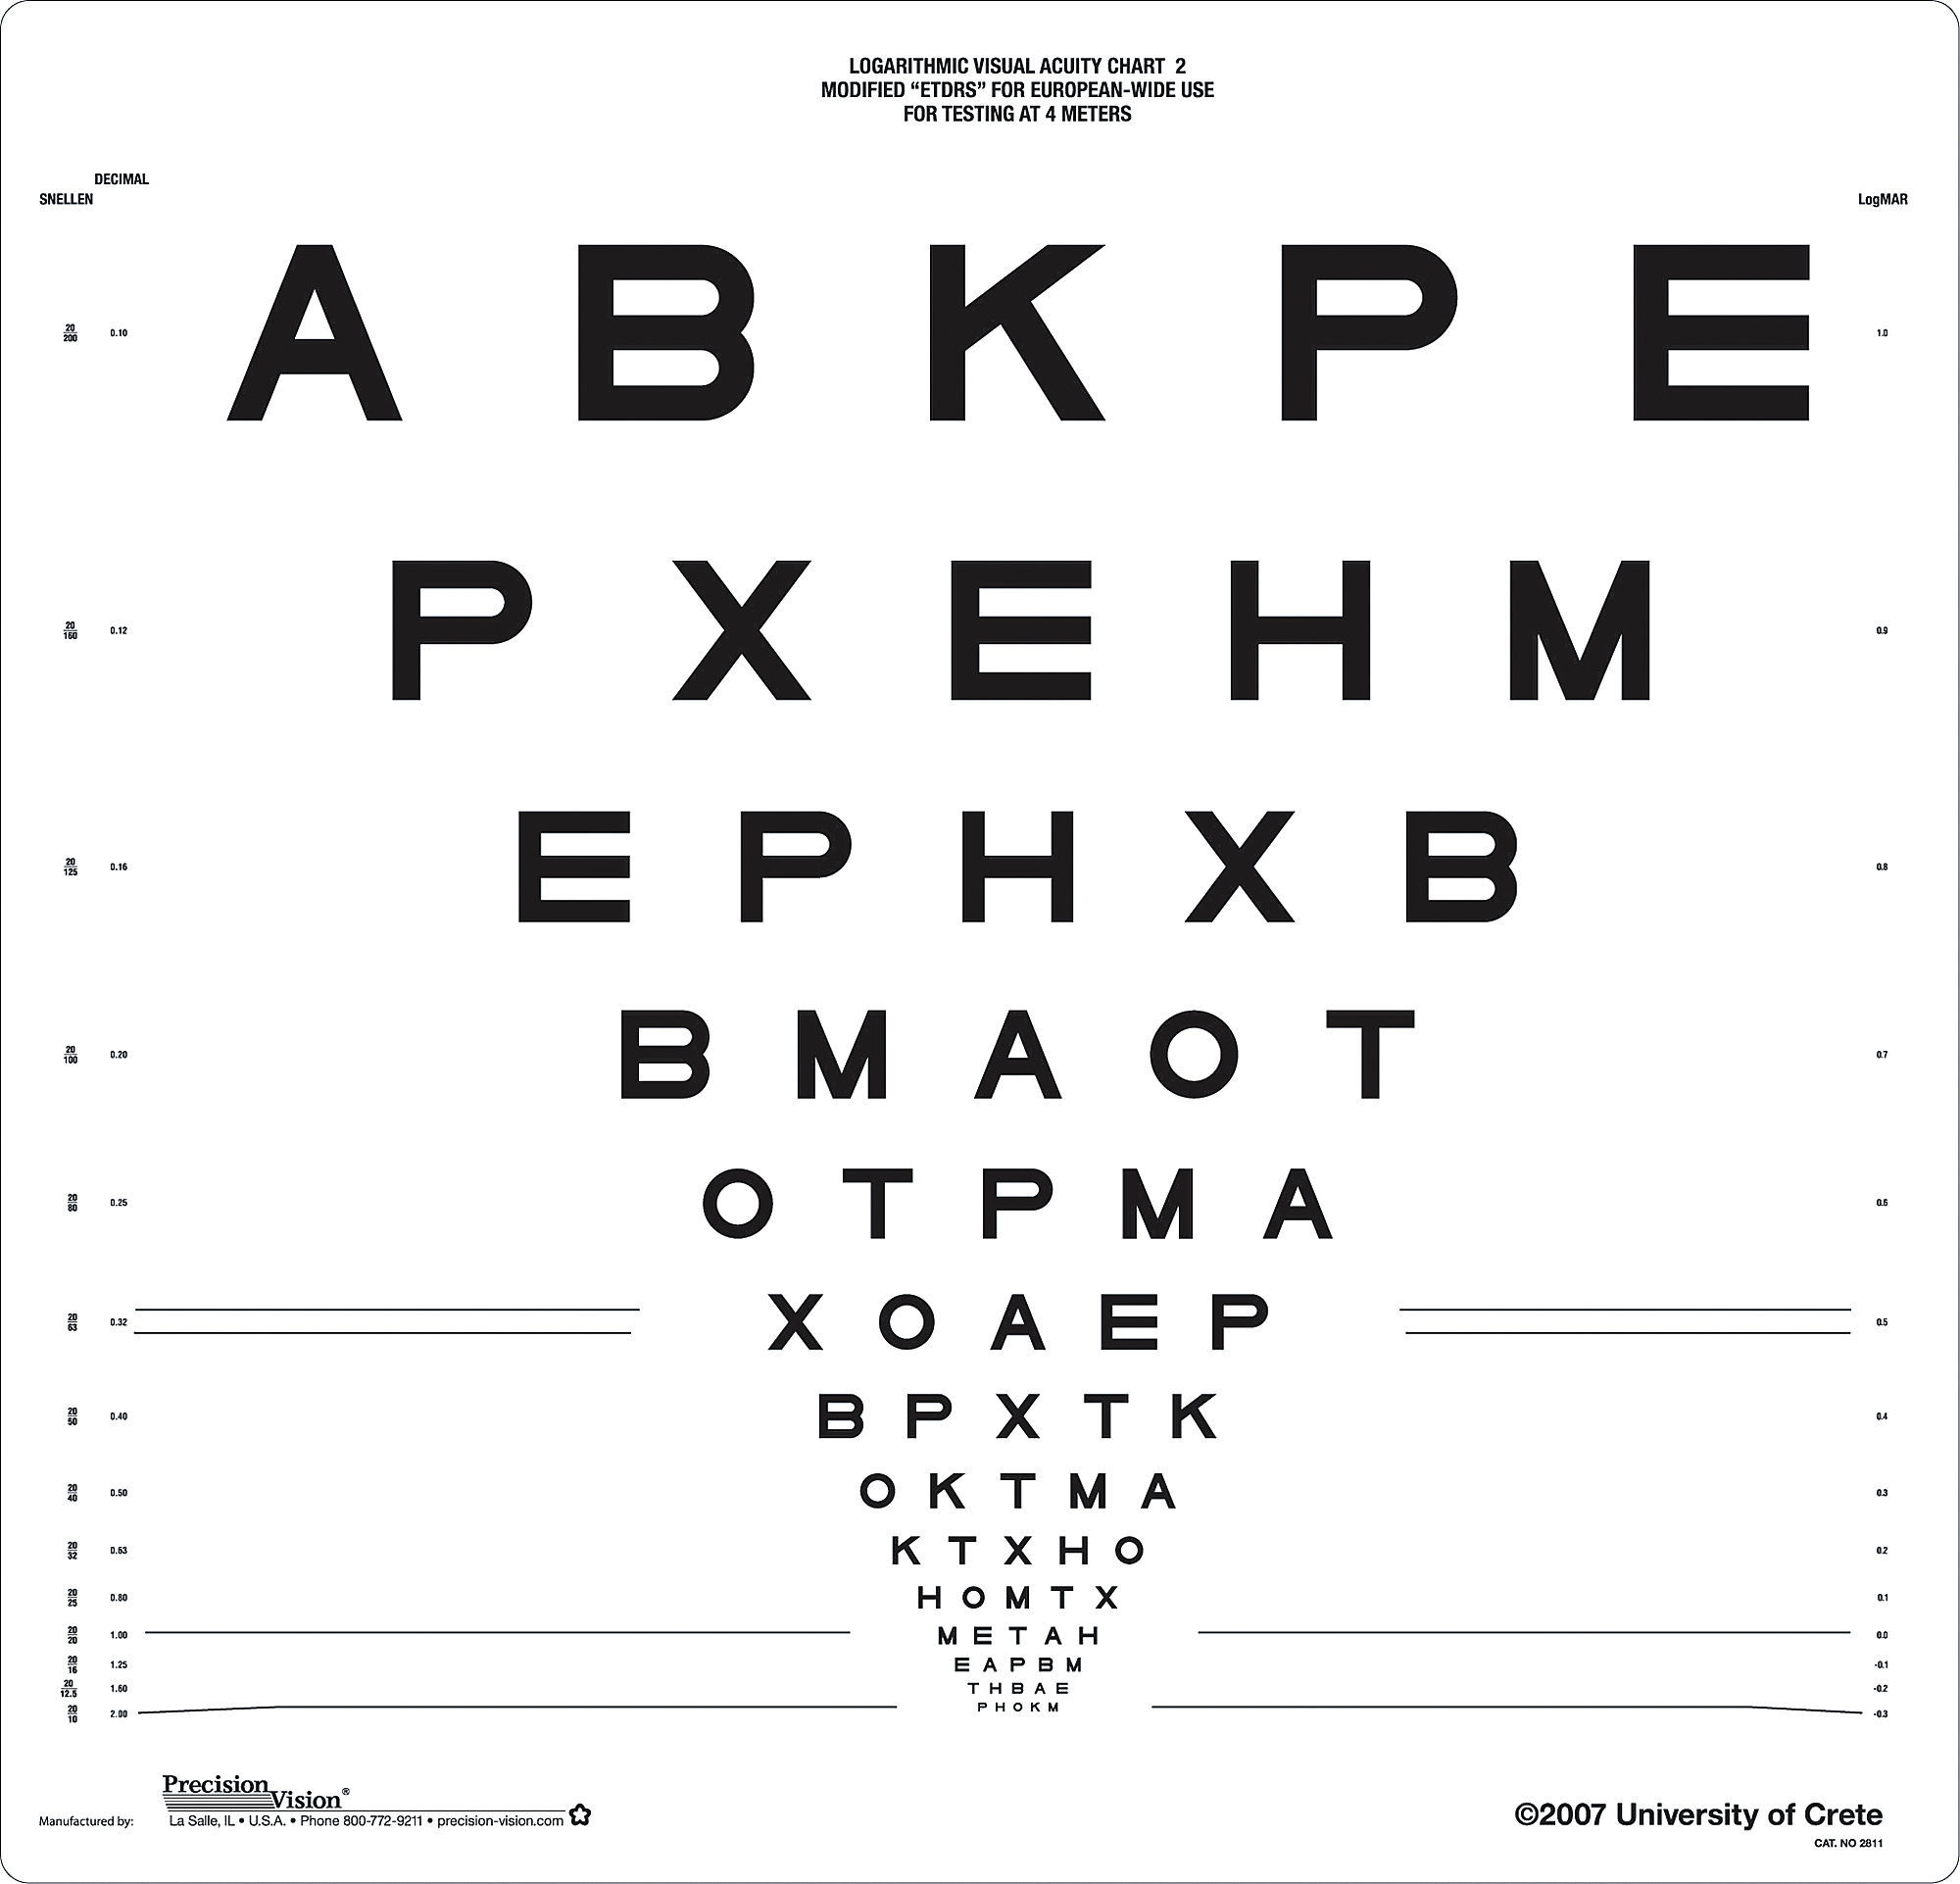
MethodsThe chartsThe ETDRS modified “European-wide” charts (Precision Vision, La Salle, USA) contain a set of Roman letters that are common to all three European alphabets (Latin, Greek and Cyrillic) and are consequently readable by European citizens. The Roman letters C, D, N, R, S, V and Z (contained in the standard ETDRS chart) are substituted with E, P, X, B, T, M and A, respectively. The new letters were constructed on Snellen's 5×5 grid and are compatible with the specifications of the Sloan letters.11Fig. 1 depicts the two versions of the modified charts used for recording VA in the right (chart 1) and left (chart 2) eye.
Patients

The charts were validated in three cohorts consisting of English-speaking (as a second language) participants: (i) a group of 310 school children (620 eyes), with a mean age of 13 (SD±1) years, in Stara Zagora, Bulgaria, (ii) a group of 85 patients (170 eyes) with a mean age of 26 (SD±5) years at the Department of Ophthalmology, Antwerp University Hospital in Belgium and (iii) a group of 227 secondary school children (454 eyes) with a mean age of 14 (SD±1) years in Heraklion, Greece. Validation included two different comparisons: (a) test–retest variability of the European-wide charts (in Bulgarian adolescents), (b) comparison between the European-wide and the standard ETDRS charts (in all cohorts). All subjects were naïve regarding VA measurements and underwent a complete ophthalmic examination in order to rule out any ocular disease. The research conformed to the tenets of the Declaration of Helsinki. Written informed consent was obtained from all patients (Belgium) and parents of the children participating in Bulgaria and Greece as well as the regional department of secondary education in the two countries.
Visual acuity measurementsMonocular distance VA for each eye was assessed with the habitual refractive correction (if any), using the standard ETDRS charts and the modified “European-wide” charts. In the first group (BG) of 310 subjects, VA with the “European-wide” chart was measured twice per eye in order to estimate its TRV. A back-illuminated slim stand (Sussex Vision Ltd., UK) held the acuity charts at 4m distance. The luminance at the center and the four corners of the chart ranged from 168 to 176cd/m2 for the standard charts and 164–167cd/m2 for the UoC charts. This was in compliance with the recommendations for standardizing the measurement of VA (approximately 160cd/m2).18 The order of presentation of the two versions of the standard ETDRS and the modified charts was counterbalanced in order to limit any learning effects. Charts 1 and 2 in both standard and modified versions were used to assess the VA in right and left eye, correspondingly. All subjects were asked to identify each letter starting from the upper left corner, and to proceed by row until they reached a row in which they could not correctly identify more than one letter. They were instructed to read slowly and guess the letters when they were unsure. The termination rule for stopping was four or five mistakes on a line. The experimenter scored correct responses on specially designed data forms. VA was derived in logMAR units from the calculation of correctly identified letters up to the last readable line.
Statistical analysisThe ICC was used to assess the test–retest reliability of the modified ETDRS chart in the Bulgarian adolescents.19 The Bland–Altman comparison method was used to assess agreement between the two different versions of the “European-wide” chart, as well as to compare these to the standard ETDRS-charts. Limits of agreement were calculated for differences in VA scores (TRV) between measurement sessions for the European-wide chart.20 Average differences were compared using paired samples t-tests. The assumption of normality of the differences was evaluated by inspection of quantile–quantile normal plots. The statistical package SPSS 15.0 (SPSS Inc., Chicago, IL, USA) was used throughout.
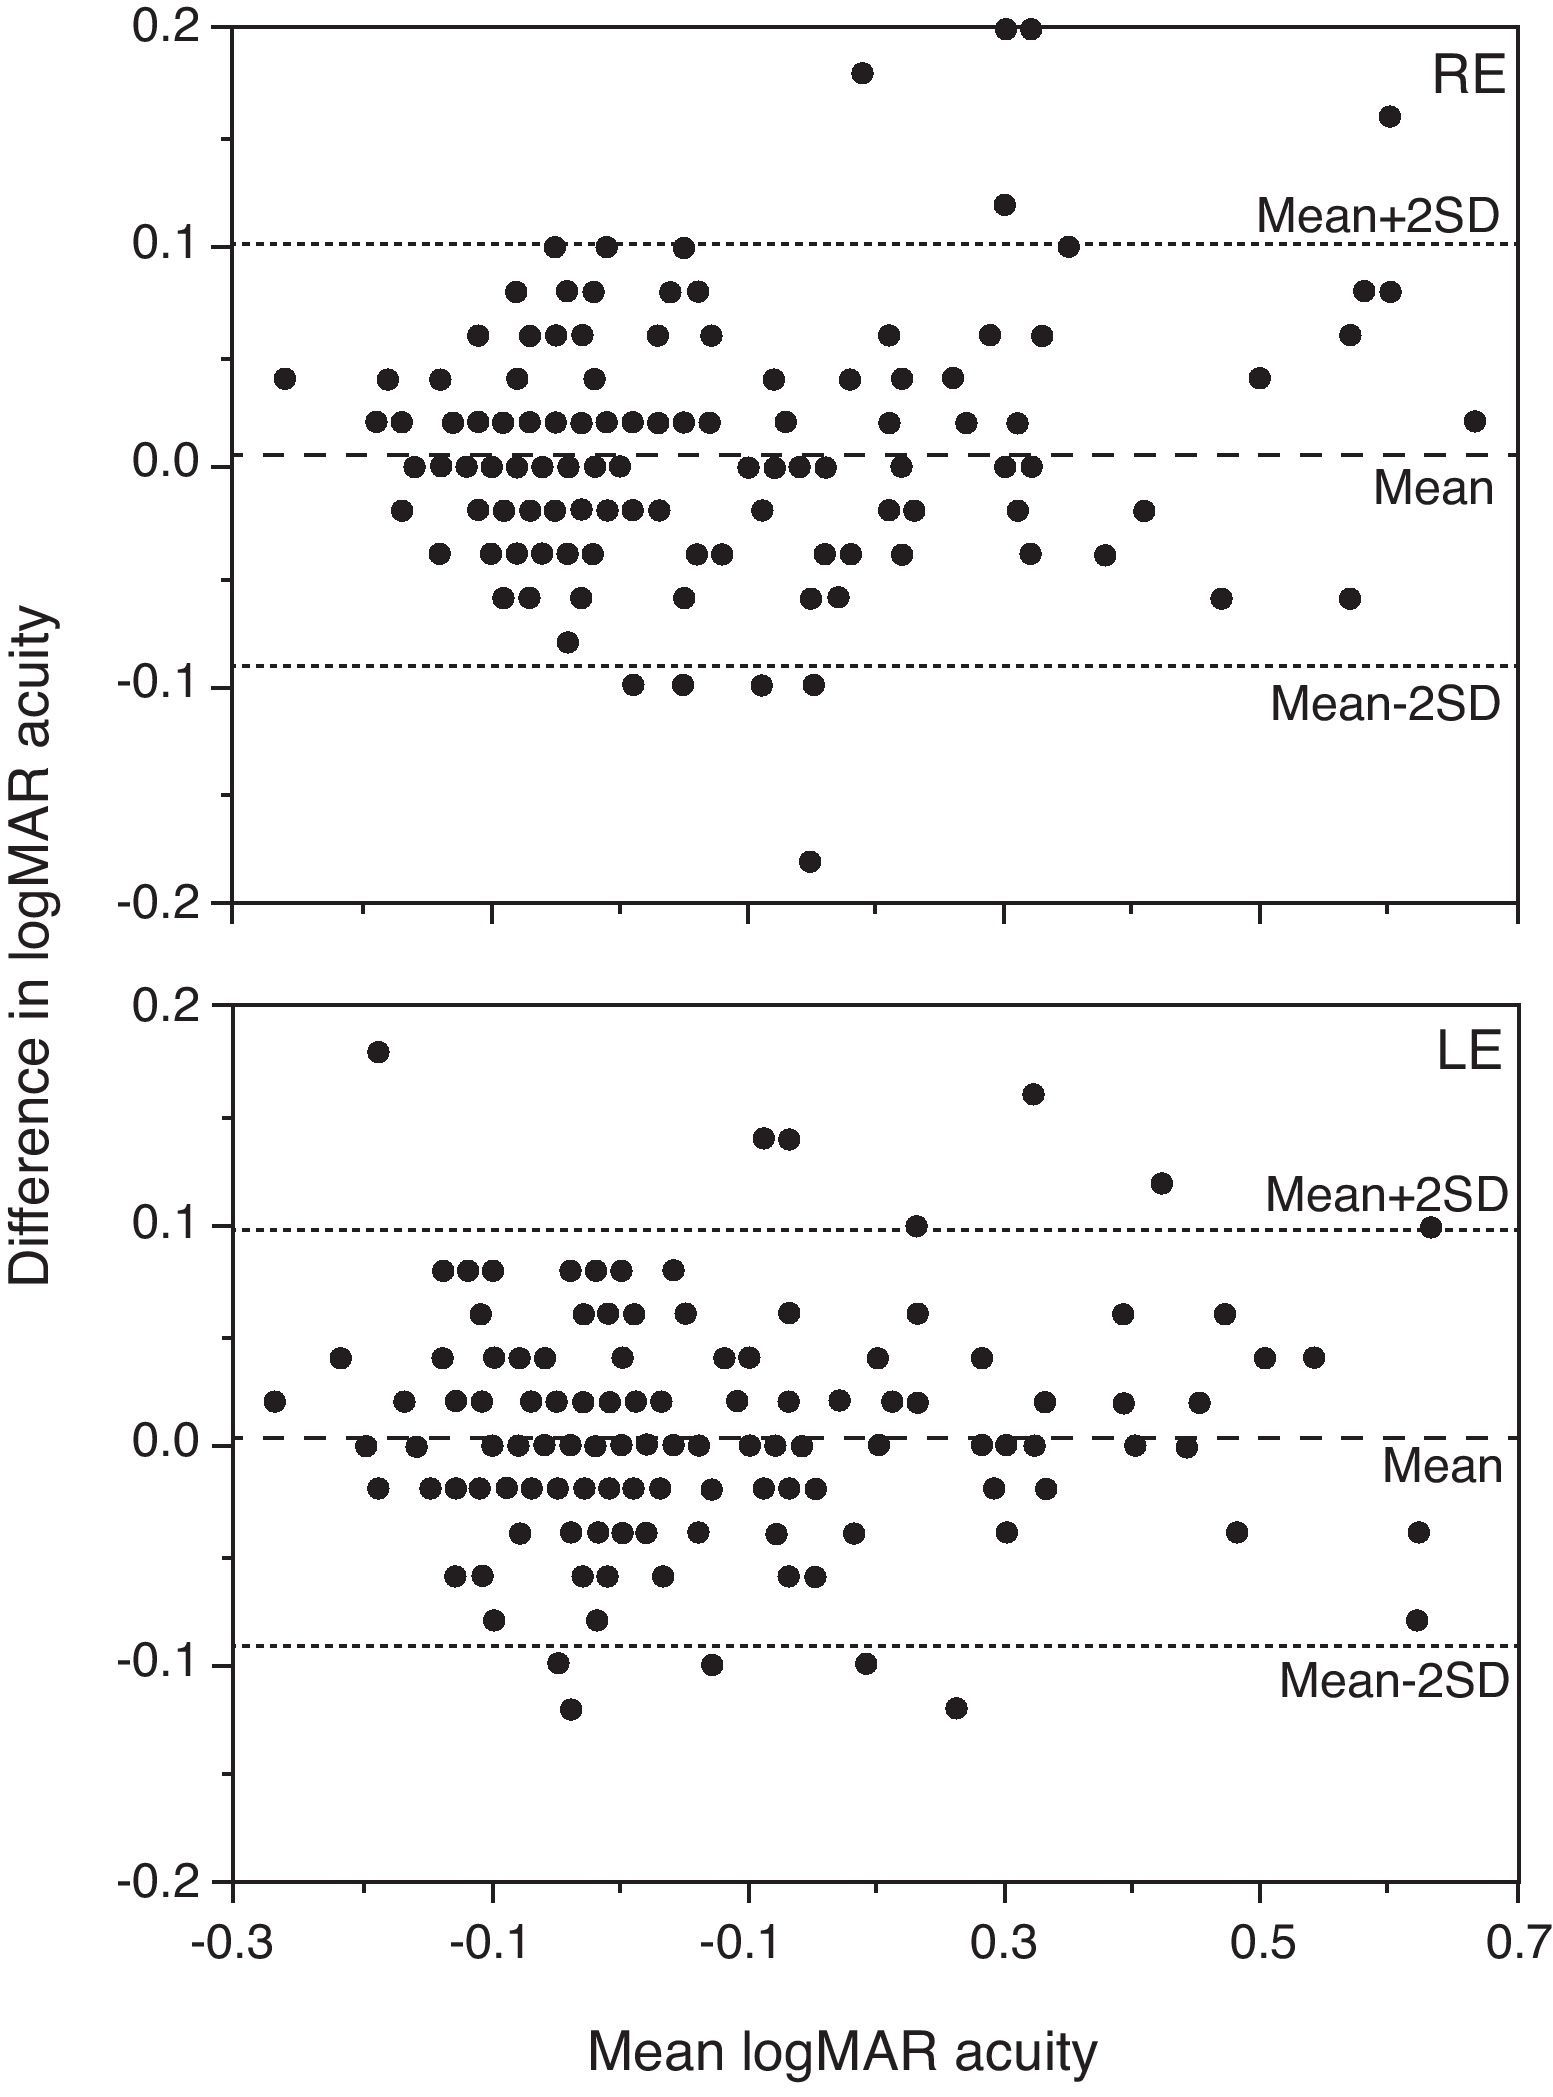
ResultsTest–retest variability of the European-wide chartsThe ICC was estimated to be 0.968 (95% CI from 0.958 to 0.975) for chart 1 and 0.961 (95% CI from 0.950 to 0.970) for chart 2. To illustrate the extent of agreement between the two sets of charts, the Bland–Altman method was used (Fig. 2). The TRV of the “European-wide” charts, estimated in Bulgarian children was found to be ±0.10 (corresponding to 5 ETDRS letters) for both chart 1 and chart 2.
 for chart 1 (upper graph) and chart 2 (lower graph) in the Bulgarian group. The dashed line represents the mean difference, whereas the dotted lines the mean±1.96 SD. Note that 0.02 logMAR corresponds to one ETDRS letter.")
Plot of the difference in logMAR acuity between the measurements with the European-wide charts against their average (Bland–Altman analysis) for chart 1 (upper graph) and chart 2 (lower graph) in the Bulgarian group. The dashed line represents the mean difference, whereas the dotted lines the mean±1.96 SD. Note that 0.02 logMAR corresponds to one ETDRS letter.
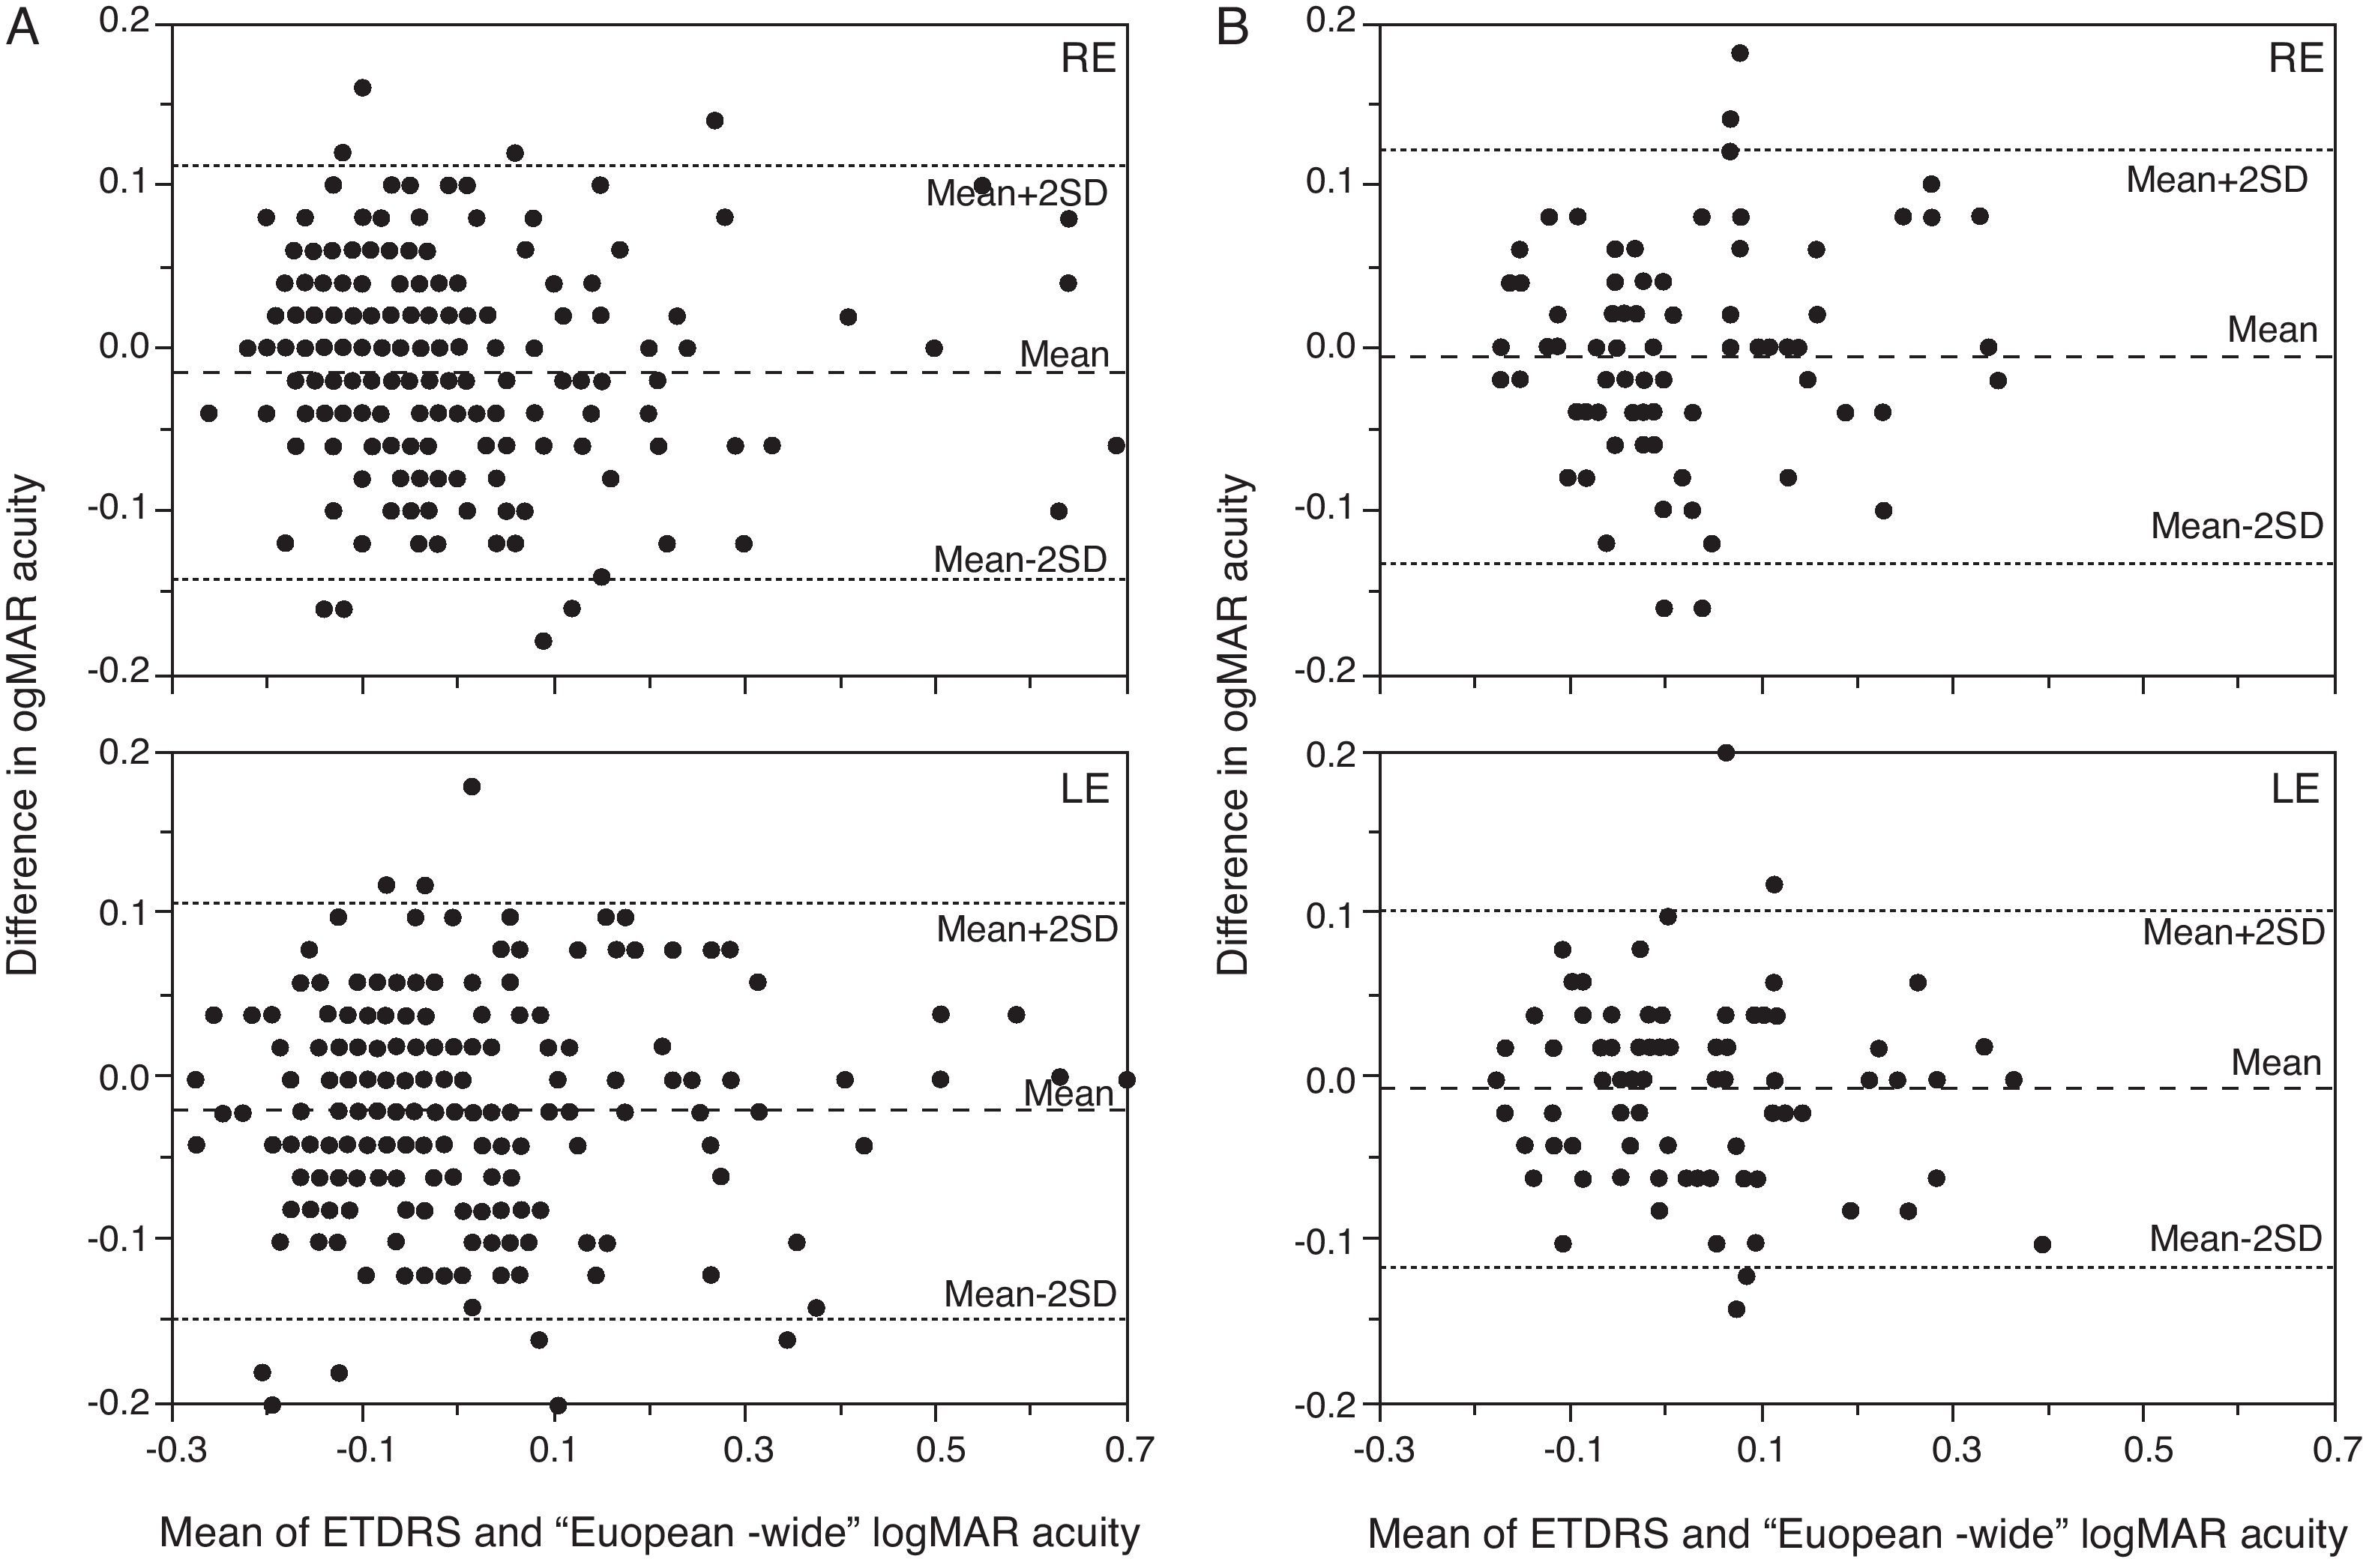
In the Bulgarian group of children the “European-wide” charts generated on average slightly higher logMAR acuity scores, by 0.01 logMAR (with 95% CI 0.00–0.02, p=0.002) for chart 1 and 0.02 logMAR (with 95% CI 0.01–0.03, p<0.001) for chart 2 compared to the standard ETDRS charts, which corresponds to half and one letter difference, respectively (Fig. 3a). The 95% limits of agreements between the two charts were ±0.13 logMAR.
 and chart 2 (lower graph). The dashed line represents the mean difference, whereas the dotted lines the limits of agreement. Data from the Bulgarian (a, left) and Belgian (b, right) subjects are plotted.")
Plot of the difference in logMAR acuity between the measurements with the European-wide and the standard ETDRS charts against their average acuity for chart 1 (upper graph) and chart 2 (lower graph). The dashed line represents the mean difference, whereas the dotted lines the limits of agreement. Data from the Bulgarian (a, left) and Belgian (b, right) subjects are plotted.
In the Belgian group of adults, the difference in the VA between the two charts was 0.01 logMAR (with 95% CI −0.01 to 0.02, p=0.40) for chart 1 and 0.01 (with 95% CI 0.00–0.02, p=0.42) logMAR for chart 2. The 95% limits of agreements between the two charts were ±0.11 logMAR. Finally, in the Greek group of children the mean difference in logMAR between the two sets of charts was 0.02 (with 95% CI 0.01–0.03, p<0.001) for chart 1 and 0.03 (with 95% CI 0.02–0.04, p<0.001) for chart 2, indicating that the European-wide charts were on average less difficult. The 95% limits of agreements between the two charts were ±0.10 logMAR.
DiscussionIn the current work the reliability and variability of a modified set of ETDRS charts was assessed. These charts contain letters that are common to all European alphabets, offering European-wide implementation.17 The charts were found to have excellent test–retest reliability and an acceptable level of TRV (±0.10 for both charts) compared to published estimates of the gold standard ETDRS chart, which range between ±0.07 and ±0.11 log MAR in eyes with no ocular pathology and good vision.7,21–25 Higher TRV values (from ±0.16; to ±0.24) have been reported in patients with reduced vision due to small amounts of defocus7,26 or ocular pathologies.27,28
In the present study, the participants were healthy adolescents and young adults. Although there are no reports linking TRV in acuity with participants’ age and/or their intellectual level, young children are expected to show higher scores of TRV, since a large spread has been observed in the acuities of healthy adolescents compared to adults.29,30 This may be due to acuity development during childhood or to behavioral causes, such as their reluctance to guess the identity of letters that are difficult to see.29 Further work will aim to validate the charts in populations with ocular pathologies and healthy older adults. Moreover, the “European-wide” charts produced close agreement in VA scores with the standard ETDRS chart (95% LoA ranged between ±0.10 and ±0.13 logMAR), providing on average slightly better VA (between 0.01 and 0.03 logMAR) in all populations tested, using the Greek, Cyrillic or Latin alphabet.
ETDRS acuity is currently used extensively in all clinical trials and research studies where the precision measurement of VA is crucial. The “European-wide” charts form a valid alternative to the standard ETDRS chart, offering the advantage of containing letters readable by all European citizens.
Conflicts of interestThe authors report no conflicts of interest. The University of Crete, Sotiris Plainis, Ioannis Pallikaris and Miltiadis Tsilimbaris receive a small royalty from the sales of the University of Crete (European-wide) visual acuity charts.
We would like to acknowledge Dr. August Colenbrander for his useful remarks on VA assessment. Preliminary results of the study were presented at the Association for Research in Vision and Ophthalmology, Ft. Lauderdale, FL, in May 2008.


