

To investigate the visual function correlates of self-reported vision-related night driving difficulties among drivers.
MethodsOne hundred and seven drivers (age: 46.06 ± 8.24, visual acuity [VA] of 0.2logMAR or better) were included in the study. A standard vision and night driving questionnaire (VND-Q) was administered. VA and contrast sensitivity were measured under photopic and mesopic conditions. Mesopic VA was remeasured after introducing a peripheral glare source into the participants' field of view to enable computation of disability glare index. Regression analyses were used to assess the associations between VND-Q scores, and visual function measures.
ResultsThe mean VND-Q score was -3.96±1.95 logit (interval scale score: 2.46±1.28). Simple linear regression models for photopic contrast sensitivity, mesopic VA, mesopic contrast sensitivity, and disability index significantly predicted VND-Q score (P<0.05), with mesopic VA and disability glare index accounting for the greatest variation (21 %) in VND-Q scores followed by photopic contrast sensitivity (19 %), and mesopic contrast sensitivity (15 %). A multiple regression model to determine the association between the predictors (photopic contrast sensitivity, mesopic VA, mesopic contrast sensitivity, and disability index) and VND-Q score yielded significant results, F (4, 102) = 8.58, P < 0.001, adj. R2 = 0.2224. Seeing dark-colored cars was the most challenging vision task.
ConclusionChanges in mesopic visual acuity, photopic and mesopic contrast sensitivity, as well as disability glare index are associated with and explain night driving-related visual difficulties. It is recommended to incorporate measurement of these visual functions into assessments related to driving performance.
Driving is a complex task that requires the effective coordination of cognitive and motor skills and cannot be executed without vision, which is responsible for approximately 95 % of all the sensory driving requirements.1–3 Although several other factors including weather conditions, driver's demographics, types of roads, vehicle state, as well as the psychological and physical state of the driver can impact safe driving, visual challenges associated with night-time driving, that affect optimum visual function can be very daunting and can impact negatively on driving performance and safety.1,3,4 These challenges have led to a number of self-reported vision-related driving difficulties among drivers. Driving in low visibility conditions such as at night and in adverse weather conditions has been acknowledged as very challenging, particularly for older drivers, with visual factors being largely responsible for these challenges.5–7
Vision under mesopic conditions, typical of the night driving environment, is inherent with challenges such as reduced visual acuity, contrast sensitivity, temporal processing, and velocity perception. Pupillary dilation under mesopic conditions reduces depth of focus, significantly affecting vision. All these challenges are heightened with aging and in the presence of ocular diseases.8 Approximately two-thirds of drivers, 50 years and older, have reported some degree of visual difficulties with night driving and about one-third of these drivers have reported difficulties with glare from headlights and streetlights when driving at night.5,9
In Ghana, just as observed in other countries, there is a higher risk of fatal accidents occurring at night compared to daytime.6,10 Approximately 65 % of all night-time fatalities and 67 % of all nighttime crashes occur in the early hours of the night, between the hours of 18:00 and 22:00, particularly on rural roads where there are no streetlights and on single two-lane roads.6 Drivers’ visual limitations are a leading contributor to night-time road traffic crashes most especially involving pedestrians.11 With this knowledge, however, the Driver and Vehicle Licensing Authority (DVLA) in Ghana still assesses only photopic visual acuity to declare drivers fit to drive in the daytime as well as at night,12 while there is evidence that photopic visual acuity is not a good predictor of the visual capacity to drive at night.9,13
Previous studies found contrast sensitivity, visual acuity, disability glare, and photostress recovery time measured under conditions representative of the night driving environment to be associated with visual challenges drivers face when driving at night. The measures were also found to have predictive value in assessing driving performance and safety during nighttime conditions.10,14 These studies had limited focus on Africa where poor visibility at night from dusty roads and inadequate street lighting, as well as narrow single carriage roads are a major concern. The aim of this study was to determine tests of visual functions that best predict vision-related night-driving challenges among official drivers in the University of Cape Coast and the Cape Coast Technical University, Ghana.
MethodsThis was a cross-sectional study that involved male drivers from the University of Cape Coast and the Cape Coast Technical University. The study protocol was approved by the Institutional Review Board of the University of Cape Coast (Ethical Clearance ID: UCCIRB/CHAS/2021/90; Date: 3rd September 2021) and followed the principles expressed in the Declaration of Helsinki by the World Medical Association. Subjects were properly instructed and consented to participate by signing the appropriate informed consent paperwork. All data and records generated throughout the course of the study were handled with strict confidentiality and anonymity in alignment with the University of Cape Coast's institutional policies. The study was conducted at the University Eye Clinics of the University of Cape Coast and the Cape Coast Technical University where photopic measures of visual functions were taken. Mesopic and glare-based tests were performed in a simulated room (black tent) outside the clinic. Consenting drivers who had a history of night driving within the previous six months and had driven in the night for at least 70 km per week were enlisted for the study. All the drivers recruited for the study had current driver's licenses. Drivers who had major eye conditions and did not meet the DVLA licensing criteria of binocular visual acuity of 6/9 (0.2 LogMAR) or better were excluded from the study. Newly recruited drivers who had not worked for the Universities for more than 6 months were also considered ineligible.
A standard Vision and Night driving Questionnaire (VND-Q) adopted from Kimlin et al.10 was used to assess drivers’ difficulty in seeing or performing certain tasks in a night driving environment using a 5-point Likert scale (1=no difficulty, 2 = a little difficulty, 3=moderate difficulty, 4 = a lot of difficulty, and 5=extreme difficulty). The scores were converted to Rasch-scaled logit scores, with higher scores indicating greater levels of difficulty. This was done to make the scores suitable for parametric statistics. This method removes the assumptions regarding item and category spacing that are present in classical test theory, and it also accommodates missing data by utilizing computed Rasch model responses.15–17 Additionally, the scores were converted into Rasch-scaled interval-level scores for easier interpretation. The interval-level scores range from 0 to 10, higher scores indicating greater vision-related night driving difficulties.
A comprehensive series of visual function assessments were conducted under photopic, mesopic, and induced glare conditions following an assessment of participants’ ocular health. All visual function assessments were conducted binocularly using the participants’ habitual driving correction (if any) or determined refractive corrections. This was to meet the aim of this study which sought to “identify the visual function tests that best predict drivers’ vision-related night-driving difficulties”; which is a binocular viewing experience. Photopic tests were conducted first, followed by mesopic, and glare-based tests.
Photopic visual function testsThe room lighting in both clinics provided a photopic luminance level of 101.4 ± 2 cd/m2 as confirmed by five measurements (taken in each corner of the room and the center of the chart) using the Smart Sensor Digital Lux Meter AS803 (Intell Smart). This level was consistent with the recommended photopic lighting requirements for each of the vision tests.18,19 Distance visual acuity was measured at 4 m with a high contrast Bailey-Lovie logMAR chart. Each letter on the chart was assigned 0.02 logMAR units. Tests of visual acuity were performed binocularly. Non-cycloplegic distance refractive errors were determined objectively using a KR 9000 auto refractometer (Perlong Medical Equipment Co. Ltd., Jiangsu, China) and subjectively by the maximum plus to maximum visual acuity method to correct refractive errors. The prescriptions from subjective refractions were worn by participants throughout all other tests of visual functions.
Photopic contrast sensitivity was measured at 1 m using a Pelli-Robson chart. Participants were given time and encouraged to guess letters until a full triplet was answered incorrectly. Contrast sensitivity was scored on a letter-by-letter basis (0.05 log units for every correctly identified letter) with O and C being accepted interchangeably as this improved the repeatability of the test.20
Mesopic testsMesopic condition was produced using dimmable halogen lighting to produce chart luminance of 1 cd/m2. The room luminance was 0.2 ± 0.4 cd/m2, an average of five measurements from the Smart Sensor Digital Lux Meter AS803. This luminance level falls within the range of 0.1–1 cd/m2, as used by previous studies.9,19 Participants were given a 10-minute adaptation period to adapt to the mesopic light level before the tests were performed.9 Mesopic visual acuity was measured as it was measured under the photopic condition. Mesopic visual acuity was used as baseline vision for disability glare under mesopic luminance. Contrast sensitivity was measured in a similar manner as measured under photopic conditions.
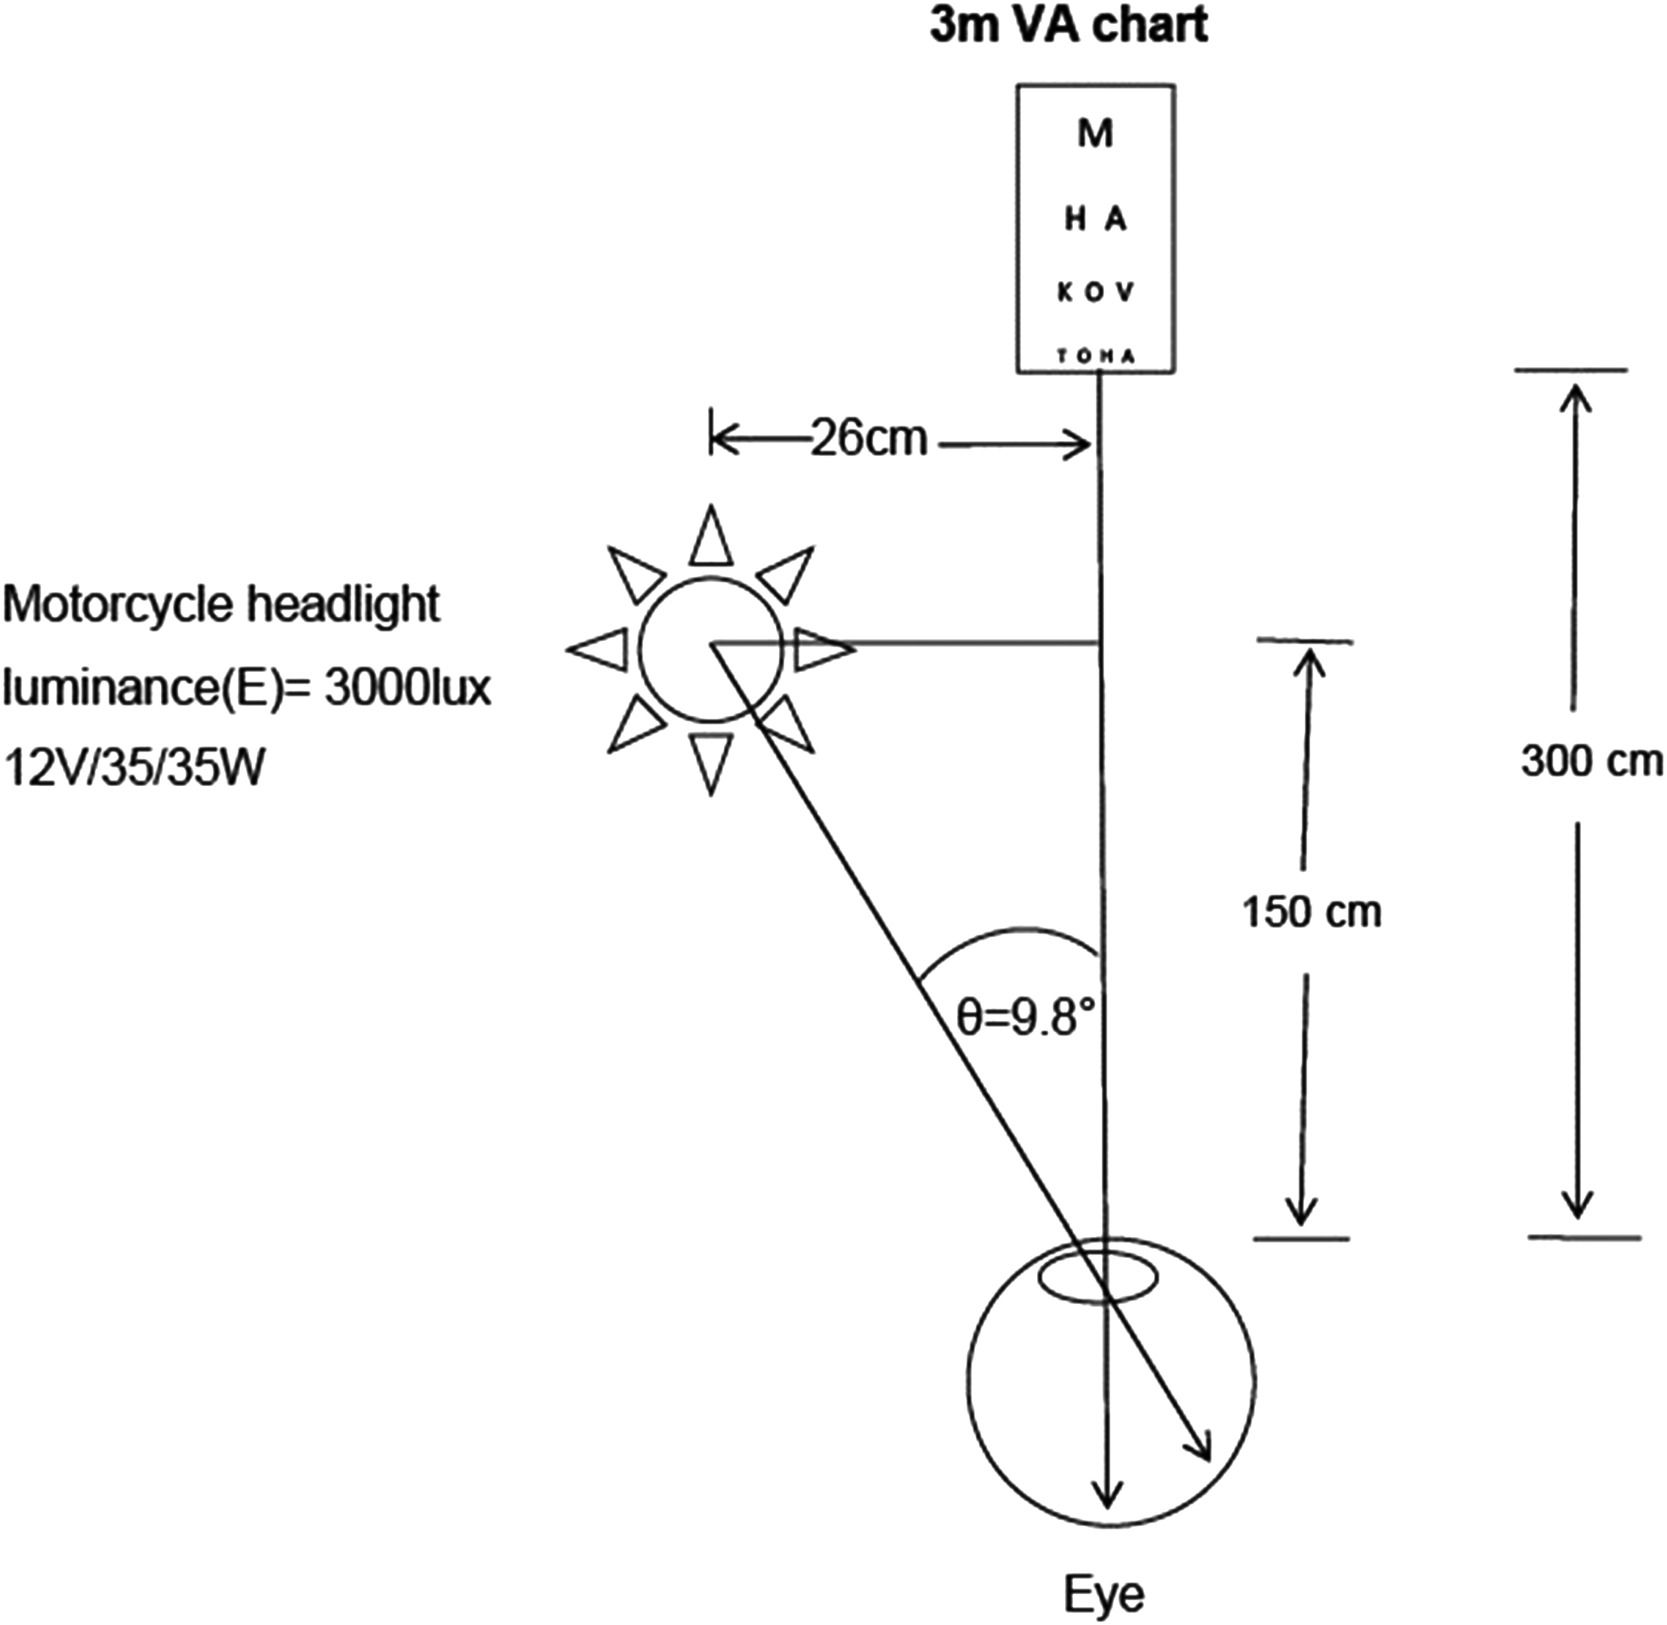
Glare testsDisability glare was measured under the mesopic condition with a room luminance of 0.2 ± 0.4 cd/m2. A motorcycle headlight with a luminous intensity (E) of 3000 cd/m2 was used for the glare test. The luminous intensity of the motorcycle is representative of the average luminous intensity of common vehicle headlights used in Ghana measured at 20 m.19 The glare source (motorcycle headlight) was positioned at an angle of 9.8° from the line of sight of participants’ left eye as adopted from previous studies.9,19 The headlight was positioned at the left side of participants to mimic the direction of glare on two-lane roads and because all Ghanaian drivers drive on the right side of the lane. A 3-meter Snellen visual acuity chart was positioned 3 m away from participants. To obtain the 9.8° angle which falls within the range of angles for determining the amount of disability glare, 1° < θ < 30°, the motorcycle headlight was positioned 1.5 m away from the participants’ eye and 26 cm away from the line of sight of the left eye Fig. 1. The amount of glare (lv) thus introduced into participants’ eyes throughout the glare test was 31.87 lx, calculated from the validated classical Stile Holladay disability glare formula below.21

For the glare tests, visual acuities measured under mesopic conditions were used as baseline vision. A seen-to-not-seen approach was used to minimize any photostress effect and after-image from the glare source. The disability glare index was calculated as the difference between the baseline visual acuity and the logMAR equivalent of the visual acuity under glare. The disability glare index was converted to a z-score to facilitate statistical analysis and interpretation. The conversion involved transforming the raw disability glare index values into standardized units. A positive z-score indicated a lower level of disability glare, while a negative z-score represented a higher level of disability glare. This transformation allowed for easier comparisons and assessments of the impact of disability glare on the study outcomes.
Data were analysed using R version 4.3.0 (R Foundation). The strength and direction of associations between variables were examined using Pearson's correlation coefficients. The correlation coefficients were interpreted based on established guidelines, with values closer to +1 indicating a strong positive correlation and values closer to −1 indicating a strong negative correlation. To investigate the linear relationship between the predictors and VND-Q scores, linear regression analysis was performed. A simple linear regression model was fitted to the data, and the coefficient of determination (R-squared) was used to assess the goodness of fit. Multiple regression analysis was conducted to explore the combined influence of all the independent variables on the dependent variable. The analysis aimed to determine the extent to which all the visual function measures collectively predicted VND-Q scores. Adjusted R-squared was used to assess the overall fit of the model.
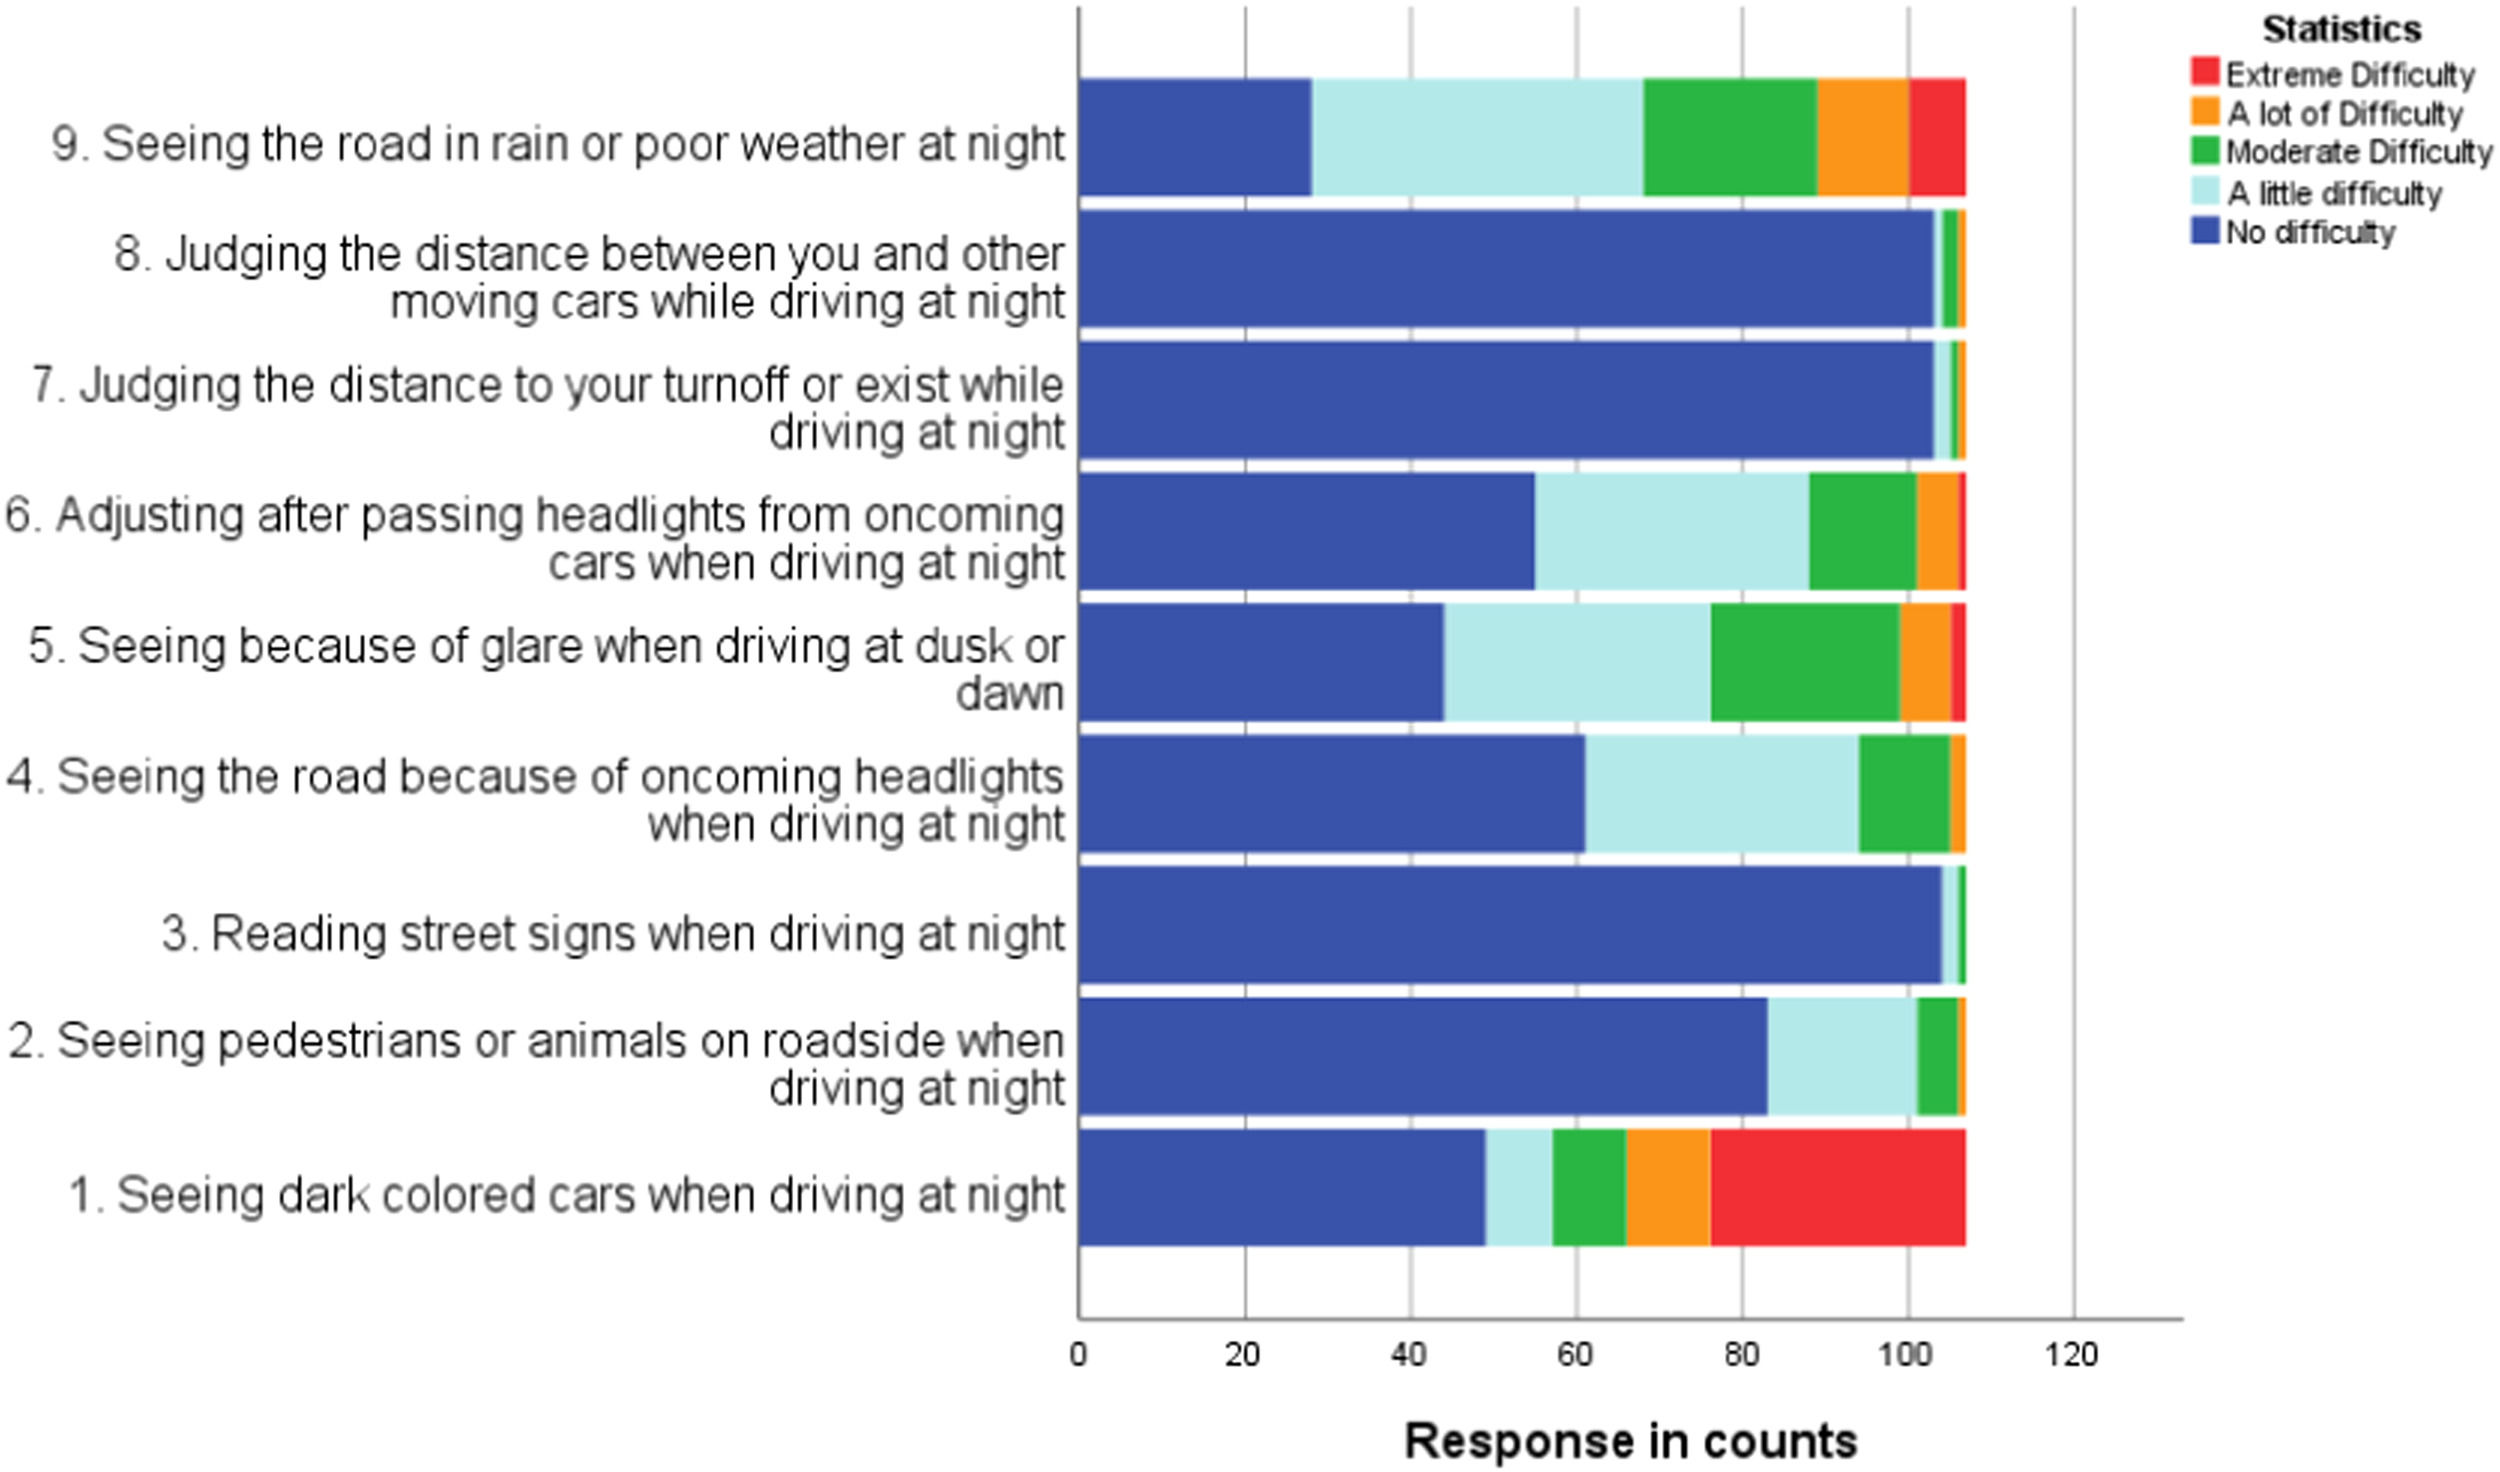
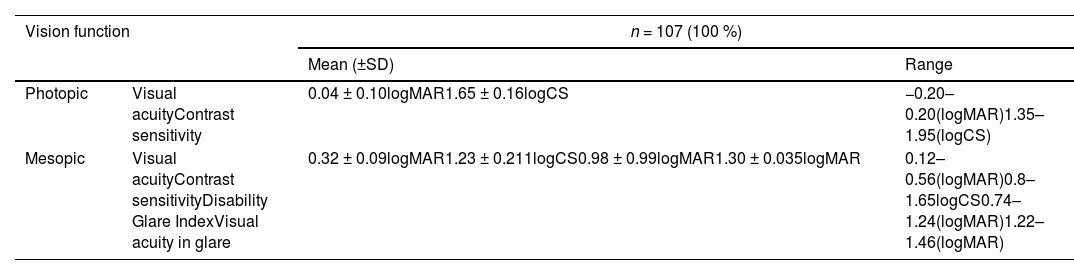
ResultsThe study comprised 107 male participants with a mean age of 46.06 ± 8.24. Table 1 shows the results of the visual function tests performed. The average self-reported vision-related night-driving difficulty, as evaluated with the VND-Q, was −3.96±1.95 logit, representing an interval scale score of 2.46±1.28 (10 = maximum difficulty). Subjects reported a range of difficulty, scoring from −7.72 to −0.93 logit on the VND-Q (interval scale score: 0.0 to 4.5). More negative values indicate fewer difficulties and more positive values indicate greater difficulties. Fig. 2 displays the summaries of drivers' ratings on the VND-Q items. “Seeing dark-colored cars when driving at night” was the most challenging vision task with the least difficult being “reading street signs.”
Summary of participants’ visual function tests results.

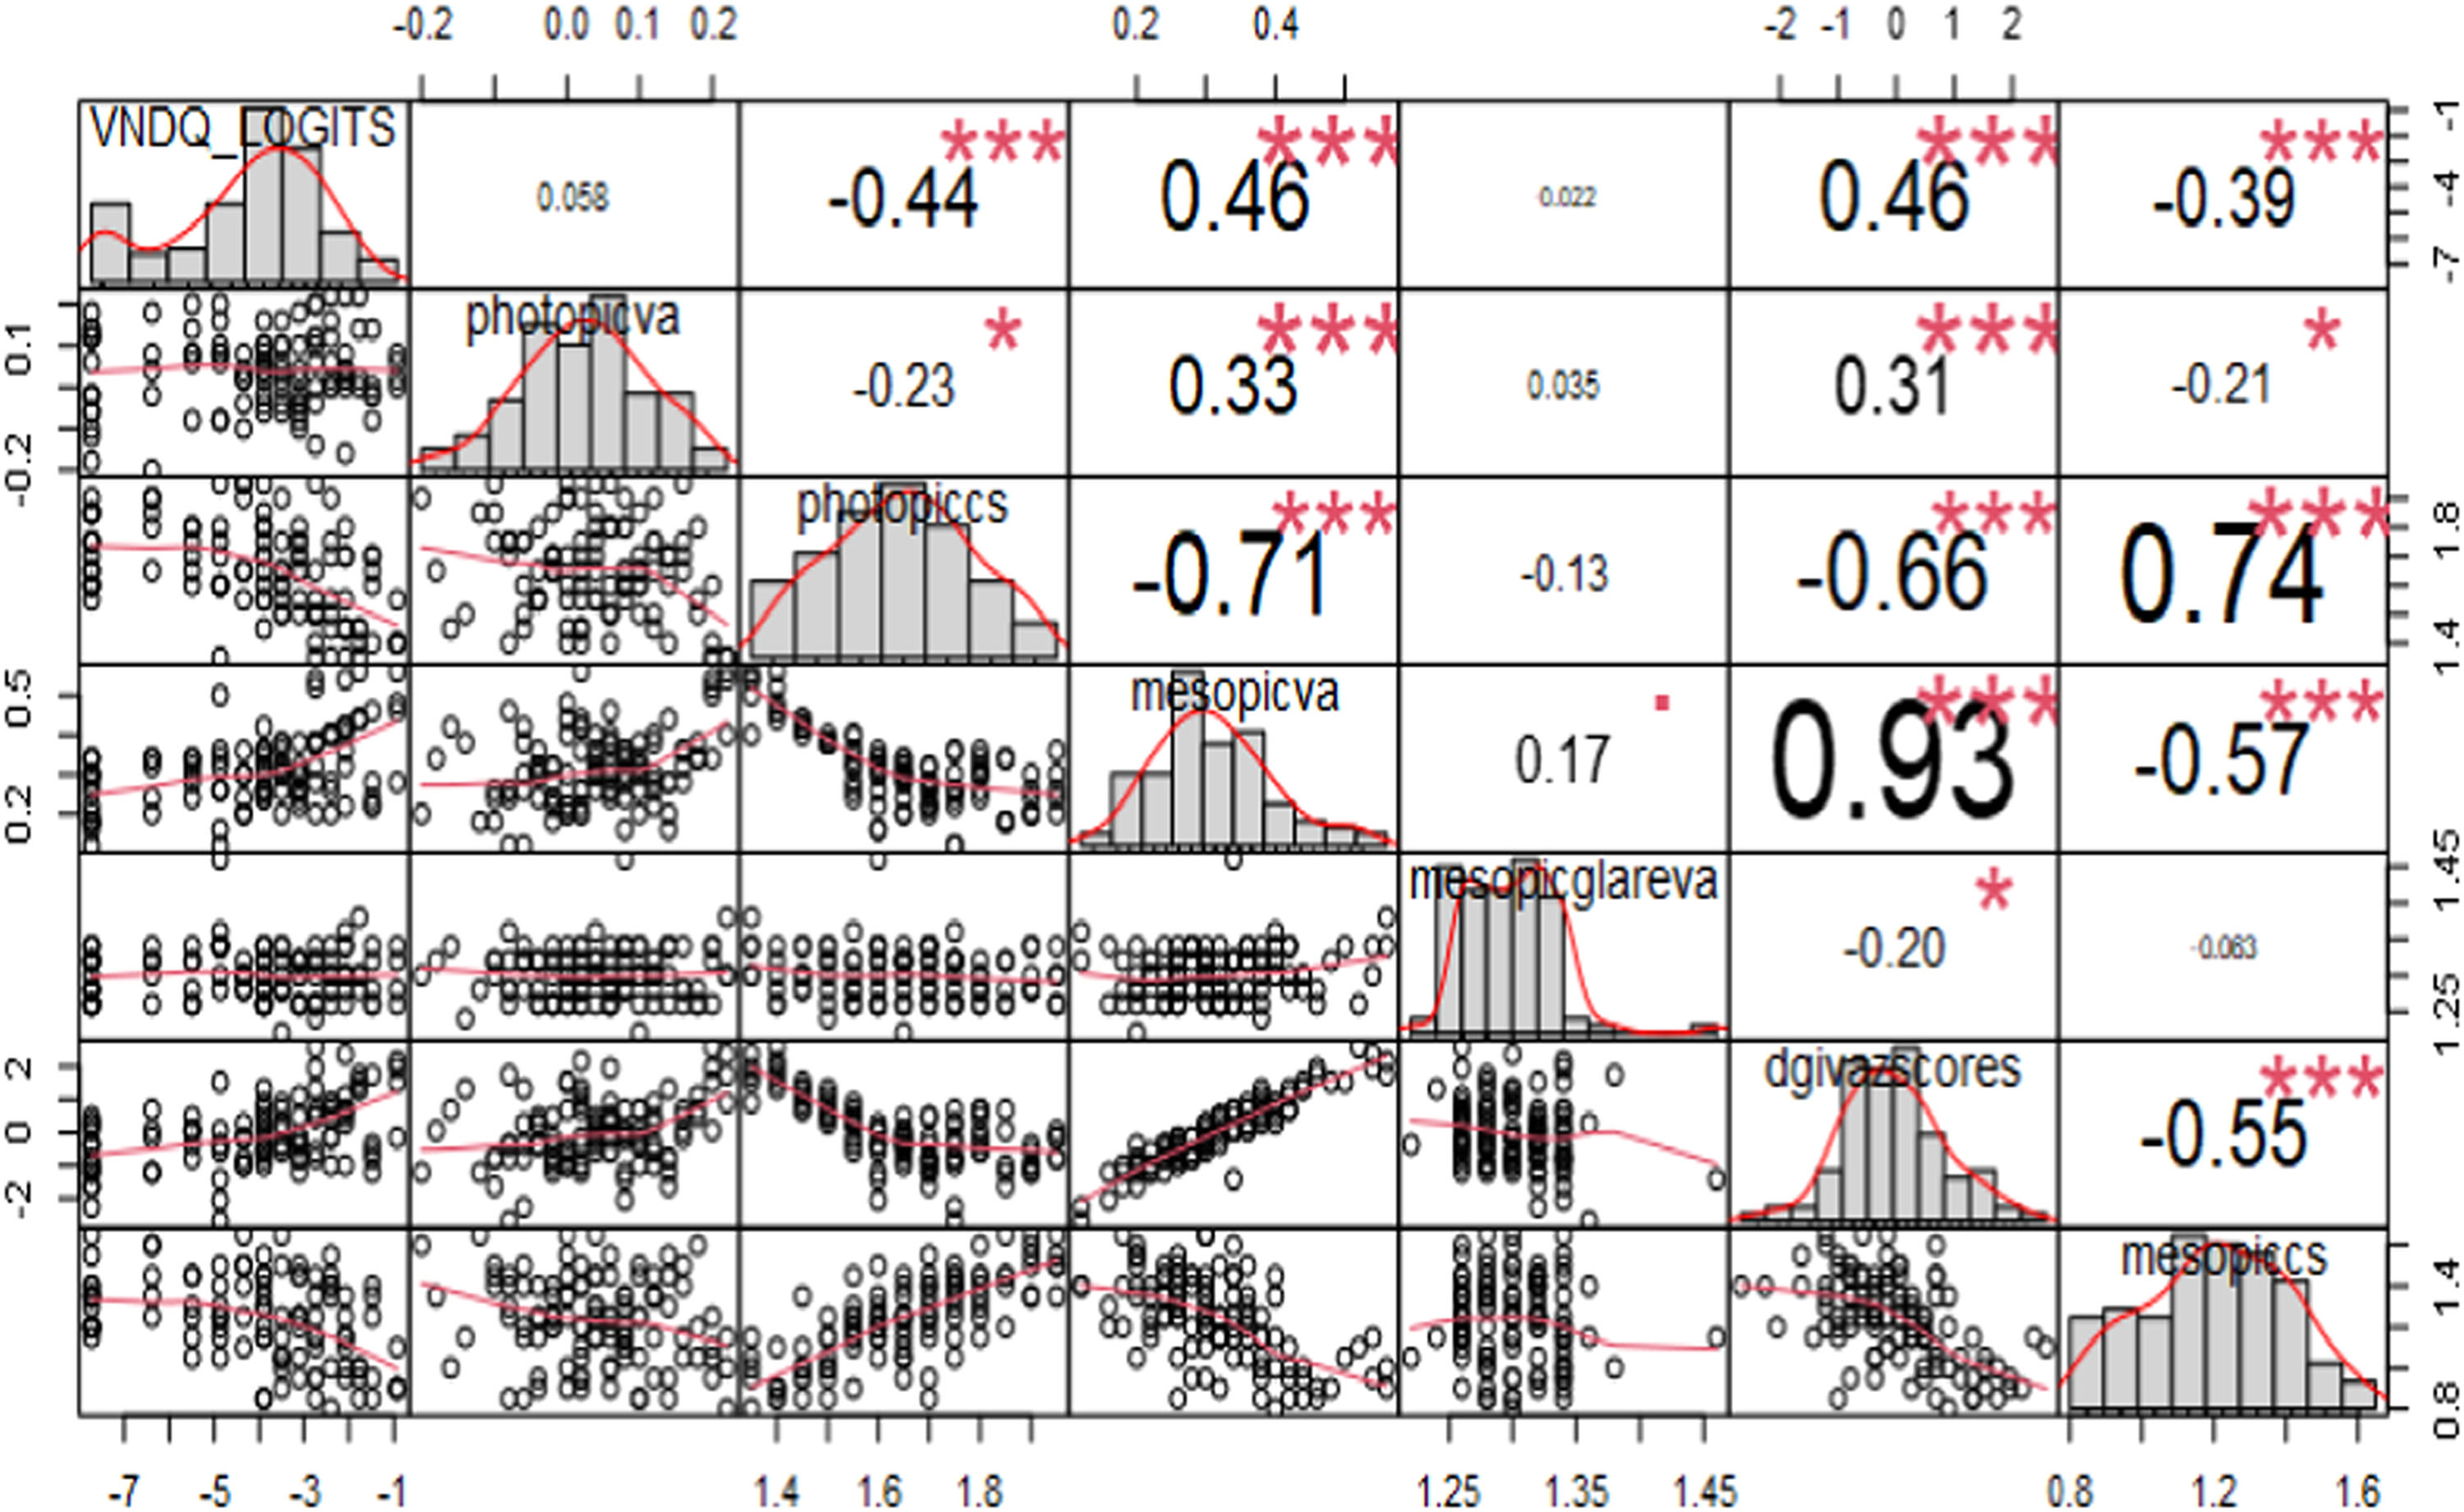
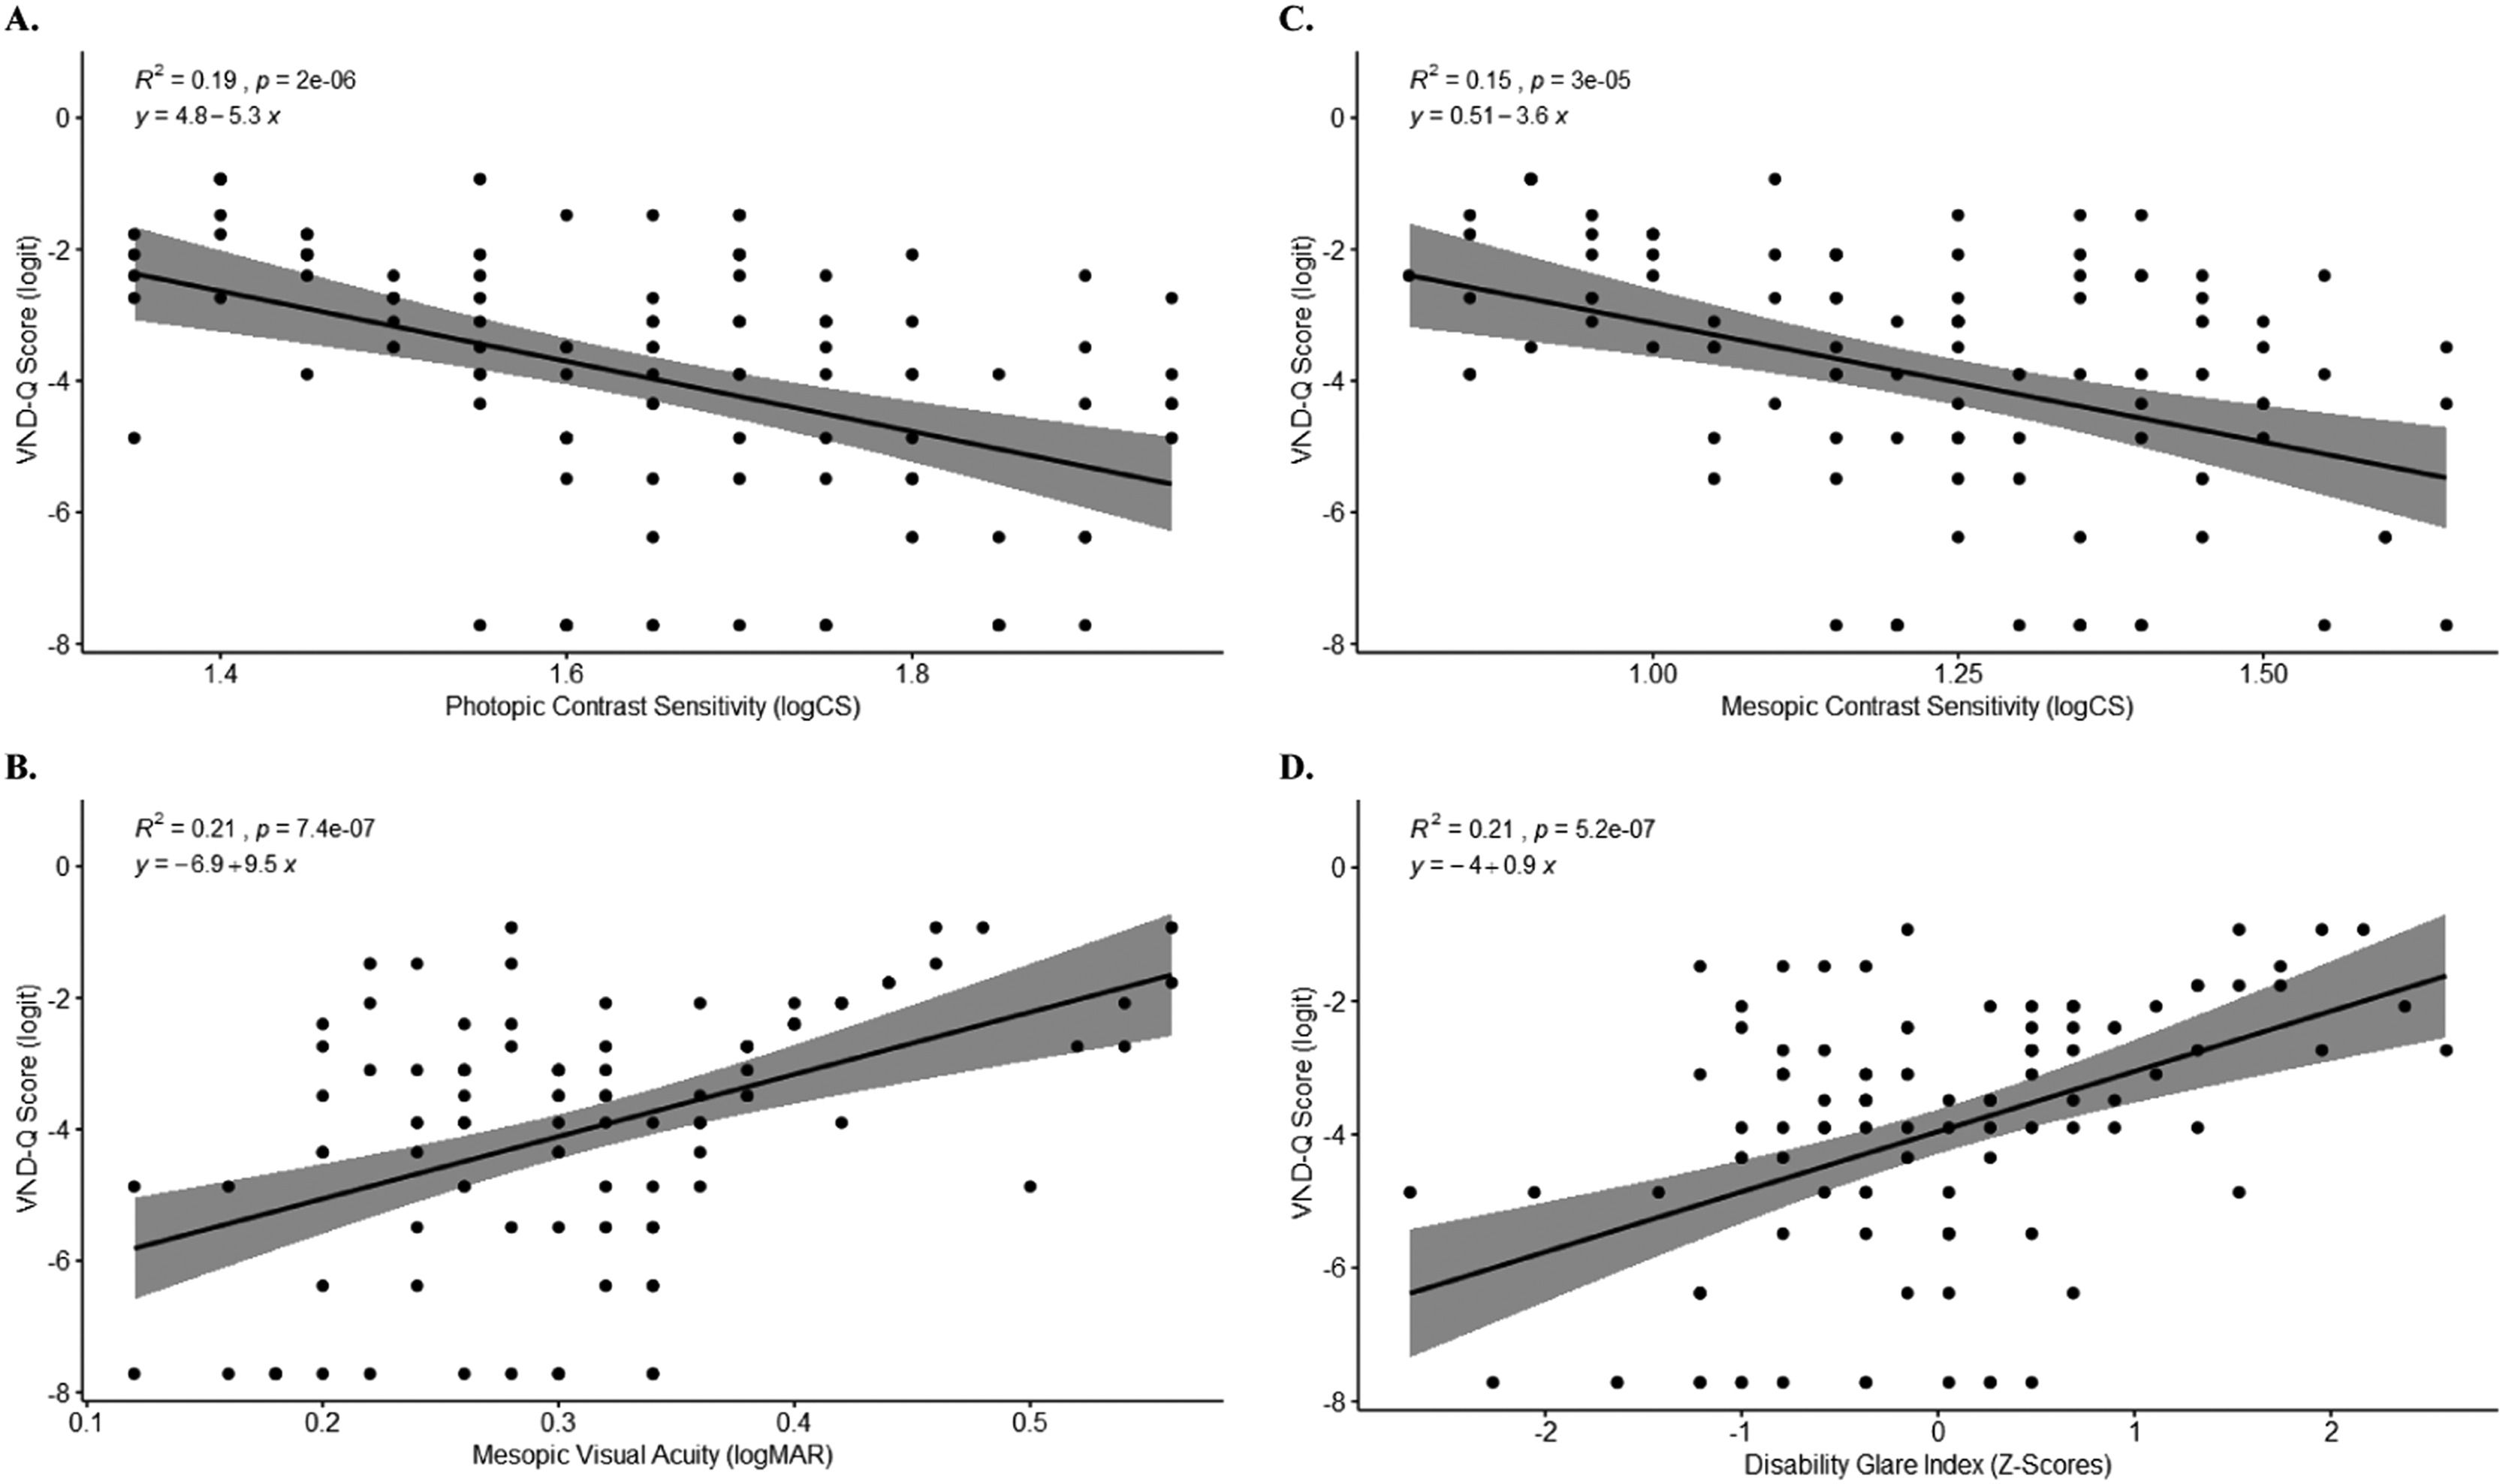
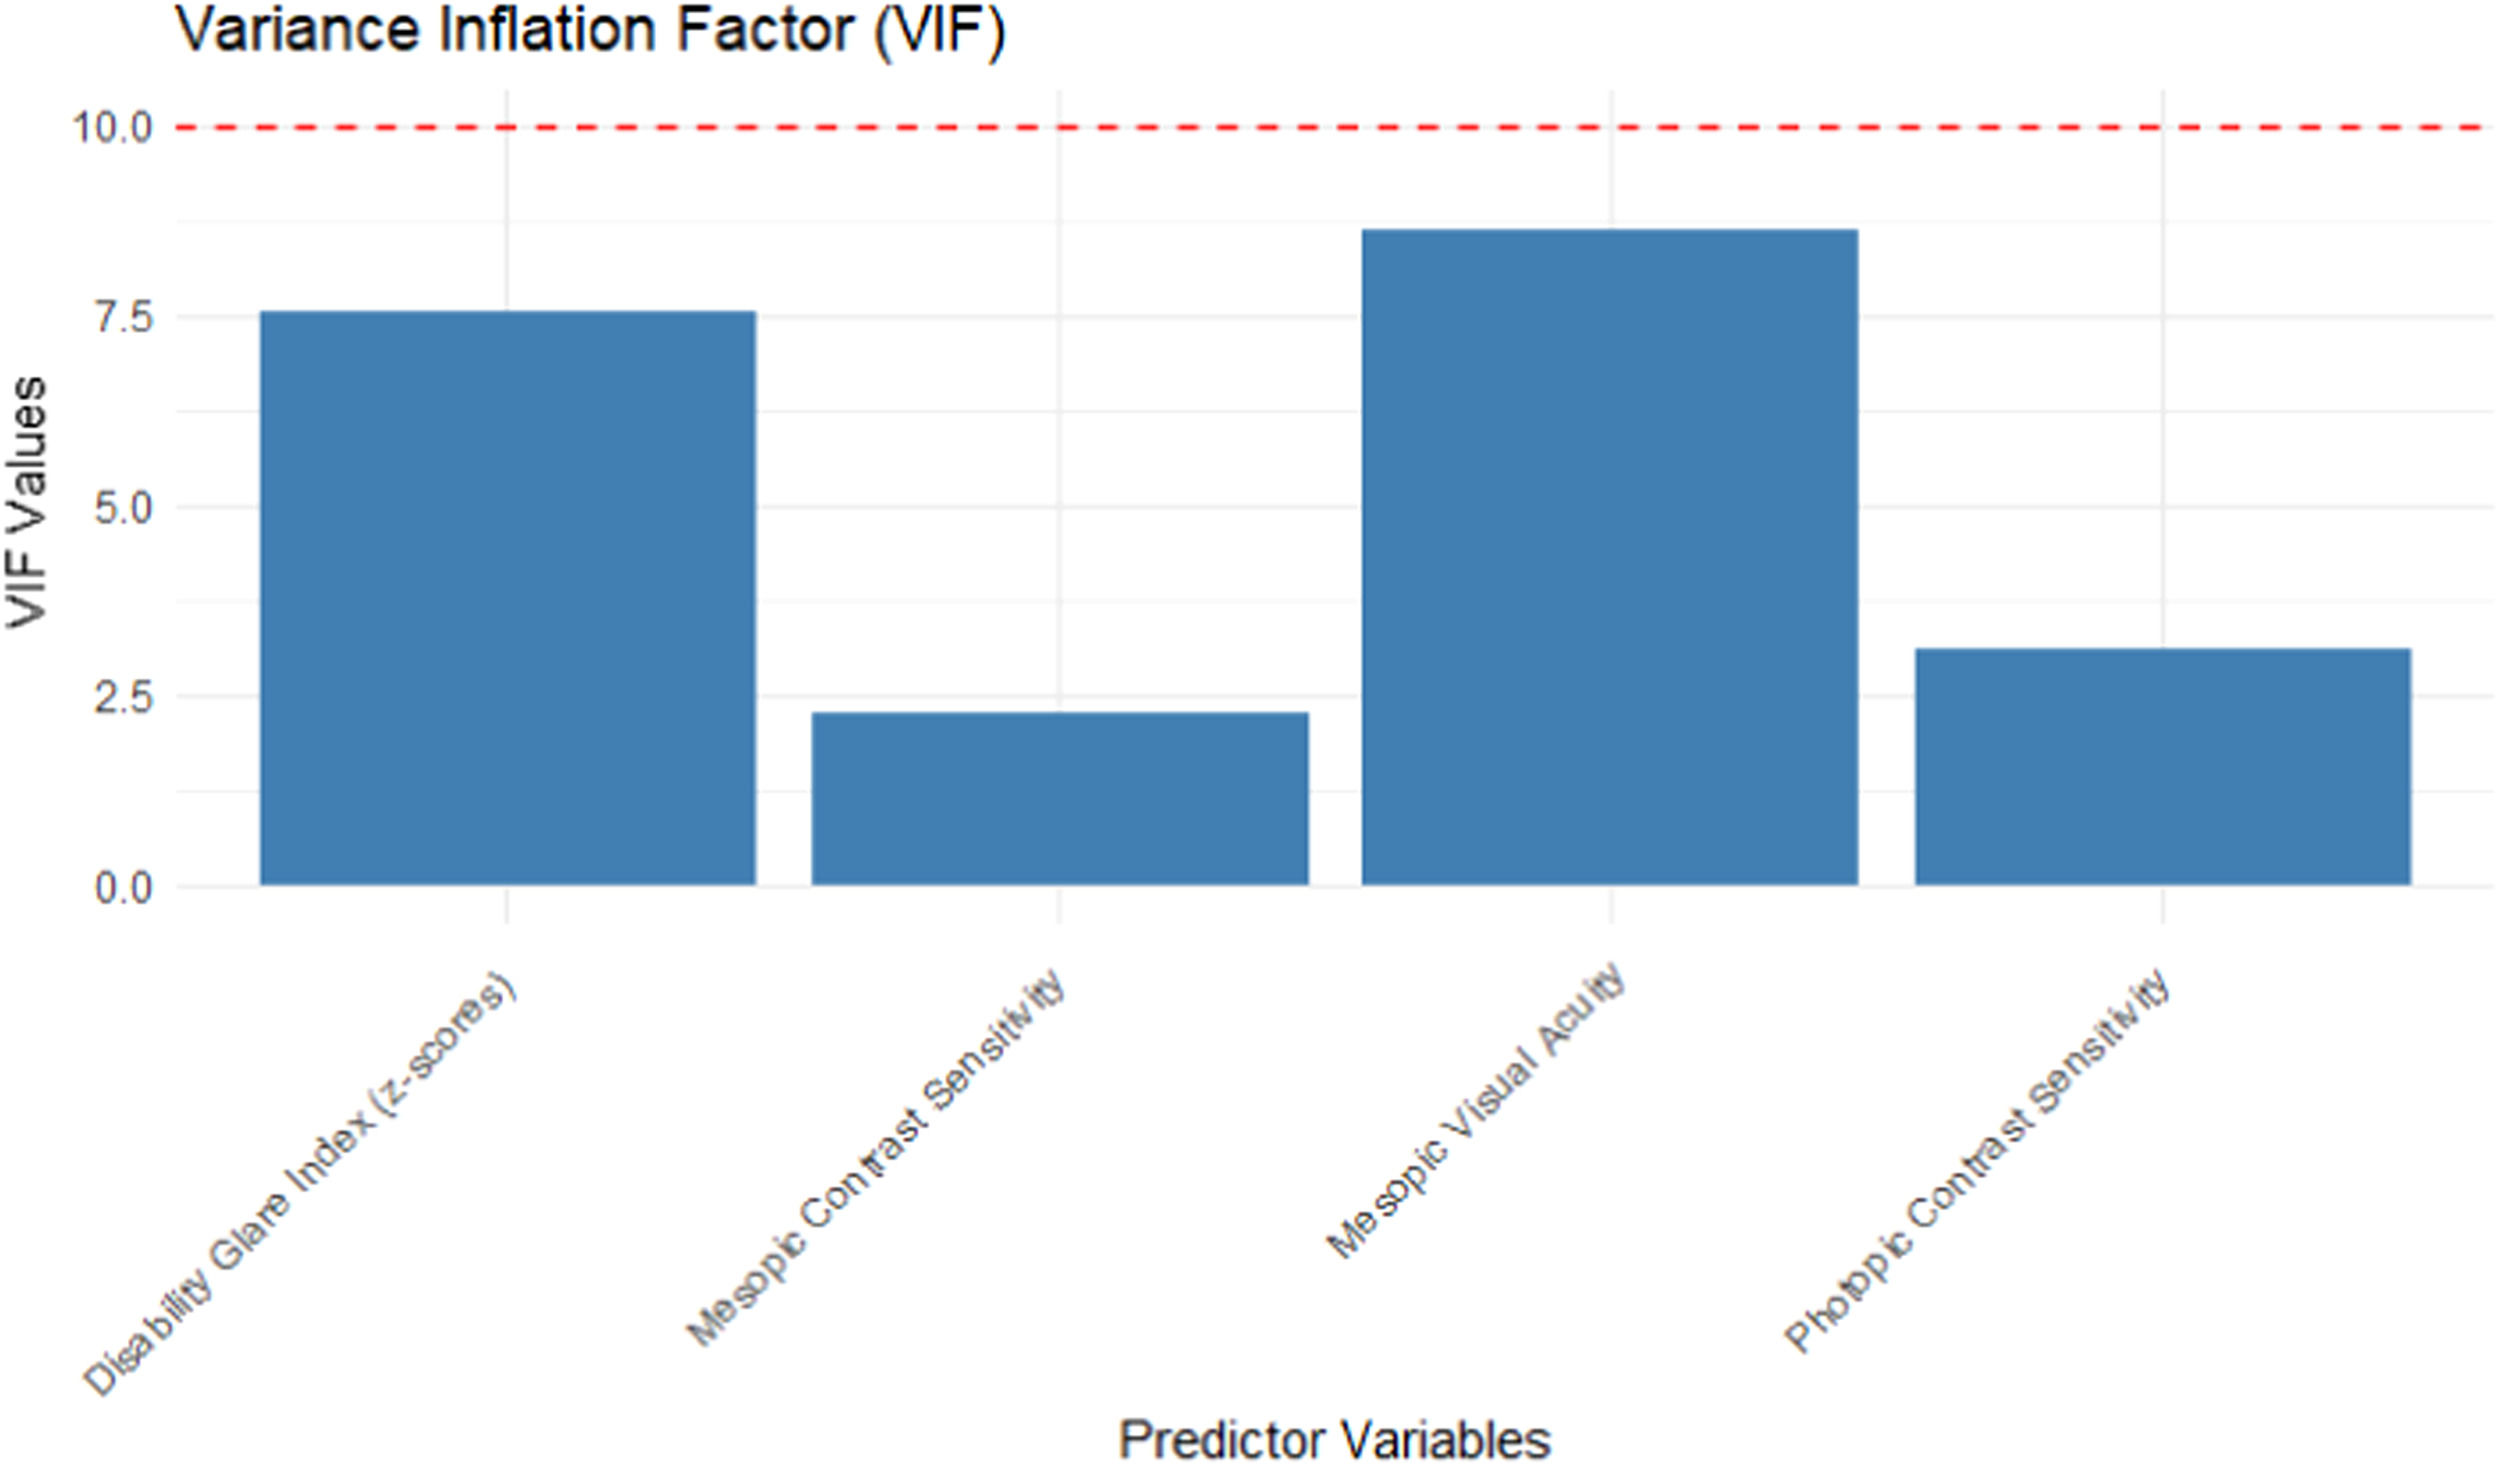
The correlation chart in Fig. 3 shows that VND-Q scores did not significantly correlate with photopic visual acuity and visual acuity taken in glare. Thus, these predictors were not included in the simple linear regression analyses. Fig. 4 shows linear regression plots for VND-Q scores and visual function measures that significantly correlated with VND-Q scores. Mesopic visual acuity and disability glare index accounted for the strongest association with VND-Q score, each explaining 21 % of the variation in VND-Q score. A multiple regression was run to predict VND-Q from photopic contrast sensitivity, mesopic visual acuity, mesopic contrast sensitivity, and disability glare index. These variables significantly predicted VND-Q, F (4, 102) = 8.58, P < 0.001, adj. R2 = 0.2224. A Multicollinearity test did not reveal high variance inflation factor (VIF) values (>10) for the predictors (Fig. 5).
.")
Correlation Chart (VND-Q_LOGITS = Vision-related nighttime driving difficulty questionnaire, photopicva = photopic visual acuity, photopiccs = photopic contrast sensitivity, mesopicva = mesopic visual acuity, mesopicglareva = mesopic visual acuity in glare, dgivazscores = Z-scores of disability glare index, mesopiccs = mesopic contrast sensitivity).
, mesopic visual acuity (B), mesopic contrast sensitivity (C), and Z-scores of disability glare index (D).")

Mesopic visual acuity was found to be significantly reduced and positively correlated with vision-related night driving difficulty. Comparably, Rijn et al. found mesopic visual acuity to be associated with subjectively perceived driving disability at night.13 The results might also prove to be plausible when compared with the findings reported by Sivak and Olson.22 Prior investigations found reduced mesopic visual acuity in drivers involved in nighttime crashes with other road users compared to drivers with clean records.23
There was no significant correlation between photopic visual acuity and vision-related nighttime driving difficulty. In support of this, Wood and Owens found high contrast photopic visual acuity as a poor predictor of driving performance in mesopic conditions at night.24 This raises questions about the role of visual acuity in driving performance during low-light conditions. It challenges the conventional belief that photopic high-contrast visual acuity alone is a good predictor of all-time driving challenges. The results indicate that while photopic visual acuity is typically associated with optimal vision in well-lit environments, it may not accurately reflect visual capabilities in situations with reduced lighting, glare, and decreased contrast sensitivity. These factors are commonly encountered during nighttime driving and can significantly impact visual performance and the ability to detect and respond to hazards on the road.
Consistent with a report by Wood et al., we found photopic contrast sensitivity to account for vision-related driving difficulty better than mesopic contrast sensitivity although the difference was slight.25 Photopic contrast sensitivity also correlated highly with nighttime driving performance in a study in which different degrees of visual impairment were simulated and in another study in which headlight beam illumination was altered.24,26 Contrarily, Wood and Owens indicated that mesopic contrast sensitivity predicted drivers’ nighttime recognition performance better than photopic contrast sensitivity.24 This variation could be because the current study did not involve real-time road tests.
Studies have reported an association between glare and night driving difficulty, where higher levels of glare sensitivity increased the risk of nighttime collisions.27 Contrarily, our findings present an unexpected result: individuals with poor tolerance to disability glare reported less nighttime driving difficulty. This discrepancy could be attributed to the method of determining the disability glare index, which involved measuring the reduction in visual acuity caused by a glare source. We achieved this by remeasuring mesopic visual acuity after introducing a peripheral glare source into the participants' field of view. We observed that the visual acuity measurements taken under glare did not exhibit significant variation among the subjects, and they also did not exhibit a significant correlation with nighttime driving difficulty. In contrast, the visual acuity measurements taken in the absence of glare did demonstrate variation among the subjects. As a result, individuals who displayed good mesopic visual acuity without glare now appeared to have a poor disability glare index. These findings suggest that the measurement of mesopic visual acuity under glare may lack the necessary sensitivity to capture meaningful variations among individuals. Consequently, it becomes less informative for predicting driving difficulty, especially considering its utilization in calculating the disability glare index. This highlights the need for further research to refine and improve the clinical measurement of disability glare, considering the complex and individualized nature of visual perception under varying lighting conditions.
In a study conducted to investigate the influence of vehicle color on the risk of being involved in road traffic accidents, vehicles with light colors had a slightly lower risk of being involved in collisions compared with vehicles with darker colors.28 Likewise, participants in the present study judged “seeing dark-colored cars” as the most difficult visual task in the night driving environment. This could be because dark-colored cars contrast less with roads at night especially when headlights are off. Furness et al. found an increased risk of serious injury associated with brown vehicles followed by black and green vehicles.29
Observations from earlier investigations provide an interesting parallel to the current study, in that driving in the rain or poor weather at night was rated by participants as a major difficult task.5 The results also corroborate the findings of some accident studies in which rain was found to lower the contrast between objects and their background, thus reducing the detection performance of drivers and making driving more difficult.30–32 Sayer and Mefford also found an association between visual acuity and misty windshields.33
The least difficult visual task was “reading street signs”. Road signs in Ghana are made of reflectors which enhance their visibility in the night. Also, these road signs are designed and placed based on the assumption that drivers have a minimum binocular visual acuity of 0.2 logMAR. Therefore, drivers who meet the DVLA vision criteria can easily read street signs. This is consistent with the outcomes reported by Antwi-Adjei et al.12
A limitation of the study is that it was difficult getting honest answers from some drivers because they feared they would lose their jobs if their authorities got to know that they had reduced vision. Our findings show that some standard and nonstandard tests of visual function measured under conditions representative of the night-driving environment such as mesopic, and glare conditions best predict visual difficulties associated with night-driving than high contrast photopic visual acuity.
Future studies are required to confirm the findings of this study by assessing the associations between these tests of visual function and actual driving performance in Ghana. It is recommended that the DVLA incorporates these tests of visual function into the series of tests performed prior to issuance of a driver's license to ensure that only “safe drivers” drive at night. Clinicians can also adopt these tests in assessing drivers who report visual challenges with night driving. Driver education based on results from visual function tests may encourage drivers to adopt better self-regulatory practices such as night driving restrictions or to seek medical intervention where appropriate.
Given that driving is a means of income for most drivers, restricting drivers with visual challenges at night to drive only in the daytime might affect them greatly. This study has provided the foundation based on which improvements in safety on the road at night can be directed. It is therefore recommended that future studies be directed toward identifying appropriate vision aids for drivers identified with vision-related night driving difficulties.
FundingThis research did not receive any specific grant from funding agencies in the public, commercial, or not-for-profit sectors.
The authors gratefully acknowledge the management of Cape Coast Technical University and the University of Cape Coast, as well as the drivers who participated in the study, for their cooperation.


