


When observers focus their stereoscopic visual system for a long time (e.g., watching a 3D movie) they may experience visual discomfort or asthenopia. We tested two types of models for predicting visual fatigue in a task in which subjects were instructed to discriminate between 3D characters. One model was based on viewing distance (focal distance, vergence distance) and another in visual direction (oculomotor imbalance).
MethodA 3D test was designed to assess binocular visual fatigue while looking at 3D stimuli located in different visual directions and viewed from two distances from the screen. The observers were tested under three conditions: (a) normal vision; (b) wearing a lens (−2 diop.); (c) wearing a base-out prism (2▿) over each eye. Sensitivity and specificity were calculated (as Signal Detection Theory parameters: SDT).
ResultsAn ANOVA and SDT analyses revealed that impaired visual performance were directly related to short distance and larger deviation in visual direction, particularly when the stimuli were located nearer and at more than 24° to the centre of the screen in dextroversion and beyond.
ConclusionThis results support a mixed model, combining a model based on the visual angle (related to viewing distance) and another based on the oculomotor imbalance (related to visual direction). This mixed model could help to predict the distribution of seats in the cinema room ranging from those that produce greater visual comfort to those that produce more visual discomfort. Also could be a first step to pre-diagnosis of binocular vision disorders.
Cuando los observadores centran su sistema visual estereoscópico durante un tiempo prolongado (ej.: viendo una película en 3D), pueden experimentar molestias visuales o astenopia. Probamos dos tipos de modelos de predicción de la fatiga visual en un estudio, en el que se solicitaba a los sujetos que discriminaran entre caracteres en 3D. Un modelo se basaba en la visión lejana (distancia focal, distancia de vergencia), y el otro en la dirección visual (desequilibrio oculomotor).
MétodoSe diseñó una prueba en 3D para valorar la fatiga visual binocular mientras se observaban estímulos en 3D situados en diferentes direcciones visuales, y se veían a dos distancias de la pantalla. Se realizó la prueba a los observadores bajo tres situaciones: a) visión normal, b) utilizando una lente (-2 dioptrías); c) utilizando un prisma base externa (2▿) en cada ojo. Se calcularon la sensibilidad y especificidad (como parámetros de la Teoría de la Detección de Señales: TDS).
ResultadosLos análisis ANOVA y TDS revelaron que el deterioro del desempeño visual guardaba una relación directa con la distancia corta y una mayor desviación de la dirección visual, en especial cuando los estímulos se situaban más cerca, y a más de 24° del centro de la pantalla en dextroversión y valores superiores.
ConclusiónEstos resultados respaldan un modelo mixto, que combina un modelo basado en el ángulo visual (relacionado con la visión lejana) y otro basado en el desequilibrio oculomotor (relacionado con la dirección visual). Este modelo mixto podría ayudar a predecir la distribución de las butacas en las salas de cine, que oscila entre aquellas que producen un mayor confort visual y aquellas que producen más molestias visuales. También podría constituir un primer paso para el diagnóstico previo de los trastornos de la visión binocular.
Stereoscopy produces an illusion of depth (3D vision) in a photograph, movie, or other 2D image by presenting a slightly different perspective to each eye.1–3 In the last two decades, the use of stereoscopic devices has become widespread in the fields of entertainment (cinema, television, and video games), medicine (image diagnosis), industry, and science. However, in parallel, some adverse effects of stereoscopy for eye health have been reported.4–6 3D viewing may cause headache, stomachache, motion sickness, confusion, or visual fatigue, although the trigger of these symptoms is unclear. In order to avoid these forms of discomfort when viewing 3D stereo images in movies, posters, pictures, books, and so on, an accurate binocular visual system is required. This involves more than having two eyes working together simultaneously as a coordinated team; accommodations of the lens, bi-convergence and stereoscopic vision have to be coupled.7 However, in the small proportion (below 5%) of the population with severe visual disabilities which make seeing in 3D difficult or impossible,8 these accommodations may be counterproductive: for example, in one-eyed individuals, or people with medical diagnoses of amblyopia (lazy eye) or strabismus (“crossed eyes” or “wandering eyes”).
The main goal of this study is to test two optical-geometrical models for predicting binocular visual fatigue. The models are based on: (1) parameters related to the viewing distance, or (2) parameters related to the visual direction. To assess how the observer's performance decreases as time goes by when watching 3D images, we measured the sensitivity and specificity in a discrimination task involving stereoscopic 3D alphanumerical characters. Clearly, we propose that the loss of sensitivity and specificity in the discrimination task could be used as a correlate of the degree of subjective visual discomfort assessed by the participants in different locations in the cinema. The task was conducted at two viewing distances in a variety of visual directions and under different visual conditions. Note that the different spatial positions in the cinema (i.e., the seats) adopted by the subjects involve changes in conditions of visual observation as well as in extra-retinal factors (i.e., oculomotor factors such as focal distance and visual direction).
The second aim of the study was to assess the influence of accommodative and vergence effort on these parameters by measuring the observer's performance (sensitivity and specificity).
The results of this study may improve our understanding of visual fatigue (asthenopia) when people watch 3D movies. In addition, it may lead to a preliminary diagnosis of the binocular system by detecting visual disabilities watching 3D stimuli from a particular site in the cinema theatre. Therefore, this procedure could contribute to the prevention of visual disturbances and improve eye health.
In order to induce a clear impression of 3D vision, two images with a certain binocular disparity are usually presented dichoptically to the observer. But there are considerable differences between stereo vision in natural conditions and stereoscopic images.2 So, in daily life (assuming that ‘daily’ tasks involve no stereogram viewing), the image is clearly shaped only in the central field of vision, while it is blurry in the peripheral retina. Moreover, under natural viewing conditions, the focal distance for clear vision and distance of binocular convergence of the two eyes coincide in the same spatial location, causing some stability in the 3D vision mechanism. In contrast, when a stereoscopic image is presented on a screen, the vergence and accommodative demands diverge as their binocular disparity increases, thus causing a conflict in the convergence/accommodation relationship.7,9–11 In short, an imbalance is created by the mismatch between convergence and accommodation, caused by the difference between an object's perceived position in front of or behind the display or screen and the real origin of that light. To explore the relationships between convergence and accommodation when people look at stereoscopic images, the notions of Percival's and Sheard's zones of comfort, as well as the zone of clear single binocular vision (ZCSV) have been used.1,10,12,13 However, the search for an objective measurement of observer visual fatigue (asthenopia) due to the uncoupling of the factors inherent in visualization in a cinema remains elusive.
From our two optical-geometrical models (see Appendix for details), we make some predictions with regard to observer-related factors (oculo-motor value ratio and ‘focal distance’/‘convergence distance’ ratio – Df/Dc) and environment-related factors (localization in the cinema). We then examine them empirically in an experiment with a group of participants.
MethodExperimentTo examine the influence of observer position relative to the screen, we designed an experiment in which observer position was kept constant while the lateral position of the 3D alphanumerical targets was systematically varied. Complementarily, in order to see how an additional effort in accommodation and in eye vergence movements affects observer performance in the same discriminative task (3D alphanumerical characters) the subjects were tested under two new conditions: (a) wearing a lens (−2 diopters) on each eye; (b) wearing a base-out-prism (2▿) on each eye. We expected that the greater the angle of deviation of the gaze direction towards the stereo target, the more asymmetrical the degree of contraction of the muscles that control movement of convergence and, consequently, the greater the impairment of task performance. So, the greater the distance from the centerline (eccentric sites), the greater the effort required to perceive the 3D impression and, as a result, the greater the visual discomfort or impairment of the performance. Moreover, we expected the impairment of the performance in the discriminative task to be greater in both artificial conditions, i.e., wearing two lenses or wearing two prisms. Comparing these two test conditions with the baseline (task performed under normal conditions, i.e., without prisms or lenses) we dissociated the contribution of each of the two mechanisms involved in binocular vision (convergence and accommodation), while maintaining binocular disparity constant.
ParticipantsFifteen healthy volunteers (university students) were tested (eight women; age 19–28 years, mean=21.8, standard deviation=2.5). They underwent an optometric eye examination to rule out any type of binocular or accommodative dysfunction and to verify that their refractive error was duly compensated by glasses or contact lenses. Thus, we can exclude that the cause of visual fatigue can be attributed to poor monocular and binocular vision. Subjects gave written informed consent to participate once the nature of the study had been explained to them. The study was approved by the local ethics committee (Bio-ethics committee of the University of Barcelona). The study was conducted in accordance with the Declaration of Helsinki of 1975 (as revised in Fortaleza, Brazil, October 2013).
StimuliWe designed 16 different alphanumeric characters by combining four 4 (letters)×2 (hairline positions)×2 (disparity types), which are shown in Fig. 1 – up shows all of them. The font used was Lucida Console (size 20 points) and the disparity objects were kept constant and equal to 8 pixels for all characters (pixel pitch 0.265mm). This means that, assuming 60mm as inter-pupillary distance, when the stimulus located on the screen was observed at a distance of 50cm, angular disparity was 844.68 arc sec (crossed disparity) and 906.41sec arc (uncrossed disparity) while, when observed from 80cm, the stereo-acuity was 527.91 arc sec (crossed disparity) and 566.62 arc sec (uncrossed disparity). The alphanumeric characters were randomized along a line containing 22 characters. The first alphanumeric character was always located in the primary position of gaze and the remaining characters in dextroversion (rightward gaze). Specifically, the total distance between characters 1 and 22 was 35.6cm.
 used in the discrimination task. The top row of alphanumeric characters is seen as floating in front of the reference plane (crossed disparity), while the lower row of alphanumeric characters is perceived as being behind the reference plane (uncrossed disparity). Lower panel: An piece of a trial of the test with 22 3-D alphanumerical characters. Subjects see them through red/cyan filter glasses. Because of the large extension, in this line there are only twelve of the 24 characters presented in every line of the test.")
Upper panel: 3D Stimuli (anaglyphs) used in the discrimination task. The top row of alphanumeric characters is seen as floating in front of the reference plane (crossed disparity), while the lower row of alphanumeric characters is perceived as being behind the reference plane (uncrossed disparity). Lower panel: An piece of a trial of the test with 22 3-D alphanumerical characters. Subjects see them through red/cyan filter glasses. Because of the large extension, in this line there are only twelve of the 24 characters presented in every line of the test.
A visual test in which the observer had to discriminate a particular 3D alphanumeric character (the target) among other distracting characters by using red-cyan filter glasses was designed. The target was the ‘p’ letter with a hairline below (but not above) it and viewed as floating in front of the screen (crossed disparity). This target was located on the far right of the second row in Fig. 1 up. The distractors were, b, d, q, which appeared with the hairline above or below them, and in front or behind the screen plane, but also the “p” letter in uncrossed disparity and with a hairline above it.
Therefore, by combining 4 (letters)×2 (hairline positions)×2 (disparity types), there were 16 different alphanumeric characters which were randomly distributed along 20 lines (each one with 22 characters) on which the subject performed the task in the 3D bdpq test. So, there were 440 characters to be seen by each observer.
In each trial, only a line with 22 alphanumerical characters was presented on the centre of the computer screen and the participants had to discriminate the 3D alphanumerical character target (see Fig. 1 – lower panel). They were instructed to click on the cell above the 3D alphanumerical character target located on the screen plane (plane of null disparity). Fig. 1, bottom shows a piece of one of the 20 lines that comprised the test. Only two target characters, whose locations were randomized within line, were present in each of the 20 lines. In short, the observer's task was to look at the screen, from left to right, examining the content of each line and checking the box above each target character. The instructions also emphasized that the observer should try to avoid making mistakes, given that the similarity between the features was high.
Apparatus and materialThe stimuli were displayed on a PC (with Intel Core 2 CPU 6420 processor, 2.13GHz) and a 23″ monitor (HP Compaq LA 2306x) with a graphic card Sapphire Radeon X1550 Series 512. The spatial resolution was 1920×1080 pixels and the pixel size was 0.265mm. Stimuli were viewed from distances of 50cm and 80cm and a chinrest with a “bite-board” was used to keep constant this distance and keep the observer motionless. A mouse with two buttons enabled them to respond by clicking on the target stimuli. In order to see the anaglyph (3D alphanumerical characters) a pair of red-cyan filter glasses was used. Finally, two −2 diopter lenses and two 2▿ prisms were used to cause an additional effort in the accommodation and vergence mechanisms respectively. Note that 2 diopters equals 50cm working distance, something similar to what should be done in 3D cinema.
To assess participants’ subjective discomfort, we used a Likert-type scale with the five following questions: (1) Have you had any eyestrain during the tests?; (2) Have you had any headaches during the tests?; (3) Have you had blurred vision during the tests?; (4) Have you had any stress and/or pain in the neck, in the hind-head or in the back?; (5) Make an overall assessment of discomfort or fatigue caused by the test; (6) Were there any other problems and/or sensation you would like to mention? The options for the participants’ responses were: (0) no, (1) very little or little, (2) moderate or fairly, (3) a lot, and (4) very much.
ProcedureThe observer was seated in a chair facing the screen on which the stimuli were presented at a specific distance. The position of the participant relative to the screen was such that the midpoint between the two eyes was aligned with the first letter of each line trial. As a result, the remaining letters were lateralized to the right (in dextroversion). The inter-pupillary distance of the subject was measured.
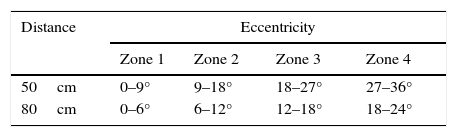
Each participant performed the task individually in the laboratory. Before starting the experiment, they did three training trials. Then, the test was run from two observation distances, 50cm and 80cm. In this way, the visual deviation through the rightmost alphanumeric characters did not exceed 36° (eccentricity) in the case of the 50cm viewing distance and 24° in the case of the 80cm viewing distance. We divided the screen into four zones for every trial presenting one line with 22 letters. The ranges of visual direction deviations for each of the zones of the screen as well as the corresponding viewing distance are shown in Table 1.
We ran the test under three visual conditions: normal, wearing lens, and wearing a prism on each eye. Thus, the observers were tested six times in three sessions (each session took place on successive days) and these conditions were counter-balanced across the participants. To avoid adaptation to the prisms and lenses, after each trial the observer had to remove the glasses and hold them for a few seconds before responding to the next trial. To complete each line of the 3D bdpq test, the subject had 20s (time limited). Thus, the overall test lasted 6.67min, resulting in: 20 (lines)×20 (sec)=400sec.
The questionnaire designed to assess participants’ subjective discomfort (subjective assessment) only was administered twice, at the end of every one of the normal visual condition (50cm and 80cm distance).
Data analysisFrom the application of the test we obtained four proportions of responses for each zone: (1) Hits or true positives, correctly identified relevant elements (H); (2) Misses, or the number of non-recognized relevant elements (M); (3) False alarms, or the number of irrelevant items marked as relevant (FA); (4) Correct rejections, or the number of irrelevant items marked correctly as non-relevant (CR). We then calculated the sensitivity and specificity from these proportions of responses, according to the SDT (Signal Detection Theory) experimental paradigm. Sensitivity (Sv) was calculated according to: Sv=H/(H+M). Specificity (Sp) was calculated according to: Sp=CR/(CR+FA). We also calculate the sensory parameters (d-prime or d’: discriminability of the signal) and the c-criterion for each of the viewing distances and zones of visual direction in the cinema theatre and for each visual conditions and zones.14 Note that d-prime measures how easily target letters can be distinguished from non-target letters, with higher numbers indicating easier discrimination, while the c-criterion relates to the judgement or rule used by the participant in order to make a decision and respond. Thus, participants may choose to be conservative [cautious] or risky [audacious].
Data were submitted to analysis of variance (ANOVA), which allowed comparison of each of these two parameters (Sv and Sp), based on the three test conditions, the two viewing distances and the four visual directions from which the stimuli were observed.
Sensitivity and specificity parameters were analyzed with repeated-measures ANOVAs, taking “visual condition” (normal, with lenses and with prisms), “viewing distance” (50 and 80cm) and “visual direction” (¿1, ¿2, ¿3, ¿4) as within-subject factors. The repeated-measures ANOVA was performed with the Greenhouse–Geisser correction for sphericity departures, which was applied when appropriate. The F value, the uncorrected degrees of freedom, the probability level following correction, and the η2p value (partial square Eta) are reported. Whenever a main effect reached significance, pairwise comparisons were conducted using t tests, and the Bonferroni adjustment was used to control for the increase in type I error. Tests of simple effects were calculated in the presence of a significant interaction.
ResultsSensitivity analysisMeans sensitivity scores were submitted to a repeated-measures ANOVA according to the model: 3(Condition)×2(Distance)×4(Zone). All these variables were taken as repeated measure factors. The ANOVA revealed statistically significant effects of the main factors “Distance” [F(1,84)=11.94; p<0.004; η2p=.460; pow.=.895]; and “Zone” [F(1.142, 15.98)=26.534; p<0.001; η2p=.655; pow.=.999], but not for the factor “Condition” [F(1.84, 25.73)=2.645; p<0.094; η2p=.159; pow.=.460]. The “Condition×Zone” [F(2.148, 30.07)=3.532; p<.039; η2p=.201; pow.=.633] and “Distance×Zone” [F(1.356, 18.99)=10.706; p<.002; η2p=.433; pow.=.930] were also significant. However, neither “Distance×Condition” [F(1.90, 26.62)=2.169; p<.136; η2p=.134; pow.=.394] nor “Distance×Condition×Zone” [F(2.846; 39.84)=1.759; p<.118; η2p=.112; pow.=.412] were significant.
Mean sensitivity scores for 3D targets placed in zones 1, 2 and 3 (m>.960) were greater than for 3D targets in zone 4 (m<.895). Therefore, mean sensitivity scores were impaired for visual directions involving more than 24° degrees in deviation compared to lower deviations (<24°).
Post hoc analysis of the “Condition×Zone” interaction revealed only significant differences in mean sensitivity scores between conditions in zone 4. Therefore, in the case of Zone-4, differences between the ‘normal’ visual conditions compared with the visual conditions using lenses (2 diop.) were significant [t(29)>2.27; p<.031] and also compared with the visual conditions using prisms (2Δ) [t(29)>3.007; p<.005], but not when comparing these visual conditions (lens and prism) [t(29)>742; p<.464]. Fig. 2 – left shows differences in mean sensitivity for the two viewing distances and according to the three visual conditions, but only in zone 4. In brief, lenses and prisms impaired performance, but only when visual directions were greater than 24°. Tables 2 and 3 show mean sensitivity scores for all zones according to the viewing distance and visual condition.
. Right panel: Mean specificity scores of the SDT paradigm for each viewing distance, depending on the zone on the screen. Error bars indicate the standard error. *p<.05 Zone-4 compared to the other zones. Error bars indicate the standard errors of the mean (95% confidence level).")
Left panel: Mean sensitivity scores in the SDT paradigm as a function of the viewing distance and according to the three visual conditions for zone 4. *p<.05 normal visual condition compared to ‘Lens’ and ‘Prism’. Error bars indicate the standard errors of the mean (95% confidence level). Right panel: Mean specificity scores of the SDT paradigm for each viewing distance, depending on the zone on the screen. Error bars indicate the standard error. *p<.05 Zone-4 compared to the other zones. Error bars indicate the standard errors of the mean (95% confidence level).
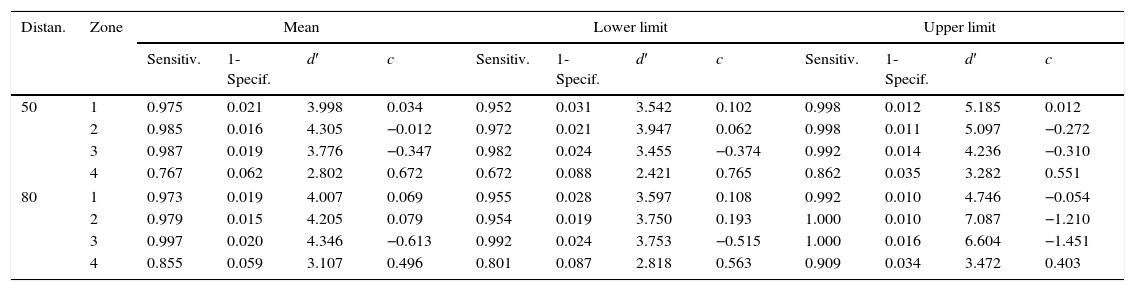
Means in sensitivity, specificity, d′ and c-criterion, and the confidence intervals for each distance and zone in the cinema.
| Distan. | Zone | Mean | Lower limit | Upper limit | |||||||||
|---|---|---|---|---|---|---|---|---|---|---|---|---|---|
| Sensitiv. | 1-Specif. | d′ | c | Sensitiv. | 1-Specif. | d′ | c | Sensitiv. | 1-Specif. | d′ | c | ||
| 50 | 1 | 0.975 | 0.021 | 3.998 | 0.034 | 0.952 | 0.031 | 3.542 | 0.102 | 0.998 | 0.012 | 5.185 | 0.012 |
| 2 | 0.985 | 0.016 | 4.305 | −0.012 | 0.972 | 0.021 | 3.947 | 0.062 | 0.998 | 0.011 | 5.097 | −0.272 | |
| 3 | 0.987 | 0.019 | 3.776 | −0.347 | 0.982 | 0.024 | 3.455 | −0.374 | 0.992 | 0.014 | 4.236 | −0.310 | |
| 4 | 0.767 | 0.062 | 2.802 | 0.672 | 0.672 | 0.088 | 2.421 | 0.765 | 0.862 | 0.035 | 3.282 | 0.551 | |
| 80 | 1 | 0.973 | 0.019 | 4.007 | 0.069 | 0.955 | 0.028 | 3.597 | 0.108 | 0.992 | 0.010 | 4.746 | −0.054 |
| 2 | 0.979 | 0.015 | 4.205 | 0.079 | 0.954 | 0.019 | 3.750 | 0.193 | 1.000 | 0.010 | 7.087 | −1.210 | |
| 3 | 0.997 | 0.020 | 4.346 | −0.613 | 0.992 | 0.024 | 3.753 | −0.515 | 1.000 | 0.016 | 6.604 | −1.451 | |
| 4 | 0.855 | 0.059 | 3.107 | 0.496 | 0.801 | 0.087 | 2.818 | 0.563 | 0.909 | 0.034 | 3.472 | 0.403 | |
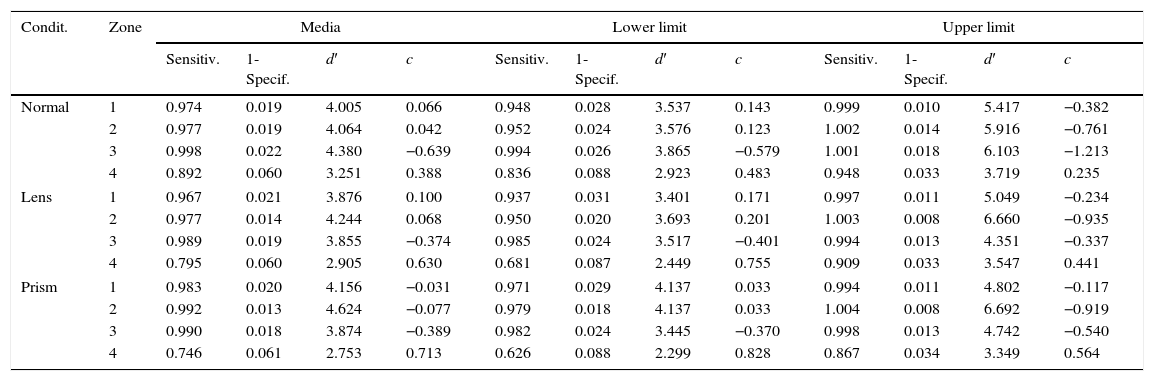
Means in sensitivity, specificity, d′ and c-criterion and the confidence intervals for each visual condition and zone in the cinema.
| Condit. | Zone | Media | Lower limit | Upper limit | |||||||||
|---|---|---|---|---|---|---|---|---|---|---|---|---|---|
| Sensitiv. | 1-Specif. | d′ | c | Sensitiv. | 1-Specif. | d′ | c | Sensitiv. | 1-Specif. | d′ | c | ||
| Normal | 1 | 0.974 | 0.019 | 4.005 | 0.066 | 0.948 | 0.028 | 3.537 | 0.143 | 0.999 | 0.010 | 5.417 | −0.382 |
| 2 | 0.977 | 0.019 | 4.064 | 0.042 | 0.952 | 0.024 | 3.576 | 0.123 | 1.002 | 0.014 | 5.916 | −0.761 | |
| 3 | 0.998 | 0.022 | 4.380 | −0.639 | 0.994 | 0.026 | 3.865 | −0.579 | 1.001 | 0.018 | 6.103 | −1.213 | |
| 4 | 0.892 | 0.060 | 3.251 | 0.388 | 0.836 | 0.088 | 2.923 | 0.483 | 0.948 | 0.033 | 3.719 | 0.235 | |
| Lens | 1 | 0.967 | 0.021 | 3.876 | 0.100 | 0.937 | 0.031 | 3.401 | 0.171 | 0.997 | 0.011 | 5.049 | −0.234 |
| 2 | 0.977 | 0.014 | 4.244 | 0.068 | 0.950 | 0.020 | 3.693 | 0.201 | 1.003 | 0.008 | 6.660 | −0.935 | |
| 3 | 0.989 | 0.019 | 3.855 | −0.374 | 0.985 | 0.024 | 3.517 | −0.401 | 0.994 | 0.013 | 4.351 | −0.337 | |
| 4 | 0.795 | 0.060 | 2.905 | 0.630 | 0.681 | 0.087 | 2.449 | 0.755 | 0.909 | 0.033 | 3.547 | 0.441 | |
| Prism | 1 | 0.983 | 0.020 | 4.156 | −0.031 | 0.971 | 0.029 | 4.137 | 0.033 | 0.994 | 0.011 | 4.802 | −0.117 |
| 2 | 0.992 | 0.013 | 4.624 | −0.077 | 0.979 | 0.018 | 4.137 | 0.033 | 1.004 | 0.008 | 6.692 | −0.919 | |
| 3 | 0.990 | 0.018 | 3.874 | −0.389 | 0.982 | 0.024 | 3.445 | −0.370 | 0.998 | 0.013 | 4.742 | −0.540 | |
| 4 | 0.746 | 0.061 | 2.753 | 0.713 | 0.626 | 0.088 | 2.299 | 0.828 | 0.867 | 0.034 | 3.349 | 0.564 | |
Similarly, a posteriori analysis of the “Distance×Zone” interaction revealed significant differences between “distances” (50 and 80cm), but only if the visual direction (Zone-4) was greater than 28.5 degrees [t(44)>−3.658; p<.001], and not for visual directions (Zones 1, 2, 3) below this value [t(44)>1.387; p<.172].
Specificity analysisParticipants’ mean specificity scores were submitted to the same statistical design for an ANOVA for repeated measures. The ANOVA revealed a statistically significant effect of the main factor: “Zone” [F(1.072,15.01)=15.687; p<.001; η2p=.528; pow.=.966].
Mean specificity scores were significantly lower for 3D targets in zone-4 (m=.94; S.E.=.012) than for the remaining 3D targets. Fig. 2 – right shows this zone effect. Tables 2 and 3 show mean specificity scores for all zones according to the viewing distance and visual condition.
SDT derived parameters analysisParameters derived from SDT such as d′ (discriminability) and c-criterion were computed according to Green & Swets.14Table 2 shows means in sensitivity, specificity, d′ and c-criterion as well as the confidence intervals for each distance and zone. Table 3 shows means in the same parameters for each visual condition and zone. These parameters showed that d′ decrease as the angle for visual direction increase. Particularly in the case where the participants were at shorter distances from the screen (50cm) compared to another farther distance (80cm). In the same line, c-criterion became more conservative as distance increase.
On the other hand, when the participants wore either lens or prisms, the performance decreased. Nevertheless, no significant difference was found between these two enforced visual conditions, as revealed by the confidence intervals. Besides, as angle for visual direction increased (zones 3 and 4) values of c-criterion also changed towards more conservative.
Analysis of subjective discomfortLikert scores in the range 0–4 were computed after completion of the questionnaire designed to assess participants’ subjective discomfort. Fig. 3 shows that only the item “overall fatigue or visual discomfort” attained a moderate value (3–3.5) on the discomfort scale. In item 6, no problems were reported and so it was not analyzed.
Discussion. The participant reported no other problem and/or sensation. Therefore, item 6 was removed. Error bars indicate standard error.")
The aim of the present study was to establish which of two geometrical types of models best predicts visual fatigue in performance (indicating asthenopia) on a test requiring discrimination of 3D characters. Model types 1 were based on parameters derived from viewing-distance (Df, Dc or α). While Model types 2 were based on either the (Df/Dc) ratio, or equivalently the oculo-motor imbalance |β1−β2|.
In order to empirically verify one of these models, we conducted a visual experiment where we analyzed the effects of observation distance (50 and 80cm) and of the visual direction to the 3D target (lateral position of the seat) under three visual conditions (normal, lens and prism), establishing four zones that required different degrees of visual deviation. Statistical analysis involving these factors and using sensitivity as dependent variable revealed that the impairment in performance is significantly higher for the distance of 50cm than for 80cm, particularly for the zone 4 of visual direction (i.e., the d′ (50cm)=2.802 and d′ (80cm)=3.107). Moreover, the SDT analysis also revealed that the observers used a more conservative response criterion for 80cm than for 50cm viewing distance. This result is in agreement with our interpretation of the viewing distance and gaze direction effects. As far as the comparison of the three visual conditions is concerned, the ANOVA for sensitivity shows that the performance in the two artificial visual conditions differed significantly from that in “normal condition”, but no differences were found between the lens and prism conditions. We would expect 3D stereoscopic systems to induce asthenopic symptoms in people with normal binocular vision when the discrepancy between the vergence demand and the accommodation demand is large, but not when it is small. Therefore, it is possible that the diopter power of both the lens and the prism chosen was insufficient to dissociate the relevant ocular factors (accommodation and vergence). Surely, the effects of the lens and prisms on the results there would be more significant if the magnitudes were greater and closer to the saturation limits of the oculomotor system. However, for ethical reasons, we did not want to force participants to make greater efforts in both accommodations and visual vergence. Future research in which the diopter power is increased in both conditions is required.
With regard to the relationship between viewing distance and discomfort in a stereoscopic display, our results are in agreement with those of Shibata et al.13 who examined the effect of viewing distance on discomfort and fatigue. In their experiments, they found that negative conflicts (stereo content behind the screen) were less comfortable at far distances; whilst positive conflicts (content in front of screen) were less comfortable at near distances. Therefore, the relative discomfort seems to depend on the combination between the type of disparity (crossed and uncrossed) and the distance of observation (far or near). Note that in our experiment, the targets always were localized in front of the screen (crossed disparity) and both distances (50 and 80) were close to the screen. However, performance was impaired when the observer was closer to the screen. However, the impact of prisms on the impairment of visual comfort is controversial. Emoto et al.15 conducted an experiment where the participants viewed a stereoscopic film (an operetta adapted for the TV and cinema) through either a fixed or a variable prism for almost an hour, and evaluated over 20 symptoms. They did not find significant differences in subjective symptom ratings between the conditions. In contrast, Lambooij et al.16 had previously conducted similar experiments using fixed and changed prisms and found notable changes in comfort.
It is possible to attribute these discrepancies to the fact that Emoto et al.15 measured the symptoms only at the end of the trial, and not at the beginning, and so had no way of evaluating the changes that had taken place in the meantime. In addition, in Emoto's study only six subjects participated in the experiment and some of them occasionally experienced diplopia. Hoffman et al.10 used a novel 3D stereoscopic display that allowed them to present stimuli (random dot stereograms depicting sinusoidal corrugations in depth) either ‘cue-consistent’ (in which the focal and vergence distances matched at one of three distances) or ‘cue-inconsistent’ in which the focal plane was fixed in the mid distance, and the vergence plane was kept constant. Their results showed that the time required to identify a stereoscopic stimulus decreased and interestingly, the participants’ symptoms were all slightly worse in the cue-inconsistent than in the cue-consistent mode. However, in none of these studies was the observer location relative to the position of the 3D stereoscopic target on the screen studied systematically.
In a later study, Shibata et al.13 expanded their analysis of how vergence–accommodation conflicts in stereo displays affect visual discomfort and fatigue. Examining the effect of the sign of the vergence–accommodation conflict on discomfort and fatigue, they found that negative conflicts (stereo content behind the screen) were less comfortable at longer distances and that positive conflicts (content in front of the screen) were less comfortable at shorter distances.
In short, as far as the gaze direction effect is concerned, our results are in agreement with those of Banks and co-workers (reported in Shibata13) who in another experiment measured phoria and the zone of clear single binocular vision through clinical measurements commonly associated with correcting refractive error. They suggest that these measurements (related to gaze direction) predict susceptibility to discomfort in the 3D stereoscopic experiments. However, we extend this conclusion by claiming that visual discomfort increases as distance and visual direction increase.
With regard to the relationship between vergence demands and discomfort for a stereoscopic display, we found significant differences only when participants looked at zone 4 (with visual directions larger than 18°). These results are in agreement with those of Howarth,4 who hypothesized that discomfort increases the more the vergence demand differs from that of the display plane. Interestingly, however, Howarth4 suggests that the task itself causes increasing discomfort over time. Further research is needed to investigate whether a more prolonged time in performing the 3D attention task would fit this prediction better.
As for the analysis of our participants’ subjective discomfort (on a Likert-type scale), only moderate overall assessments of discomfort or fatigue were reported. Therefore, data of this kind do not seem to be very useful for identifying the causes of visual fatigue and discomfort. However, this result also could be interpreted as an evidence that the task was not very demanding, at least for zone 1 and 2.
We admit that a limitation of this study stems from the fact that we have tried to verify which of two optical-geometric models based on a cinema room 30m (viewing distance)×15m (width of the movie theatre) fits best to data picked up at a laboratory where the viewing distance is 50–80cm. However, we note that the binocular disparity caused by the stimuli was at least 844 arc sec. The range of viewing directions from 0° to 36° is broad. Therefore, considering that the size effects obtained for the two factors are high, one would probably obtain a similar pattern of results by replicating this experiment in larger scenarios.
Another limitation that one could argue to this study comes from the fact that the test was conducted using stationary stimuli, while in cinemas theatres dynamical movies are usually projected. However, we asked the participants for detecting two targets in every one of 20 lines, every one composed of 22 characters. Therefore, this visual searching task also involved dynamic vision.
To sum up, our data show that performance scores change depending on the combination of viewing distances and visual directions (zone). These factors were directly related to the spatial location of the observer in relation to the screen, but are also indirectly related to accommodation and convergence. Thus, our results also show that when the stimulus disparities were well tolerated by the participants, the visual discomfort seemed to be caused by extra-retinal factors (proprioception). In conclusion, this study suggests that the observer's visual direction with regard to the location of the target on the screen (zones of visual direction) in the cinema may be better predicted by the oculomotor imbalance |β1−β2| model. Notice that this model is not independent of the Discomfort ratio (Dc/Df) model, because of proprioception: that is, the effort of the extraretinal muscles of the eye, is also considered by the visual system. Meanwhile, the distance effect, i.e. the effort related to the observer's viewing distance from the screen, could be better predicted by the model based on the subtended visual angle. In the following paragraph we propose an mixed model for predicting asthenopia.
Proposal of a mixed modelFrom a sensory ergonomics approach, movie theatres should be designed according to Fig. 4 – centre, which shows regions of visual comfort/discomfort as predicted by the mixed model described above. This mixed model comprises a model based on the distance to the screen or the size of the target stimulus and another based on the visual direction of the viewer relative to the centre of the screen. Assuming the additivity of these two model equations (see Fig. 4) we can establish the distribution of seats according to the visual comfort or discomfort they produce.
, as a function of the position in the movie theatre, for different choices of the ρ parameter defined in the text. Left: ρ=0.1, middle: ρ=0.5, right: ρ=0.9. As can be seen, small ρ values yield F functions similar to the visual angle itself, while large ρ values result in F forms resembling the oculomotor imbalance. Distances are in m, and angles in degrees.")
Rescaled version of the ‘mixed model’ fatigue F (by applying the rescaling plotted values range from 0 to 1), as a function of the position in the movie theatre, for different choices of the ρ parameter defined in the text. Left: ρ=0.1, middle: ρ=0.5, right: ρ=0.9. As can be seen, small ρ values yield F functions similar to the visual angle itself, while large ρ values result in F forms resembling the oculomotor imbalance. Distances are in m, and angles in degrees.
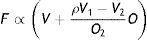
As the most relevant quantities appear to be the oculomotor imbalance δ – which we will now call O – and the visual angle V, let us consider a fatigue function F written as a linear combination F=cOO+cVV=cV(V+cO/cVO), where ‘cO’ must be related to the size effect of the visual direction and ‘cV’ must be related to the distance from the screen. Since changing the value of cV amounts to just redefining the fatigue units, the only key element is actually the cO/cV ratio.
To determine this quotient, it will be enough to consider two points. In particular, we choose the locations (x1, z1)=(0, Z0), ---front-centreline--- and (x2, z2)=(W/2, Z0−L) --- back-right corner ---. Then,
which are further simplified after observing that O1=O(x1, z1)=0. These relations are interpreted as a system of two linear equations for the two unknowns cO, cV. After solving it we obtain co/cv=(F2V1/F1−V2)/O2. Therefore, introducing the fatigue ratio ρF2/F1, and omitting global factors, F can be rewritten in the form: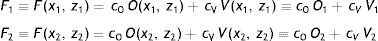
Obviously, this function will have different forms depending on the value of ρ, i.e., on the subjective assessment ratio between fatigue at point 2 and fatigue at point 1. Fig. 4 shows F for ρ=0.1, 0.5, 0.9.
ConclusionsIn conclusion, this study suggests that the observer's visual direction with regard to the location of the target on the screen (zones of visual direction) in the cinema may be better predicted by the oculomotor imbalance |β1−β2| model. Notice that this model is not independent of the Discomfort ratio (Dc/Df) model, because of proprioception: that is, the effort of the extraretinal muscles of the eye, is also considered by the visual system. Meanwhile, the distance effect, i.e. the effort related to the observer's viewing distance from the screen, could be better predicted by the model based on the subtended visual angle. Finally, we propose to combine the two single models in a mixed model for predicting asthenopia.
Further research is needed in order to verify the additivity of the mixed model that we have provisionally assumed here. But the question of asthenopia in children who watch stereoscopic cinema (3D) should also be investigated in greater depth. It is particularly important to examine how the factors mentioned here cause visual discomfort, because viewing conditions (distance and visual direction) may worsen dysfunctions such as strabismus, phorias, amblyopia and anisometropia.
This work was funded through a grant awarded by the Spanish Ministry of Economy and Competitiveness (MINECO) to J.A. Aznar-Casanova (reference PSI2012-35194).
We sought to examine the effects of observers’ positions on the vergence and accommodation efforts they make when fixating their gaze on a stimulus located at the centre of a screen in a traditional cinema hall while watching a 3D movie. We assumed that the size of the 3D cinema hall was 30m x 15m (length×width). Seats were distributed as follows: (a) the first row is 5m from the screen (leaving 25m for the other rows); (b) the distance between one row and the next is 1m; (c) within each row, neighbouring seats are 0.5m apart; (d) each seat is located by two coordinates, e.g., row and column, or, when using polar coordinates: distance and angular direction from seat centre to screen centre; (e) we assume that the target stimulus is presented at the centre of the screen and has an object disparity of ▿obj=0.03m, while the mean inter-pupil distance of viewers is IPD=0.062m.
Here we briefly outline how to compute the values of the factors involved in a geometrical model for quantifying visual fatigue as a function of the observer's location, which leads to performance degradation in visual discrimination tasks.
Fig. A.1 displays the observer-stimulus relations established (based on simple geometry) when viewing a stereogram at the centre of a screen. Our notation indicates d=▿obj/2, I=IPD/2. The stereogram under study may be regarded as part of a 3D movie. β1 and β2 are the angles formed by the gaze directions and the interocular line, taking the arcs on the same side as the optical axis (right side for β1, left side for β2). Their senses are indicated by the small arrows in Fig A.1 – A. It has been assumed that observers can freely rotate their heads or bodies until they achieve (what we deem to be) the most comfortable position: namely, faces perpendicular to the lines from themselves to the object, i.e., noses pointing at the screen centre. Then, as the β1 and β2 angles become equal, the oculomotor imbalance between the two eyes vanishes.
, relative to a screen in a 3D cinema. The X coordinate goes along the screen itself, Z is perpendicular to X, and the origin 0 is set at the screen centre, which is also the centre of the stereogram. Note that d=▿obj/2, I=IPD/2. The left panel (A) shows the case of an observer who remains still but moves his/her eyes, whilst the right panel (B) shows the case of an observer moving his/her head towards the screen.")
Optical-geometrical relations for a given observer located at (X, Z), relative to a screen in a 3D cinema. The X coordinate goes along the screen itself, Z is perpendicular to X, and the origin 0 is set at the screen centre, which is also the centre of the stereogram. Note that d=▿obj/2, I=IPD/2. The left panel (A) shows the case of an observer who remains still but moves his/her eyes, whilst the right panel (B) shows the case of an observer moving his/her head towards the screen.
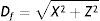
In these coordinates, the focal distance reads:
For the case of crossed disparity (the one shown in Fig. A.1), after obtaining the coordinates (xc, zc) of the convergence point in terms of X, Z, d, I, we can find
and express it as a function of these variables. We now evaluate the Dc/Df ratio, which turns out to bewhere Df is given by Eq. (1). To study uncrossed disparity instead of crossed disparity, it is enough to change d↔−d in all the expressions.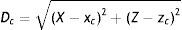
As people turn their heads and/or bodies to equalize the viewing angle between eyes (Fig A.1)…
and the vergence angle, say γ, is therefore γ=π−2β.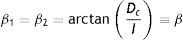
Fig. A.2 left-up and middle, respectively, shows heat maps depicting focal distance and vergence angle values for every cinema position (X and Z coordinates on horizontal and vertical axes respectively).
 and vergence γ (middle panel) as functions of the observer's location in the cinema theatre. Heat map for the visual angle subtended by the target stereogram as a function of the observer's position in the cinema (down panel). Distances are in m, and angles in degrees. Right panel: upper panel: Heat map for the Dc/Df ratio as a function of the observer's location in the cinema theatre. Lower panel: Heat map for the oculomotor imbalance |β1−β2| as a function of the observer's location in the cinema of Figs. 2–4, for a situation in which the interocular line is kept parallel to the screen (the case of cross-disparity). Distances are in m, and angles in degrees.")
Left panel: Heat maps for focal distance Df (up panel) and vergence γ (middle panel) as functions of the observer's location in the cinema theatre. Heat map for the visual angle subtended by the target stereogram as a function of the observer's position in the cinema (down panel). Distances are in m, and angles in degrees. Right panel: upper panel: Heat map for the Dc/Df ratio as a function of the observer's location in the cinema theatre. Lower panel: Heat map for the oculomotor imbalance |β1−β2| as a function of the observer's location in the cinema of Figs. 2–4, for a situation in which the interocular line is kept parallel to the screen (the case of cross-disparity). Distances are in m, and angles in degrees.
Alternatively, it is possible to envisage another model by relating the locus of the observer in the cinema room to the stimulus retinal size (visual angle subtended by the image, henceforth referred to as α). Indeed, the viewing distance may have an impact on the observer's performance, because the greater the distance from the observer to the screen, the smaller the α. Fig A.2 left-down shows the space variation of α.
On the basis of the space variations of these magnitudes, we generate other plots with the aim of predicting visual discomfort or impairment of the observer's performance. The ratio between vergence distance (Dc) and focal distance (Df), shows the relation between convergence and accommodation when watching the stereogram at the centre of the screen. Examining the Dc/Df ratio as a function of the position of each seat (row and column), it is possible to predict the extent of visual discomfort. Fig A.2 right-upper panel displays the convergence/accommodation ratio values according to a given colour scale.
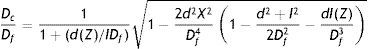
So far, we have imagined that the viewers rotate freely and finally adopt an attitude with null imbalance, i.e., β1=β2 as displayed in Fig A.1. However, for other purposes (e.g., experiment design) it may be of interest to study cases in which the observers are subject to some form of constraint. In particular, we might imagine that all the viewers have to keep their faces parallel to the screen, i.e., interocular lines always parallel to the X-axis (or nose perpendicular to the screen). It is then obvious that, except for locations on the centre line itself, one has β1≠β2. For this reason, it is now important to consider the magnitude of the imbalance |β1−β2| as an indicator to predict discomfort. In this set-up, and for the case of crossed disparity,

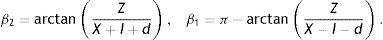
Again, the case of uncrossed disparity is obtained by replacing d↔−d in the resulting expressions. Interestingly the Dc/Df ratio in these conditions, given by Eq. (A.5), is independent of spatial location. Note that for X=0 and Z=Df, ratio (Eq. (A.3)) coincides with ratio (Eq. (A.5)), as expected. With the help of formulas (Eq. (A.6)), the oculomotor difference |β1−β2| is evaluated as a function of X, Z in the same cinema (see Fig. A.2 right-lower).
The measures based on the Dc/Df and |β1−β2| magnitudes are likely to be related, because both involve extraretinal factors. Oculomotor efforts are responsible for vergence movements (Dc) and ciliary muscle fatigue is responsible for accommodation (Df).
From these two types of optical-geometrically based models we can derive some predictions, which will be related to the location occupied by the observer in the cinema theatre and to the effort required of the extra-retinal muscles for both accommodating and converging the gaze of the two eyes, and also to the retinal size of the stimulus (subtended visual angle). Thus, when the observer is seated in an eccentric site in the cinema or when the image target was in an excessively lateralized visual direction, there may be visual fatigue or impaired performance. In addition, the farther the observer is placed from the screen, the lower the performance, due to the effort made when operating on smaller stimuli.
The authors have no conflicts of interest to declare.


