


The aim of this cross-sectional observational study was to measure habitual viewing distance with smartphones in individuals of different ages, and to identify factors influencing viewing distance.
MaterialGender, reading position, forearm length, ametropia, correction modality, and near vision quality were investigated as factors affecting viewing distance. Participants were asked to read a typical text message on their own smartphone, while sitting and standing. A total of 233 subjects (129 females and 104 males), aged from 16 to 90 years old, were included and divided in two groups: 131 non-presbyopes (median 21.1, range 16 − 39), and 102 presbyopes (median 54.5, range 42 − 90).
ResultsMean viewing distance was 36.1 ± 7.2 cm while sitting, and 37.4 ± 6.8 cm while standing (P < 0.05), and 36.8 +/- 6.6 cm overall. The average viewing distance was 35.0 ± 6.4 cm in non-presbyopes, and 39.0 ± 6.1 cm in presbyopes (P < 0.05). The average viewing distance was 34.7 ± 6.2 cm in females, and 38.2 ± 6.3 cm in males (P < 0.001).
ConclusionsSignificant differences between males and females were observed, due to the different average body size between the two gender groups. Average viewing distance with smartphones in presbyopes matched approximately to the typical near reading distance of 40 cm. In the non-presbyopic group, the accommodative demand when reading a smartphone was slightly higher than in the presbyopic group. High variability was observed in both age groups, without a statistically significant correlation with other assessed factors as reading position, ametropia, correction modality, and near vision quality.
The use of handheld devices for both professional and non-professional activities has become ubiquitous in modern society globally.1 Individuals of all ages use handheld electronic devices (e.g., smartphones and tablets) for written communication (e.g., text messaging, e-mail) and Internet access. This is resulting in the replacement of hardcopy printed materials as electronic devices have become an integral part of daily life.2 New technologies and the increasing use of digital media are changing the postural and behavioral patterns of people, resulting in a variety of viewing styles and body postures among smartphone users.3–5
In most advanced economies, smartphones have been widespread among young adults for years, but in recent years there has been significant growth in tech adoption also among the older generation, and the age gap in smartphone ownership has been closing since 2015. In the U.S. the ownership rate among the 50-and-older age group has risen from 53% to 67% from 2015 to 2018. Similar trends can be observed in Europe, where smartphone ownership among older populations (> 50 years old) is growing, ranging now from 35% in Poland to 64% in Germany (48% in Italy).6
Due to the reduction in the amplitude of accommodation with age, people of different ages experience different visual problems when using smartphones.7 However, little is known about the prevalence and determinants of difficulties related to the use of smartphones in the setting of presbyopia.8 The traditional near point for optometric examinations is 40 cm (16 in. in the U.S.),9because it is considered a typical reading distance for paper media. Usually, this distance is also used for the determination of the reading addition. It has not yet been clearly established whether this reading distance can be applied also to the new handheld electronic devices. To the best of our knowledge, no studies have yet reported viewing distance with smartphones in a wide age range sample of the European population.
The aim of this cross-sectional, observational study was to measure habitual viewing distance in individuals of different ages using smartphones, and to identify factors influencing viewing distance in young adults (age < 39) and people in presbyopic age (> 40). Gender, reading position, forearm length, ametropia, correction modality, and near vision quality were investigated as factors potentially having an effect over viewing distance of smartphones.
MethodsThe study was approved by the local ethical committee and performed in agreement with the tenets of the Declaration of Helsinki. Participants were recruited among students of IRSOO (Institute for Research an Study in Optics and Optometry) and UNIFI (Degree Course in Optics and Optometry, University of Florence), their parents, relatives and friends. Inclusion criteria were to agree to participate, to have and habitually use a smartphone, and no ocular pathology. Subjects wore their habitual refractive correction (either spectacles or contact lenses) and they were asked to read a typical text message on their own personal phone. The distance from the smartphone to their corneal vertex was measured using a tape measure to the nearest millimeter. In order to explore different postures, in all participants the measurements were taken twice in both the sitting and standing position. The accommodative demand of the two reading positions was considered different when exceeding a ±0.25 D difference. To the extent that it was possible, all the effort has been made to ensure the most natural posture. For this reason subjects were informed about the nature of the study only after the measurements. Before recording their data, all participants were fully informed of the purpose of this study and signed a consent form. Then they completed a questionnaire about their age, gender, and ocular pathology history. If a subject was wearing spectacles, the operator measured his/her habitual correction and recorded far and near power (if different). If older than 40 years, they completed also the Italian version of the Near Activity Visual Questionnaire (NAVQ).10,11 According to the criterion defined by Buckhurst and colleagues,10 a total score of 44.25 or greater (range 0–100) yielded to consider the individual as having near vision difficulties.
The vergence of any viewing distance represented the corresponding accommodative demand, and it was calculated as follow:
where K is the vergence in diopters (D) and d is the viewing distance in meters. The accommodative demand was the difference between the inverse of distances, and limits of clinical relevance were set at a 0.25 D. Differences in vergence may be more clinically relevant than differences in distances. However, similar studies about this topic usually report results in centimeters, so we have determined to maintain both units, where possible.Since a person's arm length is expected to influence reading distance, the distance between the elbow and the middle knuckle (Harmon distance)12 was measured, and the normalized or relative viewing distance 13,14 was calculated as:
Smartphone viewing distances was measured in 237 subjects. None of the participants denied consent; four of them were excluded due to reported ocular pathology. A total of 233 (129 female) subjects, aged from 16 to 90 years old, were included in the study and divided in two group: 131 participants (median 21.1, range 16 − 39 years old) in the non-presbyopic group, and 102 (median 54.5, range 42 − 90 years old) in the presbyopic group.
Statistical analysisStatistical power of the study was calculated15 in order to evaluate the achieved power of the generated results in this study. Calculations were performed assuming a two-sided level of significance of α = 0.05 and the achieved effect size of the primary outcome.
The normalcy Kolmogorov-Smirnov test was used and the distribution was considered normal if P > 0.05. Differences between means for samples with normal distribution were explored with a Student t-test or a paired t-test. Conversely, the non-parametric Mann-Whitney test was used for those samples in which the hypothesis of normality was rejected. Differences between more than two unrelated and independent groups were tested with the one-way analysis of variance (ANOVA). Linear regression and Pearson correlation coefficients were calculated to assess the relationship between viewing distance and continuous variables, such as age and Harmon distance. Results were considered statistically significant if P < 0.05. Statistical analyses were performed using MedCalc for Windows, version 19.0.6 (MedCalc Software, Ostend, Belgium).
ResultsOverall mean Harmon distance was 35.4 ± 3.2 (95% CI: 35.0–35.8) cm. Overall mean viewing distance was 36.8 ± 6.6 (95% CI: 35.9–37.6) cm, resulting in an accommodative demand of 2.72 D. Mean viewing distance was 36.1 ± 7.2 (95% CI: 35.2–37.1) cm while sitting and 37.4 ± 6.8 (95% CI: 36.5–38.3) cm while standing (paired t − test P < 0.05), resulting in an accommodative demand of 2.77 D and 2.67 D, respectively. For 47% of participants the difference between viewing distance while sitting and standing was below 0.25 D and, therefore, clinically not relevant. On the other hand, 36% of the studied sample held the smartphone closer while sitting and 17% closer while standing. Bland-Altman plot showed the 95% limits of agreement range from -0.95 to 1.21 D in the non-presbyopic group (Fig. 1) and from -0.54 to +0.74 D in the presbyopic group (Fig. 2). The accommodative demand was greater while sitting in both age group (mean differences: 0.13 D and 0.10 D in the non-presbyopic and presbyopic group respectively). Although the differences of mean were statistically significant, they were smaller than 0.25 D, hence not clinically relevant. As such, the average of the two measurements was considered for subsequent analysis.


As shown in Fig. 3, the average viewing distance was 35.0 ± 6.4 (95% CI: 33.9–36.1) cm in the non-presbyopic group, and 39.0 ± 6.1 (95% CI: 37.8–40.2) cm in the presbyopic group (independent samples t-test P < 0.05), resulting in an accommodative demand of 2.86 D and 2.56 D, respectively. A high between-individual variability was found in both age groups: 95% of observations (mean ± 1.96 SD) lied between 22.9 cm (4.37 D) and 47.3 cm (2.31 D) in non-presbyopic group, and between 26.4 cm (3.79 D) and 51.8 cm (1.93 D) in presbyopic group. The relationship between viewing distance and age can be described by the linear regression equation: viewing distance = (0.124 * age) + 32.49. Viewing distance showed a weak but significant correlation with both age (r = 0.32, P < 0.001) (Fig. 4) and Harmon distance (r = 0.31, P < 0.001) (Fig. 5). The average viewing distance was 34.7 ± 6.2 (95% CI: 33.6–35.7) cm in females, and 38.2 ± 6.3 (95% CI: 38.3–40.7) cm in males (independent samples t-test P < 0.001), resulting in an accommodative demand of 2.88 D and 2.62 D, respectively.
 and accommodative demand (b) in young adult group and presbyopic group. The central box represents the values from the lower to upper quartile (25 to 75 percentile). The middle line represents the median. The vertical line extends from the minimum to the maximum value, excluding outside and far out values.")
Box-and-whisker plot comparing viewing distances (a) and accommodative demand (b) in young adult group and presbyopic group. The central box represents the values from the lower to upper quartile (25 to 75 percentile). The middle line represents the median. The vertical line extends from the minimum to the maximum value, excluding outside and far out values.
 in function of age.")

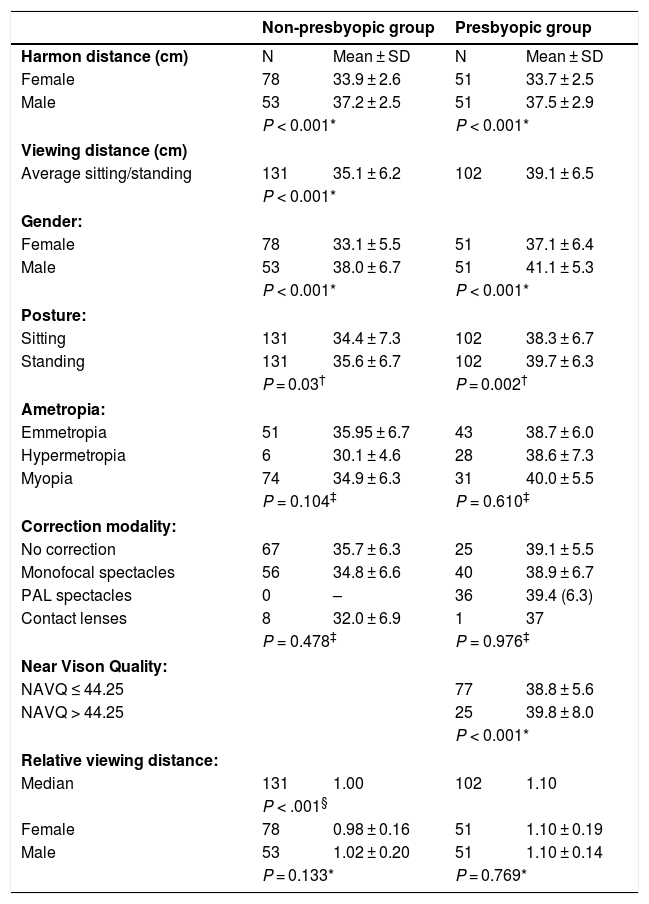
Regarding the statistical analysis of the results, as determined by the obtained effect size of the primary outcome, post hoc power was 0.99. The large sample size permitted stratification for gender, reading position, ametropia, correction modality, and NAVQ score. Results are summarized in Table 1.
Summary table of Harmon distance and viewing distances in non-presbyopic group and presbyopic group, stratified for gender, posture, ametropia, habitual correction, and near vision quality. Relative viewing distance is calculated as the ratio between viewing distance and Harmon distance.
| Non-presbyopic group | Presbyopic group | |||
|---|---|---|---|---|
| Harmon distance (cm) | N | Mean ± SD | N | Mean ± SD |
| Female | 78 | 33.9 ± 2.6 | 51 | 33.7 ± 2.5 |
| Male | 53 | 37.2 ± 2.5 | 51 | 37.5 ± 2.9 |
| P < 0.001* | P < 0.001* | |||
| Viewing distance (cm) | ||||
| Average sitting/standing | 131 | 35.1 ± 6.2 | 102 | 39.1 ± 6.5 |
| P < 0.001* | ||||
| Gender: | ||||
| Female | 78 | 33.1 ± 5.5 | 51 | 37.1 ± 6.4 |
| Male | 53 | 38.0 ± 6.7 | 51 | 41.1 ± 5.3 |
| P < 0.001* | P < 0.001* | |||
| Posture: | ||||
| Sitting | 131 | 34.4 ± 7.3 | 102 | 38.3 ± 6.7 |
| Standing | 131 | 35.6 ± 6.7 | 102 | 39.7 ± 6.3 |
| P = 0.03† | P = 0.002† | |||
| Ametropia: | ||||
| Emmetropia | 51 | 35.95 ± 6.7 | 43 | 38.7 ± 6.0 |
| Hypermetropia | 6 | 30.1 ± 4.6 | 28 | 38.6 ± 7.3 |
| Myopia | 74 | 34.9 ± 6.3 | 31 | 40.0 ± 5.5 |
| P = 0.104‡ | P = 0.610‡ | |||
| Correction modality: | ||||
| No correction | 67 | 35.7 ± 6.3 | 25 | 39.1 ± 5.5 |
| Monofocal spectacles | 56 | 34.8 ± 6.6 | 40 | 38.9 ± 6.7 |
| PAL spectacles | 0 | – | 36 | 39.4 (6.3) |
| Contact lenses | 8 | 32.0 ± 6.9 | 1 | 37 |
| P = 0.478‡ | P = 0.976‡ | |||
| Near Vison Quality: | ||||
| NAVQ ≤ 44.25 | 77 | 38.8 ± 5.6 | ||
| NAVQ > 44.25 | 25 | 39.8 ± 8.0 | ||
| P < 0.001* | ||||
| Relative viewing distance: | ||||
| Median | 131 | 1.00 | 102 | 1.10 |
| P < .001§ | ||||
| Female | 78 | 0.98 ± 0.16 | 51 | 1.10 ± 0.19 |
| Male | 53 | 1.02 ± 0.20 | 51 | 1.10 ± 0.14 |
| P = 0.133* | P = 0.769* | |||
SD = Standard Deviation; CI = Confidence Interval; ANOVA = Analysis of Variance; PAL = Progressive Addition Lens; NAVQ = Near Activity Vision Questionnaire.
This observational study analyzed several features that might influence the viewing distance of smartphones in people of different ages.
Smartphone viewing distances were measured in two natural positions, sitting and standing, and great within-individual and between-individual variability was observed. The results of the present study are in line with those reported by Liang and Hwang,4 who observed behaviors and postures of smartphone users on public transports and identified a total of 25 and 9 combinations of body postures for sitting and standing, respectively. Moreover, in presbyopes a within-individual variability (range from -0.54 to +0.74 D) similar to that of non-presbyopes (range from -0.95 to 1.21 D) was observed. This means that the mean viewing distance do not represent the only functional working distance and the same person can hold the smartphone at different distances while sitting or standing.
The average distance in females (34.4 cm) was significantly shorter than males (39.8 cm). However, after normalization, relative viewing distance was not different between females and males (1.03 and 1.07 respectively, P = 0.06), that means that the difference in distance was not due to a different posture, but only to Harmon distance: on average, females have shorter forearm and so the viewing distance is consequently shorter.
Refractive error and correction modalities had no statistically significant effects on smartphone viewing distance, neither in young adults nor in presbyopes. Hartwig et al.,16 in a cohort of 14 myopic and 16 non-myopic young adults, found a positive correlation between mean spherical equivalent and book reading distance (r = 0.41; P = 0.025). Similarly, in the study of Wu et al.,17 higher prevalence of myopia was associated with shorter near work distance. On the contrary, in the study of Pärssinen and Kauppinen,18 a shorter reading distance was related with higher myopia among females only in childhood but not in adulthood, while among males, the correlation at the adulthood follow-up was negative. These authors concluded that it is difficult to determine whether the association between shorter reading distance and higher myopia, found in some study, has any causal relationship with myopic progression. Our results are in line with these findings.
On average, participants in the presbyopic group held smartphones at greater distance than younger adults. The difference was 4 cm and causes a change of 0.29 D in the accommodative demand, which is at the limits of clinical relevance.
Lan et al.19 examined the effect of age on 207 Chinese subjects between 16 and 74 years of age. With a comparable age range, they found a correlation between smartphone viewing distance and age similar to the one reported in the present study. Nonetheless, the mean viewing distance was 2.8 cm smaller, with both cultural (different characters) and anthropometric factors (different average body size between Italian and Chinese population) that could contribute to such difference.
In our sample, 75% of the presbyopes (77/102) were mostly satisfied with their habitual correction and had no significant symptoms in near vision (NAVQ score < 44.25). In NAVQ there is a specific question asking “How much difficulty do you have seeing the display & keyboard on a mobile or fixed telephone?”: 84% (65/77) of satisfied subjects declared no difficulties, while only 1.2% (3/25) of unsatisfied subjects declared no difficulties in the use of their telephone. In presbyopes, the habitual position might be influenced by the add they used, however the mean smartphone viewing distance of symptomatic participants was only about 1 cm longer than asymptomatic: a difference which is not clinically relevant, since at these distances it corresponds only to 0.1 D of difference in accommodative demand. It is possible that presbyopes having difficulties reading their smartphones would compensate by adjusting screen brightness and font size, instead of changing their usual viewing distance, but this issue was not investigated in this study.
The analysis of relative viewing distance showed that young adults held their smartphone at their Harmon distance, while the older adults held it at a 10% longer distance.
Bababekova et al. 1measured both font size and viewing distance while individuals were using handheld electronic devices. The age range for the study sample was 19–40 years old. The mean working distance for text messages and Internet viewing was 36.2 cm and 32.2 cm, respectively. The authors concluded that changes in the design of ophthalmic lenses (particularly for the correction of presbyopia) might be required to facilitate these modern visual demands. Ophthalmic lens manufacturers are very interested in this topic, in order to develop appropriate ophthalmic corrections for presbyopic people using smartphones. Paillé et al.5 settled a study in order to develop occupational lenses to offer the wearer optimal visual and postural comfort. Twenty-two subjects participated in their study, and the average age was 36.2 (with a range of 22–51). Authors declared that, since the goal was to collect reference data, only three subjects with presbyopia were included in the study. In their study, the mean distance from the screen was 33.8 cm for the smartphone (SD 5.1 cm). The results of the present study (35.1 cm in non-presbyopic group) are intermediate compared to those of Bababekova (36.2 cm for text messages) and Paillé (33.8 cm), but do not support the necessity of changes in the design of ophthalmic lenses, because the average viewing distance of smartphones in the presbyopic group (39.1 cm) matched approximately to the standard near reading distance of 40 cm. This was true both for those who were satisfied with their near correction (38.8 cm), and for those who were dissatisfied (39.8 cm) and who probably needed to update their prescription. Even if differences between the two age groups are small, the analysis of our results showed that it is not possible to extrapolate data from a study group composed only of young people to a presbyopic population.
This study has some limitations. A very simple method of distance measurement was employed. In recent years, wearable devices20,21 and apps22 were developed for real-time monitoring of near-work distance. This methods may results in a more accurate analysis of subjects’ behavior, but need to be installed on the device or to be worn by the subject, being more invasive, time-consuming, and expensive. In the present study, it was not verified whether subjects’ habitual correction was up to date, however near vision quality was tested with a questionnaire. Some authors observed that screen size affects viewing distance and the smaller is the screen, the closer is the distance of use.5 Since the main focus of the study was to explore differences induced by presbyopia on the habitual smartphones viewing distance, we have not performed a comparison of smartphones viewing distance with other handheld digital devices, as tablets and e-book readers, or paper media. Furthermore, participants were only tested while reading text messages, even though smartphones are used for several activities, like consulting emails and social networking, Internet surfing, watching videos, reading e-books, and playing video games. It must be considered that the viewing distances may change for the same person depending on the activity.1 Lastly, smartphones can be used in a wide range of everyday situations, not only standing and sitting, but also lying in a bed. According to the Ipsos Tech Tracker 2012 study,23 the three main locations in which tablets are used are: the living room (92%), the bedroom (65%) and the kitchen (47%). It can be assumed that in the bedroom people are probably lying down,5 yet we did not measure viewing distance in this position, because measurements were performed mostly outside of home.
ConclusionsAverage viewing distance of smartphones in presbyopes matched approximately to the standard near reading distance of 40 cm. In the non-presbyopic group, the accommodative demand when reading a smartphone resulted 0.29 D higher than in the presbyopic group. High variability was observed in both age groups, without relationship with other assessed factors as reading position, ametropia, correction modality, and near vision quality.
Conflict of interestNone.
I would like to acknowledge the students who participated in this research and who involved their relatives and friends. Special thanks to Catia Angiletta, Lucia Beneduce, Eirini Konstantinoudi Athanasiadou, and Noemi Ponzecchi for their assistance in data collection and transcription.


