
To investigate the relationship between tear ferning patterns (TFP) and non-invasive tear break-up time (NIBUT) in normal Asian subjects.
MethodsOne hundred and forty-five adults with no ocular surface disorders were recruited. TFP and NIBUT were determined. Tears were collected using a capillary tube and allowed to air dry at room temperature for 10min. TFP was later observed using a light microscope and classified according to Rolando's classification. Measurement for NIBUT was obtained using a Tearscope with the slit lamp magnification.
ResultsIt was found that there is no significant difference between gender in TFP (Z=−1.77, P>.05) and NIBUT (Z=−1.475, P>.05). There is also no significant difference between Malay, Chinese, Indian, and other races in TFP, (H(3)=4.85, P>.05) and NIBUT (H(3)=2.18, P>.05). However, there is a significant difference between age groups of 20–29, 30–39, 40–49,and 50–60 years old in both TFP (H(3)=28.25, P<.01) and NIBUT (H(3)=36.50, P<.001). Spearman's correlation showed there was a significant relationship between TFP and NIBUT (r=−0.55, P<.001), age and NIBUT (r=−0.50, P<.001), age and TFP (r=0.41, P<.001), McMonnies score and NIBUT (r=−0.40, P<.001), McMonnies score and TFP (r=0.31, P<.001), as well as age and McMonnies score (r=0.52, P<.001).
ConclusionTFP and NIBUT was age dependent but not gender and race dependent. Older subjects had higher grade of TFP and McMonnies questionnaire score but lower NIBUT value. TFP and NIBUT can be used to assess the tear film quality.
Investigar la relación entre los patrones del test de Ferning (TFP) y el test de rotura lagrimal no invasivo (NIBUT) en sujetos asiáticos normales.
MétodosSe incluyó a ciento cuarenta y cinco adultos, sin trastornos en la superficie ocular. Se calcularon el TFP y el NIBUT. Se recolectaron lágrimas utilizando un tubo capilar, dejándose secar a temperatura ambiente durante diez minutos. Se observó posteriormente el TFP utilizando un microscopio óptico, clasificándose el patrón mediante los criterios de Rolando. La medición del NIBUT se obtuvo utilizando el Tearscope, con imagen ampliada en el biomicroscopio.
ResultadosSe comprobó que no existen diferencias por sexo en relación a TFP (Z=-1,77, p>0.05) y NIBUT (Z=-1,475, p>0,05). Tampoco existen diferencias significativas entre las razas Malaya, China, India y demás en relación a TFP, (H(3)=4,85, p>0,05) y NIBUT (H(3)=2,18, p>0,05). Sin embargo, existe una diferencia considerable entre los grupos de edad de 20-29, 30-39, 40-49 y 50-60 años tanto en relación a TFP (H(3)=28,25, p<0,01) como a NIBUT (H(3)=36,50, p <0,001). La correlación de Spearman reflejó una relación significativa entre TFP y NIBUT (r=-0,55, p<0,001), la edad y NIBUT (r=-0,50, p< 0,001), la edad y TFP (r=0,41, p<0,001), la puntuación de McMonnies y NIBUT (r=-0,40, p<0,001), la puntuación de McMonnies y TFP (r=0,31, p<0,001), y la edad y la puntuación de McMonnies (r=0,52, p<0,001).
ConclusiónTFP y NIBUT dependen de la edad, pero no del sexo ni la raza. Los sujetos de mayor edad reflejaron un grado superior de TFP y de puntuación del cuestionario de McMonnies, pero un valor inferior de NIBUT. TFP y NIBUT pueden utilizarse para evaluar la calidad de la película lagrimal.
The pre-ocular tear film (POTF) plays an important role in preserving and optimizing the visual quality and maintaining the health of the ocular surface. Most studies have focused on the relationship between the tear film stability, tear composition, tear quality, and different types of test for tear evaluation.
Tabbara and Okumoto1 as well as Rolando2 proposed the use of tear ferning patterns to evaluate tear quality. Tear fluid, when dried on a microscope slide, produces a specific ferning pattern, which is due to an interaction between various electrolytes in the tears and macromolecules such as proteins.3 An increased salt concentration in tears and other changes in tear composition may cause an alteration in the ferning patterns observed.4
Rolando2 identified dissimilarity among tear ferning patterns and presented a classification system, which has become a useful diagnostic tool in tear ferning studies. It has been classified into four qualitative categories, which are based on the size, the appearance and density of the ferns observed. Rolando noted that normal tear film often showed a type I pattern (with lots of ferns and tightly packed together) or type II pattern (abundant ferning but with spaces in between them), whereas type III (reveals scarce or single ferns) and type IV (absence of ferns) demonstrated poor tear ferning patterns.
The introduction of NIBUT test allows us to examine tear stability without involving a foreign substance into the tear film. It helps to overcome the limitations in fluorescein break-up time where touching of the fluorescein strip to the conjunctiva can stimulate reflex tearing. Although there are certain fluorescein strips designed specifically for fluorescein break-up time (FBUT) test and are claimed to deliver only minimum amount of fluorescein without stimulating reflex tearing, yet the presence of fluorescein in the tears possibly also changes the tear film properties and tear stability. NIBUT measurements are longer than fluorescein breakup time5 and it is believed to be more patient-friendly, repeatable, and precise.6
NIBUT test reflects tear stability and quality. It is a commonly used test in the diagnosis of dry eye. Conversely, tear ferning is relatively uncommon test but is has been a useful and comparable test to diagnose dry eye. Studies conducted by Rolando2 and Kogbe et al.7 found that more than 80% of normal eyes showed type I and type II patterns and in keratoconjunctivitis sicca patients, more than 90% had type III and type IV ferning patterns.
More recently, tear ferning patterns have been investigated in association with overnight variation,8 post-menopausal women,9 newborn babies,10 after pterygium excision11 and in contact lens wearers.12 These studies had shown that ferning patterns were worse upon waking, dry eye sufferers amongst post-menopausal women demonstrated worse ferning patterns, newborns secrete moderate quantity and good quality tears, post-surgical improvement of fern pattern and higher grades of tear ferning patterns were observed in CL wearers. All these studies proved that tear ferning test is useful in assessing the pre-ocular tear film and dry eye.
The mean NIBUT was found to be 15.8±9.4s in Malay eyes.13 In another study conducted by Patel et al.14 on Chinese, Africans, Indians, and Caucasians eyes, it was found that mean NIBUT was 9.8±3.9s, 11.8±5.9s, 16.4±6.9s, and 19.9±8.3s, respectively. The above studies show that NIBUT in Asian eyes are lower than in Caucasian eye. The tear ferning patterns are probably different also in Asian eyes compared to Caucasian population and limited studies of tear ferning have been reported as compared to Caucasian. Results from this study may help in understanding the health of the ocular surface and stability of pre-ocular tear film of the Asian population.
Materials and MethodsSubjectsA total of one hundred and forty five qualified subjects with aged between twenty and sixty years old were recruited in the study. Participants with healthy cornea and non-dry eye were included in the study. Any history of ocular surgery, or trauma, lid abnormalities, blepharitis, conjunctivitis, current contact lens wear, any topical drug used, any systemic disorder such as Sjogren syndrome or cutaneous disorders which known to affect the anterior eye health were regarded as exclusion criteria. Female subjects during menstrual cycle period were not selected into this study. The study of Versura at al.15 showed that the tear production and stability were significantly related to hormonal changes in menstrual cycle.
Approval from the human ethics committee was obtained prior to data collection.
ProcedureIn this study, all ocular component measurements were taken only on the right eye of each subject and the measurements were taken with relative constant temperature of 23±3°C and relative humidity of 55±3% using a PH1000 Zeal Thermohygrometer. For consistency, all data were collected with the same instruments, in the same room by the same examiner throughout the study. McMonnies questionnaire were given to the subjects as a part of the process to determine that the subjects had no dry eyes. The score of 14.5 was chosen as the cut-off to separate those who had dry eyes (≥14.5) from non-dry eye.16
All subjects had a comprehensive eye examination, which included slit lamp assessment to establish baseline anterior segment health and determine participant eligibility. Informed consent was obtained from all subjects after the procedures were explained. For minimal invasion of the pre-ocular tear film, the examination started by evaluating the tear film by using non-invasive tear break-up time, follow by the tear ferning test to assess tear film quality.
Non-invasive Tear Break-up Time (NIBUT)For NIBUT test, three measurements of NIBUT were made from each subject's right eye, using the Keeler Tearscope Plus with a fine grid designed for use with the slit lamp magnification. The Tearscope Plus was fitted onto the tonometer mount on the slit lamp. The subject was comfortably positioned with chin on the slit-lamp. Then, the Tearscope Plus and slit lamp were adjusted so that the grid patterns were in focus. When the reflected mires were in focus onto the cornea, the subject was asked to blink several times and then to hold their blink for the measurement. The examiner, using a stopwatch, timed the first appearance of distortions in the concentric mires reflected from the corneal surface and observed on the eyepiece. The subject was encouraged to blink in between the three measurements to replenish the tear film homogeneity.
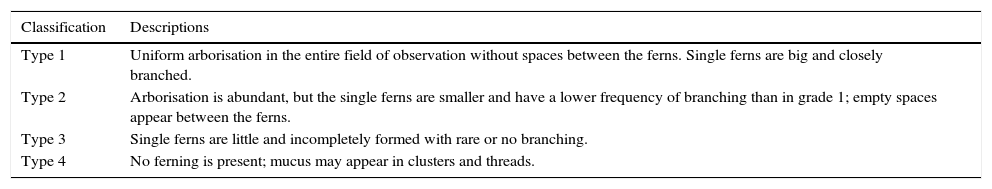
Tear Ferning Patterns (TFP)In tear ferning test, about 1μl of unstimulated tears were collected from the lower meniscus of the subject's right eye using a capillary tube when the subject was seated with the head resting comfortably. The sample was then dropped onto a precleaned microscope slide and allowed to air dry for 10min. The samples were observed using a light microscope and the photographs of each sample were taken immediately to avoid any changes in the ferning patterns, which may arise due to temperature, humidity, and time changes.3 The type of light microscope that was used in this study was an upright binocular compound light microscope (Olympus CX31 RBSF) and the objective lenses was Olympus Plan N 40x. The samples were observed under the Olympus CX31 binocular compound light microscope with an objective lenses of 40x magnifications. Each sample was categorized according to Rolando's tear ferning classification2 as described in Table 1, varying from normal physiology (type I and type II) to abnormal tear functionality (type III and type IV).
Rolando's Classification for Tear Ferning.
| Classification | Descriptions |
|---|---|
| Type 1 | Uniform arborisation in the entire field of observation without spaces between the ferns. Single ferns are big and closely branched. |
| Type 2 | Arborisation is abundant, but the single ferns are smaller and have a lower frequency of branching than in grade 1; empty spaces appear between the ferns. |
| Type 3 | Single ferns are little and incompletely formed with rare or no branching. |
| Type 4 | No ferning is present; mucus may appear in clusters and threads. |
In this study, tear ferning test results were not converted to numerical values. Non parametric test was used for tear ferning statistical analysis as TFP was an ordinal variable with a meaningful order, where type I showed the best ferning pattern, followed by type II, type III, and type IV that showed the worst ferning pattern.
Statistical AnalysesThe statistical analysis was performed using the PASW Statistics 20 with a 95% confidence level. Descriptive analysis was used to determine the tear ferning patterns, non-invasive tear break up time and McMonnies scores of the sample examined. Mann–Whitney test was used to compare the TFP and NIBUT in different gender. Kruskal–Wallis test was used to compare the TFP and NIBUT in four different races, which were Malay, Chinese, Indian, and other races as well as in four different age groups of 20–29, 30–39, 40–49 and 50–60 years old. Independent t-test was used to compare the McMonnies scores between gender and One-way ANOVA was used to compare the McMonnies scores in four different races and four different age groups. Spearman's rank-order correlation was chose to determine the relationships between NIBUT, TFP, McMonnies score and age for non-parametric data.
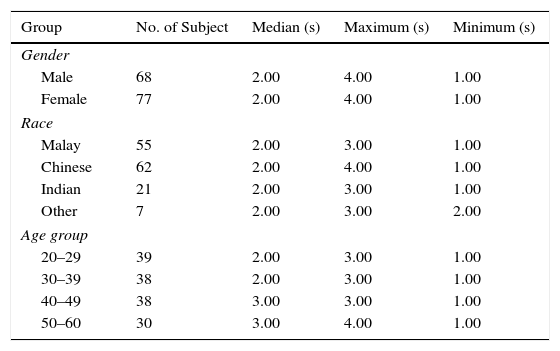
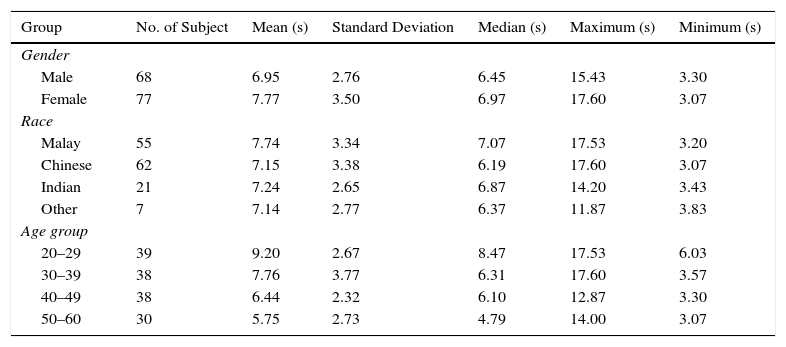
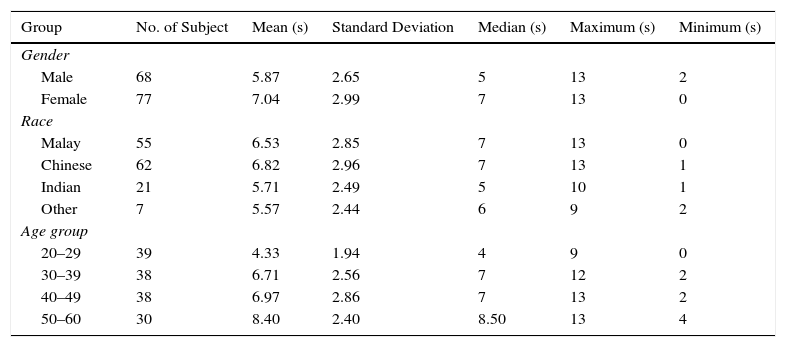
ResultsData distribution showed there were 46.9% male and 53.1% of female from total of 145 subjects. The study consist of 37.9% Malay, 42.8% Chinese, 14.5% Indian and 4.8% from other races. In tear ferning test, majority of the subjects had type 2 TFP which consist of 55 subjects (37.9%), followed by type 3 TFP with 53 subjects (36.6%), type 1 TFP with 35 subjects (24.1%) and type 4 with 2 subjects (1.4%). The median of NIBUT was 6.60s and mean value was 7.39±2.65s. Table 2 shows the frequencies of TFP, Table 3 shows the frequencies of NIBUT and Table 4 shows the McMonnies scores in different sex, races, and age groups.
Statistic of Frequencies of TFP.
| Group | No. of Subject | Median (s) | Maximum (s) | Minimum (s) |
|---|---|---|---|---|
| Gender | ||||
| Male | 68 | 2.00 | 4.00 | 1.00 |
| Female | 77 | 2.00 | 4.00 | 1.00 |
| Race | ||||
| Malay | 55 | 2.00 | 3.00 | 1.00 |
| Chinese | 62 | 2.00 | 4.00 | 1.00 |
| Indian | 21 | 2.00 | 3.00 | 1.00 |
| Other | 7 | 2.00 | 3.00 | 2.00 |
| Age group | ||||
| 20–29 | 39 | 2.00 | 3.00 | 1.00 |
| 30–39 | 38 | 2.00 | 3.00 | 1.00 |
| 40–49 | 38 | 3.00 | 3.00 | 1.00 |
| 50–60 | 30 | 3.00 | 4.00 | 1.00 |
Statistic of Frequencies of NIBUT.
| Group | No. of Subject | Mean (s) | Standard Deviation | Median (s) | Maximum (s) | Minimum (s) |
|---|---|---|---|---|---|---|
| Gender | ||||||
| Male | 68 | 6.95 | 2.76 | 6.45 | 15.43 | 3.30 |
| Female | 77 | 7.77 | 3.50 | 6.97 | 17.60 | 3.07 |
| Race | ||||||
| Malay | 55 | 7.74 | 3.34 | 7.07 | 17.53 | 3.20 |
| Chinese | 62 | 7.15 | 3.38 | 6.19 | 17.60 | 3.07 |
| Indian | 21 | 7.24 | 2.65 | 6.87 | 14.20 | 3.43 |
| Other | 7 | 7.14 | 2.77 | 6.37 | 11.87 | 3.83 |
| Age group | ||||||
| 20–29 | 39 | 9.20 | 2.67 | 8.47 | 17.53 | 6.03 |
| 30–39 | 38 | 7.76 | 3.77 | 6.31 | 17.60 | 3.57 |
| 40–49 | 38 | 6.44 | 2.32 | 6.10 | 12.87 | 3.30 |
| 50–60 | 30 | 5.75 | 2.73 | 4.79 | 14.00 | 3.07 |
Statistic of Frequencies of McMonnies Scores.
| Group | No. of Subject | Mean (s) | Standard Deviation | Median (s) | Maximum (s) | Minimum (s) |
|---|---|---|---|---|---|---|
| Gender | ||||||
| Male | 68 | 5.87 | 2.65 | 5 | 13 | 2 |
| Female | 77 | 7.04 | 2.99 | 7 | 13 | 0 |
| Race | ||||||
| Malay | 55 | 6.53 | 2.85 | 7 | 13 | 0 |
| Chinese | 62 | 6.82 | 2.96 | 7 | 13 | 1 |
| Indian | 21 | 5.71 | 2.49 | 5 | 10 | 1 |
| Other | 7 | 5.57 | 2.44 | 6 | 9 | 2 |
| Age group | ||||||
| 20–29 | 39 | 4.33 | 1.94 | 4 | 9 | 0 |
| 30–39 | 38 | 6.71 | 2.56 | 7 | 12 | 2 |
| 40–49 | 38 | 6.97 | 2.86 | 7 | 13 | 2 |
| 50–60 | 30 | 8.40 | 2.40 | 8.50 | 13 | 4 |
For the statistical analysis, the tear ferning test results were converted into numerical values as suggested by Beden et al.,9 Bitton et al.7 as well as Pensyl and Dillehay.15 Half point scale was used instead of the one to four classification, whereby type I=1.0, type I/II=1.5, type II=2.0, type II/III=2.5, type III=3.0, type III/IV=3.5 and type IV=4.0.
A comparison was done for TFP and NIBUT between genders. The analysis showed that there was no significant difference between gender for TFP (Z=−1.77, P>.05) as well as NIBUT (Z=−1.475, P>.05). However, McMonnies scores were significantly higher in females (P=.012). On the other hand, Kruskal–Wallis test was used to compare the TFP and NIBUT values in four different races, which were Malay, Chinese, Indian, and other races. The analysis showed that there was no significant difference between Malay, Chinese, Indian and other races in TFP (H(3)=4.85, P>.05) as well as in NIBUT (H(3)=2.18, P>.05). A similar trend was seen with the McMonnies scores (P>.05) using One-way ANOVA test. However, there was a significant difference between age group of 20–29, 30–39, 40–49, and 50–60 years old in both TFP (H(3)=28.25, P<.001) and NIBUT (H(3)=36.50, P<.001). Bonferroni post hoc test showed a significant difference for TFP between age group in years of 20–29 vs 30–39, 20–29 vs 40–49 and 20–29 vs 50–60. Similarly, there was a significant difference for NIBUT between age group in years of 20–29 vs 30–39, 20–29 vs 40–49, 20–29 vs 50–60 and 30–39 vs 50–60. McMonnies scores also showed a similar trend in which the scores were significantly different between age groups of 20–29 vs 30–39, 20–29 vs 40–49 and 20–29 vs 50–60 using Bonferroni post hoc test.
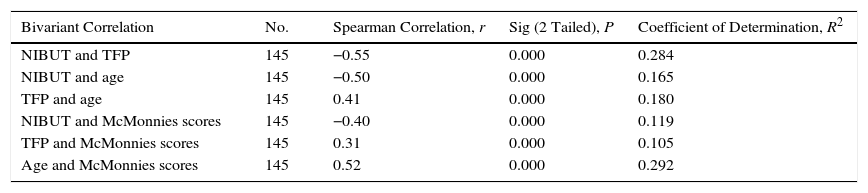
Spearman's rank-order correlation showed there was a significant relationship between TFP and NIBUT (r=−0.55, P<.001), age and NIBUT (r=−0.50, P<.001), age and TFP (r=0.41, P<0.001), McMonnies score and NIBUT (r=−0.40, P<.001), McMonnies score and TFP (r=0.31, P<.001), as well as age and McMonnies score (r=0.52, P<.001). This is shown in Table 5.
Correlation Between NIBUT, TFP, Age, and McMonnies Scores.
| Bivariant Correlation | No. | Spearman Correlation, r | Sig (2 Tailed), P | Coefficient of Determination, R2 |
|---|---|---|---|---|
| NIBUT and TFP | 145 | −0.55 | 0.000 | 0.284 |
| NIBUT and age | 145 | −0.50 | 0.000 | 0.165 |
| TFP and age | 145 | 0.41 | 0.000 | 0.180 |
| NIBUT and McMonnies scores | 145 | −0.40 | 0.000 | 0.119 |
| TFP and McMonnies scores | 145 | 0.31 | 0.000 | 0.105 |
| Age and McMonnies scores | 145 | 0.52 | 0.000 | 0.292 |
Bivariate Spearman's rank-order correlation was used to examine the correlation between TFP, NIBUT, McMonnies score and age of the subjects. There was a significant relationship of medium strength of correlation between TFP and NIBUT (r (145)=−0.55, P<.001). The result of the negative sign of the correlation indicates an association of higher NIBUT with lower type of TFP. On the other hand, bivariate correlation was undertaken between age and NIBUT. A significant negative relationship was seen to exist between age and NIBUT (r (145)=−0.50, P<.001). Therefore, a higher NIBUT was associated with lower age of a medium strength of correlation. Besides that, the analysis showed a significant relationship between age and TFP of the subjects, r (145)=0.41, P<.001. It showed that a positive and medium strength of correlation exist where greater TFP was associated with older age.
The output also showed a significant difference in McMonnies score and NIBUT correlation (r (145) =−0.40, P<.001) where the negative sign of the medium strength correlation indicates an association of lower McMonnies score with higher NIBUT. Furthermore, there was a significant positive relationship between McMonnies score and TFP, r (145)=0.31, P<.001. Hence, higher McMonnies score was associated with greater TFP but with a weak correlation. Lastly, the output of bivariate relationship showed that there was a significant and medium strength of correlation between age and McMonnies (r (145)=0.52, P<.001). Results of the positive correlation indicate that higher age was associated with higher McMonnies score.
DiscussionThe mean NIBUT for normal Malays and Chinese from the present study was found to be 7.74±3.34s and 7.15±3.38s respectively. However, the value found was much lower compared to the findings of Mohidin et al.13 and Cho and Yap17 whereby their studies obtained NIBUT values of 15.8±9.4s and 16.0±9.4s for Malay subjects in Malaysia and Chinese subjects in Hong Kong respectively. Patel et al.14 found the mean NIBUT of Chinese, Africans, Indian, and Caucasian in Scotland was 8.9±3.9s, 11.8±5.9s, 16.4±6s and 19.0±8.3s, respectively.
The results of the present study differ from previous studies probably due to the difference in measurement tools and techniques used in each study. Mohidin et al.13 and Cho and Yap17 measured NIBUT value using a modified perimeter bowl. Patel et al.14 used the Bausch and Lomb keratometer while Tearscope plus was used in the present study. In addition, Madden et al.18 suggested that small differences in the design of devices such as the width of the grid lines and the magnification used can also influence the test results. Other factors such as differences in image perception of the tear break up time may cause data discrepancies between studies.
Our analysis found that most of the subjects have type 2 TFP and lower NIBUT as compared to studies done on Caucasians in other parts of the world.14,19 The differences in the findings may be associated with difference in geographic location, ethnicity, diet, and environmental factors such as life style, weather, and temperature.7 Many researchers consider NIBUT of less than 10s as dry eye syndrome, and most of these studies were done on Caucasian subjects. However, in the present study, which was conducted entirely in Kuala Lumpur, the mean NIBUT values of the normal subjects were found to be less than 10s. Patel et al.14 have suggested that a NIBUT value of 5s be the cut off for Chinese subjects. Therefore, further analyses of NIBUT are required to determine a suitable cut off point of NIBUT dry eye value for the Malaysian population. However, this study showed no significant difference between the four races, Malays, Chinese, Indians, and other races for the NIBUT and TFP tests.
This study also showed no significant difference in the NIBUT values and TFP between genders. This is similar to other studies.5,9,13,20–23 NIBUT and TFP values showed a significant difference between the 4 age groups of 20–29, 30–39, 40–49 and 50–60 years. The NIBUT values decreased and TFP values increased with increasing age. This may be due to natural aging process and hormonal changes. The prevalence of dry eye increases among the elderly,24 especially in post menoposal women.25
There was a significant correlation between NIBUT and TFP, where higher values of NIBUT were associated with lower type of TFP. This is supported by other studies.12,19 In addition, bivariate correlations of NIBUT and age of the subject showed that there was a significant correlation between the stability of the tears and the age of the subject where higher NIBUT was associated with lower age. This finding is similar to other studies.13,17,20,23 However, the findings of Patel et al.14 does not agree with the present study. They found that the tear thinning time is not related to the age of the subject. They believe that stability of the tears is caused by factors affecting the flow of tears, tears osmolarity, ocular surface, and eyelids in maintaining tear film. The bivariate relationship between TFP and age show that a higher TFP is associated with a higher age. This is supported by the study of Norn22 and Puderbach and Stolze19 where they showed that there were significant differences between age groups and TFP where increasing age have higher TFP grade.
ConclusionsThe present study showed that the TFP and NIBUT was age dependent but not gender and race dependent. Subjects with older age had higher grade of TFP and McMonnies questionnaire score but lower NIBUT value. NIBUT as well as TFP test are useful to evaluate the tear film but NIBUT test is a faster method with minimal instrumentation making it a better clinical test. Perhaps both tests could be utilized further in clinical and research of dry eye evaluation.
Conflicts of InterestThe authors have no conflicts of interest to declare.
We thank all subjects who participated in this study.


