


To assess the visual effects of wearing both an activated and an inactivated photochromic contact lens, with a direct comparison to a non-photochromic contact lens worn in the fellow eye. This study focused on the visual effects of scatter quantified as the minimum distance between two points of light, and the diameter of the halo and starbursts that surround a bright white point source.
Methods60 subjects (aged 18–65 years) were measured in a contralateral design where lens type was randomly assigned, one type to each eye. During activated testing, all visual measures of both study lenses were made while each eye was illuminated by a violet (λmax=365, half bandwidth 20nm) activator, which caused steady-state activation of the photochromic lens during the period of testing. Two-point thresholds were determined by measuring the minimum distance between two points of broadband xenon light. Glare geometry was measured using an aperture (∼4mm) that created a bright point source of light 45 inches from the plane of the eye. Between the point source and subject, a centering precision caliper was used to measure lateral spread of halos (diffusion around the source) and visual spokes. The head was stabilized using an adjustable head-rest assembly and the eye was aligned and monitored with a bore camera.
ResultsCompared to the non-photochromic lens, and based on the stimulus conditions used in these measurements, the activated and inactivated photochromic lens reduced the light spread using the two-point threshold technique by 32% and 19% respectively; the diameter of the halos were reduced by 44% and 16% respectively; and the spokes were narrowed by 39% and 20% respectively. Based on 95% confidence interval testing, these effects were all statistically significant (p<0.05).
ConclusionsThese results are consistent with previous data showing that soft contact lenses with a photochromic additive can improve many aspects of visual function, consistent with their level or activation. Our past data focused on visual function under bright light conditions (e.g., glare disability, discomfort, photostress recovery and chromatic contrast) with an activated photochromic. In this study, we found differences even in the inactivated state, using less intense stimuli (10cd/m2 at the source). This suggests that the photochromic lens improves the effects of light scatter even at lower luminance.
Evaluar los efectos visuales del uso de lentes de contacto con activación e inactivación fotocromática, mediante comparación directa con el uso de lentes de contacto no fotocromáticas en el ojo contralateral. Este estudio se centró en los efectos visuales de la dispersión, cuantificada mediante la distancia mínima entre dos puntos luminosos, y el diámetro del halo y los destellos que rodean a una fuente fija blanca brillante.
MétodosSe realizaron mediciones a 60 sujetos (de edades comprendidas entre 18 y 65 años) en un diseño contralateral en el que se asignó aleatoriamente un tipo a cada ojo. Durante la prueba con activación, se realizaron todas las medidas visuales de ambas lentes en estudio, mientras se iluminaba cada ojo con un activador violeta (λ máx.=365, ancho de banda medio 20nm), que causó una activación del estado de equilibrio de las lentes fotocromáticas durante el periodo de prueba. Se determinaron los umbrales de dos puntos, midiendo la distancia mínima entre dos puntos de luz de xenón de banda ancha. Se midió la geometría del reflejo utilizando una apertura (∼4mm) que creó una fuente fija brillante de luz a 45 pulgadas del plano del ojo. Entre la fuente fija y el sujeto se utilizó un calibrador de precisión de centrado para medir la expansión lateral de los halos (difusión alrededor de la fuente) y los destellos. La cabeza se estabilizó utilizando un reposacabezas, alineándose y supervisándose el ojo con una cámara.
ResultadosRealizando una comparación con las lentes no fotocromáticas, y sobre la base de las condiciones de estímulo utilizadas en estas medidas, las lentes con activación y desactivación fotocromática redujeron la expansión de la luz utilizando la técnica del umbral de dos puntos en un 32% y un 19% respectivamente; el diámetro de los halos se redujo en un 44% y 16% respectivamente; y los brillos se estrecharon en un 39% y 20% respectivamente. Basándonos en la prueba del intervalo de confianza del 95%, todos estos efectos fueron estadísticamente significativos (p<0,05).
ConclusionesEstos resultados son consistentes con los datos previos, que reflejan que las lentes de contacto fotocromáticas pueden mejorar muchos aspectos de la función visual, en consistencia con su nivel de activación. Nuestros datos anteriores se centraron en la función visual en condiciones de luz brillante (ej.: incapacidad por deslumbramiento, incomodidad, recuperación de foto-estrés y contraste cromático) con activación de adición fotocromática. En este estudio, encontramos diferencias incluso en el estado de inactivación, utilizando estímulos menos intensos (10cd/m2 en la fuente), lo cual sugiere que las lentes fotocromáticas mejoran los efectos de la dispersión luminosa incluso con una luminancia menor.
Clinicians often quantify visual effects that are specific to correcting refraction or detecting ocular disease (such as reduced acuity or retinal sensitivity). It is less common to evaluate the deleterious visual effects of intraocular scatter. Nonetheless, such effects have been discussed in the scientific literature for over a century (starting with Goethe in 1810,1 Purkinje et al. in 18232 and Helmholtz in 18523; for review, see Vos4). Often the discussion focuses on the optics as opposed to the functional consequences per se. The Commission Internationale de l’Eclairage (CIE)5 quantified disability glare as the outer part of the functional Point Spread Function (PSF); essentially, the misdirection of light out of the stimulus image due to aberrations and scatter. In geometrical optics, this is often described simply as the PSF: the spread of light around an ideal point due to diffraction, aberrations, and scatter.5 Often only a partial PSF is calculated: a PSF that is normalized (based upon double-pass methods and describing only the central PSF) and a PSF that is absolute (based upon the glare method describing only the PSFs broad skirt beyond one degree). The former accounts primarily for the results of aberrations and the latter describes the effects of scatter, both originating anterior to the retina (largely lenticular). Since the two procedures are so disparate and are not often applied to the same subjects, diffusion near an edge is often measured using the double-pass technique and diffusion remote from an edge is evaluated by the glare method.
Westheimer and Liang6 used both methods on the same subjects and calculated the PSF as it would actually be present in the living eye (i.e., the functional PSF). Westheimer and Liang6 showed that the overwhelming fraction of the functional PSF was due to wide-spread scatter as opposed to the central portion of the PSF which was dominated by the effects of aberration. Westheimer and Liang described PSF measured this way as the “diffusion index,” a quantitative description of what is commonly referred to as halos. This diffusion index was shown to vary widely across healthy normal subjects despite similarities in visual acuity. Such significant individual differences in the effects of scatter, despite similarities in refractive state, was later replicated on a much larger sample (n=2422) by Michael et al.7 Such studies have made it clear that intraocular scatter, often experienced as phenomena such as halos, are important independent predictors of the quality of vision.
Visual effects connected to intraocular scattering, such as halos, glare disability/discomfort, and starbursts (peripheral spokes) all have individual characters and are quantified differently. They are also often exacerbated in distinct ways when the eye is compromised by disease or surgery. For example, halos and starbursts (i.e., positive dysphotopsia) can often follow cataract surgery and can vary according to intraocular lens type.8 Glare disability and discomfort can be reduced by increasing retinal macular pigments (essentially increasing filtering in front of the cones),9 but increased macular pigment has little or no effect on the amount of intraocular scatter arising from the anterior portions of the eye10 (absorbance by macular pigment would also not influence the effects of scatter outside the spatial area where the pigments absorb light).
Halos and glare disability do have some characteristics in common. For example, they are mostly experienced as a relatively homogenous veil. Starbursts in contrast are not homogeneous and extend outside the line of sight into the periphery. This pattern is shown in Fig. 1. Peripheral spoking likely has some unique physiological qualities11 and disrupts visual function in ways that are also independent of other aspects of glare (by some estimates, as many as 90% of post-LASIK patients experience starburst phenomenon12).
 and starbursts (red arrow). The image on the right shows these effects reduced.")
Halos and peripheral spokes are often used as descriptors for the deleterious aspects of scatter when connected with exposure to bright light. The underlying optics (as quantified by the PSF, Strehl ratio, or diffusion index), however, do not depend on intense light. These issues are present, and can degrade the visual image, even at low intensity (e.g., low luminance, low contrast targets). One means of quantifying scattering effects at lower luminance is by measuring the separation of two small point sources of light. Subjects with a wider PSF will require a wider separation before two points of light will appear distinct. This can be measured using relatively dim light. Significantly, these types of measures do not tend to correlate with other, more commonly measured metrics, such as visual acuity.13 In this study we were interested in measuring the effects of the new photochromic contact lens on these more novel indices: halos, peripheral spoking and two-point light thresholds.
MethodsSubjectsThis study utilized a prospective, randomized, subject-masked, contralateral design. Subjects were required to be adapted wearers of senofilcon A or other spherical silicone hydrogel soft contact lenses and be in the age range of 18–65 years. All subjects were required to have vertex corrected spherical equivalent distance refraction in the range of −1.00 to −4.50 D and best corrected visual acuity of 20/25 or better in each eye. Subjects were excluded if they reported ocular/systemic issues that could interfere with testing or contact lens wear, such as corneal distortion from previous hard or rigid gas permeable contact lens wear. These issues were evaluated by the attending clinician (e.g., subjects were ineligible if they were grade three or higher using the FDA Slit Lamp Classification Scale).
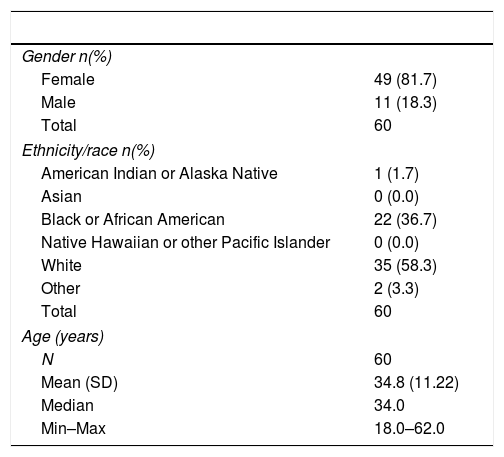
A total of 62 subjects were enrolled from a single clinical site in this study (Georgia Center for Sight, Greensboro, GA) (see Table 1). Of those enrolled, 60 (96.8%) subjects were assigned and administered a study lens, while 2 (3.2%) subjects were screen failures and/or not assigned. Of the total assigned subjects, all 60 (96.8%) subjects completed the study. The majority of the subjects were female (85%) and white (59.3%) followed by black or African American (38.9%). The average age (±SD) was 34.9 (±11.24) years, with age distributed as follows: 39 subjects were in the 18–39 years age range, and 21 subjects were in the 40–65 years age range. A total of 66.7% of the subjects had dark irides while 33.3% subjects had light irides, based on visual evaluation and comparison against a standard scale14 by a single, trained rater.
Participant characteristics.
| Gender n(%) | |
| Female | 49 (81.7) |
| Male | 11 (18.3) |
| Total | 60 |
| Ethnicity/race n(%) | |
| American Indian or Alaska Native | 1 (1.7) |
| Asian | 0 (0.0) |
| Black or African American | 22 (36.7) |
| Native Hawaiian or other Pacific Islander | 0 (0.0) |
| White | 35 (58.3) |
| Other | 2 (3.3) |
| Total | 60 |
| Age (years) | |
| N | 60 |
| Mean (SD) | 34.8 (11.22) |
| Median | 34.0 |
| Min–Max | 18.0–62.0 |
The study was performed in accordance with ISO 14155:2011 (clinical investigation of medical devices for human subjects) and followed the tenets of the Declaration of Helsinki. Verbal and written informed consent were obtained from all subjects and the protocols were approved by the Sterling Institutional Review Board, Atlanta, GA.
Materials and methodsExperimental Test and Control contact lensesThe photochromic Test contact lenses that we used and the Control contact lens (of similar base monomer but without the photochromic additive) that served as the within-subject control were provided by Johnson & Johnson Vision Care, Inc. (Jacksonville, FL). Differences in visual performance between the Control lens and the Test lens were measured during a single clinic visit.
Four conditions were tested: Test with and without a violet activator, and Control with and without a violet activator. The activator was used to cause a steady-state activation of the photochromic Test lens during testing and was used in the Control condition simply to keep conditions consistent between the two eyes. Both lens type and activation state were randomized within subjects. With respect to lens type, the Test and Control lenses were randomized within each subject, to either OD-Test, OS-Control, or OD-Control, OS-Test; activated for first measure, or inactivated for first measure. When the randomization scheme resulted in the initial test in the activated state, 10min of washout time was given prior to any additional testing on the lens, to ensure that the photochromic Test lens could return to its baseline state. When the violet activator was used to activate the lens, the participant was exposed to the activator for 60s prior to visual function testing, and the visual function measures were completed with the activating light on.
ApparatusLight for all of the measurements was produced by a 1000W Xenon arc lamp (this broadband spectrum was used to simulate sunlight in many of the conditions). An achromatic lens was used to partially collimate the light so that it provided homogeneous back illumination of an opaque light shield with a collapsible baffle (a center piece lowered as the apertures spread in order to make distinct light points that were physically disconnected; see Fig. 2). This light shield contained two small (2mm) apertures that could be brought together into a single point or slowly moved apart as two separate points. A digital micrometer was used to measure these lateral movements during two-point threshold testing. When measuring halos and starburst sizes, the same light source arrangement was used, but the stimulus was always presented as a single point of light.
; M: mirror; SI: dedicated digital micrometer measuring the distance between the two light points; LS: light shield (∼114cm from the plane of the eye); CC: calipers; L2: 220nm focal length lens used only during the two-point measurements; VA#: violet activator; BC: bore camera.")
Schematic of the optical system used to measure visual function. S: light source; L1: lens; IF: interference filter (the 403nm or ND filter in some conditions); M: mirror; SI: dedicated digital micrometer measuring the distance between the two light points; LS: light shield (∼114cm from the plane of the eye); CC: calipers; L2: 220nm focal length lens used only during the two-point measurements; VA#: violet activator; BC: bore camera.
Stabilization of the subject's head was accomplished by an adjustable chin and forehead rest assembly. The position of the eye was constantly monitored by a small bore camera to ensure proper alignment with the test stimuli.
Activation of the photochromicActivation of the photochromic was achieved using a violet activator consisting of LEDs that peaked at a wavelength of 365nm (half bandpass=20nm). One activator was placed on each of the temporal sides of the head and chin rest assembly, so that each eye received light from the temporal side. The activation light beam had a diffusion angle that covered approximately 2-inches square, and the test eye's alignment with the beam was monitored using the bore camera. The violet activation LEDs were used at a low constant rate while all of the visual measures (two-point thresholds, halo and starburst sizes) were collected in both conditions (the Test and Control lens), so that visual function measurements were made using the same amount of light in the activated state, even if the Control lens was being tested.
The overall energy at the plane of the eye from the activation source was low, 9.22μW/cm2/nm. As a comparison, when the lights in the experimental room were turned on, the energy at the plane of the eye increased to 87mW (i.e., the energy at the plane of the retina increased substantially by just turning on the overhead room lights). Hence, only a relatively low amount of energy from the violet LEDs was incident upon the eye during the experiment. We estimated the degree of activation of the photochromic by measuring the spectral sensitivity in the eye wearing the activated photochromic Test lens and the other eye wearing the Control lens (using identical conditions). Taking the difference of the two spectral sensitivity curves yielded a difference spectrum. Based on these measures (relatively rough, since it assumes homogeneity across the two eyes), we estimated that the photochromic was maximally activated (bench measurements suggest that the maximum optical density for the lens is around 0.40).
ProcedureAll visual function testing was conducted on the same apparatus (described above), in a darkened room. Individual test procedures are as follows:
Two-point thresholdsThe Rayleigh criterion method of measuring the spread of two small point light sources has a long history of optical applications (e.g., Grimes et al., 1967).15 In our case, we adapted the method in order to increase its ecological validity (e.g., by using xenon white simulating noon-day sunlight). Light from the point source (i.e., light emerging from the 2mm apertures in the light shield) was focused by a long (220mm) focal length lens (17.8cm from the plane of the eye) so that the subject's eye was in partial Maxwellian view (meaning the eye was in the focusing beam but the plane of the eye was anterior to the final focal point). When the points were maximally close together, the stimulus appeared as a single, bright point of light. The two apertures were slowly moved apart (the distance was quantified with a digital micrometer, centered on the apertures, that was part of the physical structure forming the apertures) from this “zero point,” and subjects indicated when the spread from each light point did not overlap (e.g., when they first perceived a small black space between the two points). Three trials were completed for each lens type, in each activation state, in each of two test conditions, for a total of 24 total trials for each subject. As stated previously, lens order and activation state were randomized for each subject, with appropriate washout periods. In condition 1, two-point thresholds (the minimum distance between the apertures where participants could distinguish the points as separate) were measured using only the white light from the xenon arc source (attenuated with neutral density filters to about 10cd/m2 measured at the aperture). In condition 2, the neutral density filters were removed and replaced with a 403nm narrow bandpass (8nm half-bandpass) interference filter. This filter significantly reduced the energy of the stimulus (from 32lux at the light shield to 0.3lux) but increased the spread of the light.
Halo and starburst diametersVarious forms of halometric testing have been published16–19 and the method has been shown to be highly reliable.20 Prior to testing, subjects were given a visual guide that provided examples of what halos and starbursts commonly look like to normal viewers in natural scenes (e.g., car headlights, streetlights, against a blue sky or created through stadium lights, e.g., see Fig. 1). Glare geometry (halo and starburst sizes) was measured using an aperture (∼4mm at the light shield) that created a bright point source of light 96.5cm from the plane of the eye. Between the point source and subject, a centering precision caliper (approximately 58.4cm from the plane of the eye) was used to measure lateral spread of halos (diffusion around the source) and visual spokes of the resulting starburst. In order for the caliper guides to be clearly seen by the subjects, the guides were covered with highly reflective material. A dim white LED was affixed to the head rest assembly above the subject's head that illuminated the arms of the calipers.
The ascending and descending method of limits was used to determine the diameters of the halo (diffuse light around the point source) and starburst (spokes radiating outward from the point source). A single trained experimenter moved the caliper guides until subjects indicated that the guides just surrounded the halo and the starburst. Participants completed three trials for halos and three trials for starbursts, in each activation state, with each lens. Consequently, each participant completed a total of 12 trials with the Test lens, and 12 trials with the Control lens for starbursts, and 12 trials with the Test lens, and 12 trials with the Control lens for halos.
Photometric calibrations (both in the visible and ultraviolet) were performed using an ILT 950 spectral radiometer (International Light Technologies, Peabdoy, MA). Wedge and neutral density radiometric calibrations were performed using a Graseby Optronics United Detection Technology (UDT) instrument (Orlando, FL). The same UDT instrument was used before every experimental session to ensure that the total light output of the optical system remained constant and consistent throughout the study.
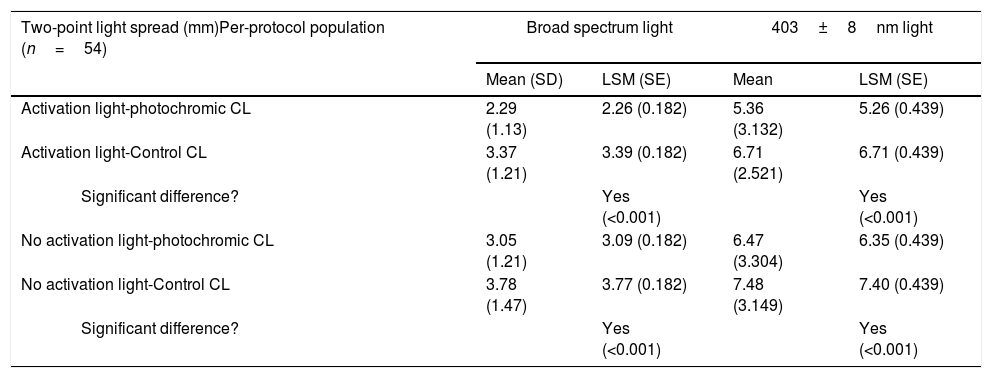
ResultsTwo-point thresholdsResults of two-point threshold testing can be seen in Table 2.
Two-point thresholds in the activated and minimally activated condition between Test and Control lenses.
| Two-point light spread (mm)Per-protocol population (n=54) | Broad spectrum light | 403±8nm light | ||
|---|---|---|---|---|
| Mean (SD) | LSM (SE) | Mean | LSM (SE) | |
| Activation light-photochromic CL | 2.29 (1.13) | 2.26 (0.182) | 5.36 (3.132) | 5.26 (0.439) |
| Activation light-Control CL | 3.37 (1.21) | 3.39 (0.182) | 6.71 (2.521) | 6.71 (0.439) |
| Significant difference? | Yes (<0.001) | Yes (<0.001) | ||
| No activation light-photochromic CL | 3.05 (1.21) | 3.09 (0.182) | 6.47 (3.304) | 6.35 (0.439) |
| No activation light-Control CL | 3.78 (1.47) | 3.77 (0.182) | 7.48 (3.149) | 7.40 (0.439) |
| Significant difference? | Yes (<0.001) | Yes (<0.001) | ||
SD: standard deviation; LSM: least square mean; SE: standard error.
Two-point thresholds were measured using both broadband “white” light and using a high energy visible (HEV) 403nm condition, to isolate the waveband of visible light most likely to cause scatter and visual distortion. In the presence of the violet activator, the activated photochromic Test lens showed significant benefits compared with the clear Control lens, in both the “white” and HEV test conditions. In the broadband “white” condition, two-point thresholds were significantly lower (p<0.001) in the eye with the activated photochromic Test lens (M=2.29±1.13mm), compared against the eye with the clear Control lens (M=3.37±1.21mm). In other words, thresholds were about 32% lower with the activated Test lens, compared to the clear Control lens.
In the HEV condition, thresholds were generally about twice as high. Despite the fact that the HEV light caused increased blur and scatter, thresholds were significantly lower (p<0.001) in the eye with the photochromic Test lens (M=5.36±3.132mm), compared to the clear Control lens (M=6.71±2.521mm).
Test vs. Control, without activatorThe broadband “white” and HEV conditions were also tested without the violet activating light. This yielded a “minimally activated” state in the photochromic Test lens, similar to the small amount of lens activation likely to occur in indoor settings. In the broadband “white” condition, two-point thresholds for the eye wearing the photochromic Test lens (M=3.05±1.21mm) were significantly lower (p<0.001) than thresholds for the eye wearing the clear Control lens (M=3.78±1.47mm), even when the photochromic was not activated. In other words, the eye wearing the Test lens could resolve two distinct points about 19% closer to each other than the eye wearing the clear Control lens, even when the Test lens was only minimally activated. In the HEV condition, the eye wearing minimally activated photochromic Test lens (M=6.47±3.304mm) had significantly smaller thresholds (p<0.001) than the eye wearing the clear Control lens (M=7.48±3.149mm).
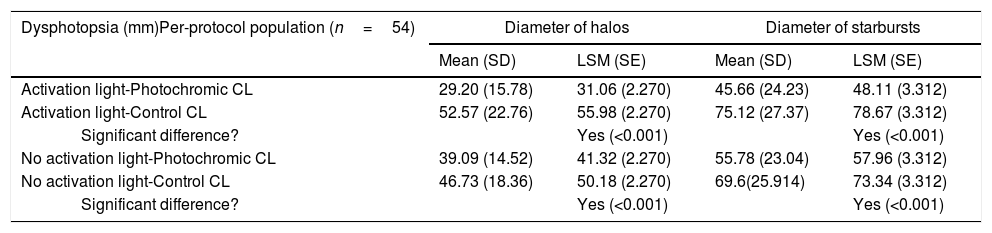
Dysphotopsia measurementsResults of the dysphotopsia measurements can be seen in Table 3.
Halo and starburst diameters in activated and inactivated test conditions.
| Dysphotopsia (mm)Per-protocol population (n=54) | Diameter of halos | Diameter of starbursts | ||
|---|---|---|---|---|
| Mean (SD) | LSM (SE) | Mean (SD) | LSM (SE) | |
| Activation light-Photochromic CL | 29.20 (15.78) | 31.06 (2.270) | 45.66 (24.23) | 48.11 (3.312) |
| Activation light-Control CL | 52.57 (22.76) | 55.98 (2.270) | 75.12 (27.37) | 78.67 (3.312) |
| Significant difference? | Yes (<0.001) | Yes (<0.001) | ||
| No activation light-Photochromic CL | 39.09 (14.52) | 41.32 (2.270) | 55.78 (23.04) | 57.96 (3.312) |
| No activation light-Control CL | 46.73 (18.36) | 50.18 (2.270) | 69.6(25.914) | 73.34 (3.312) |
| Significant difference? | Yes (<0.001) | Yes (<0.001) | ||
SD: standard deviation; LSM: least square mean; SE: standard error.
Halo size was significantly smaller (p<0.001) in the eye with the photochromic Test lens (M=29.20±15.78mm), compared to the eye with the clear Control lens (M=52.27±22.76mm), when the violet activating light was used. The starburst size (mm) was similarly reduced in the eye wearing the activated photochromic Test lens (M=45.66±24.23mm), compared to the clear Control lens (M=75.12±27.37mm; p<0.001). In other words, halo and starburst sizes were reduced by about 44% and 39%, respectively, in the eye wearing the photochromic Test lens.
Test vs. Control, without activatorWhen the Test and Control lenses were compared without the activating light, both halo and starburst sizes (mm) were still reduced in the eye wearing the photochromic Test lens. Halo size was significantly (p<0.001) smaller in the photochromic Test lens (M=39.09±14.52mm) than in the clear Control lens (M=46.73±18.36mm). Starburst size was also significantly (p<0.001) reduced in the eye wearing the photochromic test lens (M=55.78±23.04mm) compared to the clear Control lens (M=69.6±25.9mm). Although these reductions in halo and starburst sizes were statistically significant, they were reduced in magnitude (16% and 20%, respectively) compared to the activated condition.
DiscussionThe biomaterials used in contact lenses have evolved rapidly over the last four decades. The improvement in comfort and reduction in mechanical insult due to the use of soft polymers, and the reduction of physiological stress to the cornea due to increased oxygen permeability were all dramatic innovations. One of the newest innovations to contact lenses is the addition of a photochromic additive which darkens when exposed to ultraviolet-violet light and lightens in its absence. The spectrum of the photochromic contact lens that we tested in this study has been published in Renzi-Hammond et al.21
The design goal of the photochromic lens is to filter light in bright conditions, thereby reducing some of the more deleterious aspects of bright light on visual function. Bright light, such as that arising from the sun outdoors, does, of course, cause visual disturbance. For example, visual problems arising from natural sunlight is a major source of aviation22 and automotive accidents.23–25 In this study, we tested visual effects using a light source that closely simulated natural sunlight26. Three parameters were tested: halos, starbursts and two-point thresholds. Halos and starbursts, in the clinical literature, are often referred to as positive dysphotopsia (PDP). PDP tends to increase with age and ocular disease and is exaggerated in certain occupations (e.g., truck drivers and pilots) and individuals who undergo laser vision correction. Such complications may be why LASIK procedures have dropped by more than 50%, from 1.5 million procedures per year in 2007 to 604K in 2015 (e.g., see lasikcomplications.com). PDP is also common in athletes and individuals with outdoor or light-intensive professions. PDP symptoms accompany a plethora of other conditions including dry eye, astigmatism, epiphora, mild-traumatic brain injury, epicanthic eye structure, increased lens density (particularly glycemic), and others.
Both halos and starbursts arise from intraocular scatter and become increasingly noticeable and debilitating as the intensity of a light source increases. It follows that a contact lens that filters such light would decrease perception of these phenomena (note that we only measured the visual/perceptual effects not the underlying mechanisms driving such effects). This prediction is consistent with the result of our measurements. The activated photochromic contact lens significantly decreased the diameter of both the halos (by 48%) and starbursts (by 42%). To test the photochromic in its activated state, we used an ultraviolet/violet activator that was placed to the side and illuminated the contact (and control) during the measurements. We repeated all of the measurements, on both the test lens and control, without this activation light. In this study we did not measure or control for differences in pupil size between the two contact lenses we tested. As shown in Fig. 1, the stimuli were several feet from the subject, relatively dim (10cd/m2 at the source), and pupil size tends to be interocularly yoked, so we reasoned that the likelihood it would influence the results of our study was small.
One unexpected finding was that halo (by 18%) and starburst (by 22%) sizes were reduced by the photochromic Test lens, even when the activator light was not used. The amount of light coming from the small point source was insufficient to activate the photochromic (∼10cd/m2 at the aperture, approximately three feet from the subject) and psychophysical testing occurred in a dark room, with no other sources of light. This suggests that the photochromic could reduce visual disturbances from bright light even under “indoor” conditions. As shown in Fig. 1 of Renzi-Hammond et al.21 bench measurements comparing the inactivated photochromic to a standard clear contact lens show about a 10% average increase in filtering by the photochromic (this may be increased slightly in situ due to higher lability connected to higher body heat). Significantly, this difference is mostly in the short-wave end of the visible spectrum (e.g., at 400nm, the difference is about 50%). Studies (e.g., Stringham et al.27) that have measured the action spectrum of variables like glare discomfort have shown that the shorter the wavelength, the more exaggerated the response. In 1966, Stevens28 originally described the nonlinearity of brightness perception in response to luminance changes (magnification at the beginning of the curve, compression at the end): a small decrease in luminance (e.g., through filtering) at lower luminance, translates to a large decrease in perceived brightness. Subtle tinting of a photochromic indoors might be expected to have disproportionately larger effects on visual perception.
Finally, we also found that the photochromic lens improved the ability to resolve the separation of two small bright points of light (using both broad-band “white” light and high-energy violet light as the source). This effect was also apparent when the photochromic was not activated, but it was reduced in magnitude. It is increasingly difficult for individuals to cope with the challenges of an ever changing, often artificial, light scape (often reaching the point of light pollution). Assistive technologies, such as photochromic contact lenses, could have an important role to play.
FundingThis project was funded by a grant from Johnson and Johnson Vision Care, Inc. Authors JB, JC and YT are employees of Johnson and Johnson Vision Care, Inc. Authors LRH and BH have received consulting fees and travel support for scientific presentations from Johnson and Johnson Vision Care, Inc.
Conflicts of interestThe authors have no conflicts of interest to declare.
This project was funded in its entirety by a research grant from Johnson and Johnson Vision Care, Inc.


