


The invention described herein is a prototype based on computer vision technology that measures depth perception and is intended for the early examination of stereopsis.
Materials and methodsThe prototype (software and hardware) is a depth perception measurement system that consists on: (a) a screen showing stereoscopic models with a guide point that the subject must point to; (b) a camera capturing the distance between the screen and the subject's finger; and (c) a unit for recording, processing and storing the captured measurements. For test validation, the reproducibility and reliability of the platform were calculated by comparing results with standard stereoscopic tests. A demographic study of depth perception by subgroup analysis is shown. Subjective comparison of the different tests was carried out by means of a satisfaction survey.
ResultsWe included 94 subjects, 25 children and 69 adults, with a mean age of 34.2 ± 18.9 years; 36.2 % were men and 63.8 % were women. The DALE3D platform obtained good repeatability with an interclass correlation coefficient (ICC) between 0.94 and 0.87, and coefficient of variation (CV) between 0.1 and 0.26. Threshold determining optimal and suboptimal results was calculated for Randot and DALE3D test. Spearman's correlation coefficient, between thresholds was not statistically significant (p value > 0.05). The test was considered more visually appealing and easier to use by the participants (90 % maximum score).
ConclusionsThe DALE3D platform is a potentially useful tool for measuring depth perception with optimal reproducibility rates. Its innovative design makes it a more intuitive tool for children than current stereoscopic tests. Nevertheless, further studies will be needed to assess whether the depth perception measured by the DALE3D platform is a sufficiently reliable parameter to assess stereopsis.
Stereopsis is the ability to perceive objects in three dimensions, including width, height, and depth.1 It is achieved by the human visual system, which consists of two eyes separated by interpupillary distance (IPD). Each eye perceives a slightly different image of the object due to the images being projected differently onto the retina of each eye, resulting in retinal disparity. The brain combines these two different images through 3D reconstruction to create a single image, enabling depth perception. This process is known as binocular vision.1
Stereopsis is essential for perceiving different distances and sizes of objects in the environment, and making precise judgments about these perceptions. In addition, it is related to correct psychomotor development.2 There is evidence that motor speed and precision are significantly affected in monocular conditions.3,4
Impaired stereoscopic vision (ISV) can occur in diseases such as amblyopia or strabismus, where there is low vision in one eye or the eyes are not aligned.5 This condition affects approximately 5 % of the population and is underdiagnosed.6
Development of the binocular vision system begins almost from birth and is established at around 7 years of age.7 Although there are cases of ISV returning to normal in adulthood, outcomes are better during childhood due to cerebral plasticity.2 Early diagnosis and treatment of pathologies such as amblyopia and/or strabismus confer better outcomes in terms of stereoscopic vision.8
In current clinical practice, haploscopic booklets such as the TNO test, Randot test, or Lang I and II tests are used to detect stereopsis. However, these tests have limitations. Traditional tests can give false positives due to presenting monocular cues,9,10 and false negatives7,11,12 in some cases due to their inherent difficulty. In addition, these tests provide a static evaluation of stereopsis, while reality is dynamic. Therefore, cases of people with negative test results have been described, even if they reported having 3D vision.13 The stereopsis grading system of standard tests is based on a limited number of disparities,5 between which there are large differences, and which may therefore not be sensitive to certain changes in stereoacuity.2,14 These limitations, coupled with their outdated design, format and technology, have prompted the search for new systems for evaluating stereopsis.
The main aim of this study is to evaluate depth perception detected with “DALE3D” platform as a measure of grades of stereopsis in subjects with positive stereopsis test. The platform is protected by patent ES2722473B2 and represents a double innovation in stereopsis assessment: measures a new parameter i.e. depth perception, using a new method of measurement based in computer vision technology and 3D models being more visually appealing to children than traditional tests. A demographic study of stereopsis was also carried out by population subgroup analysis.
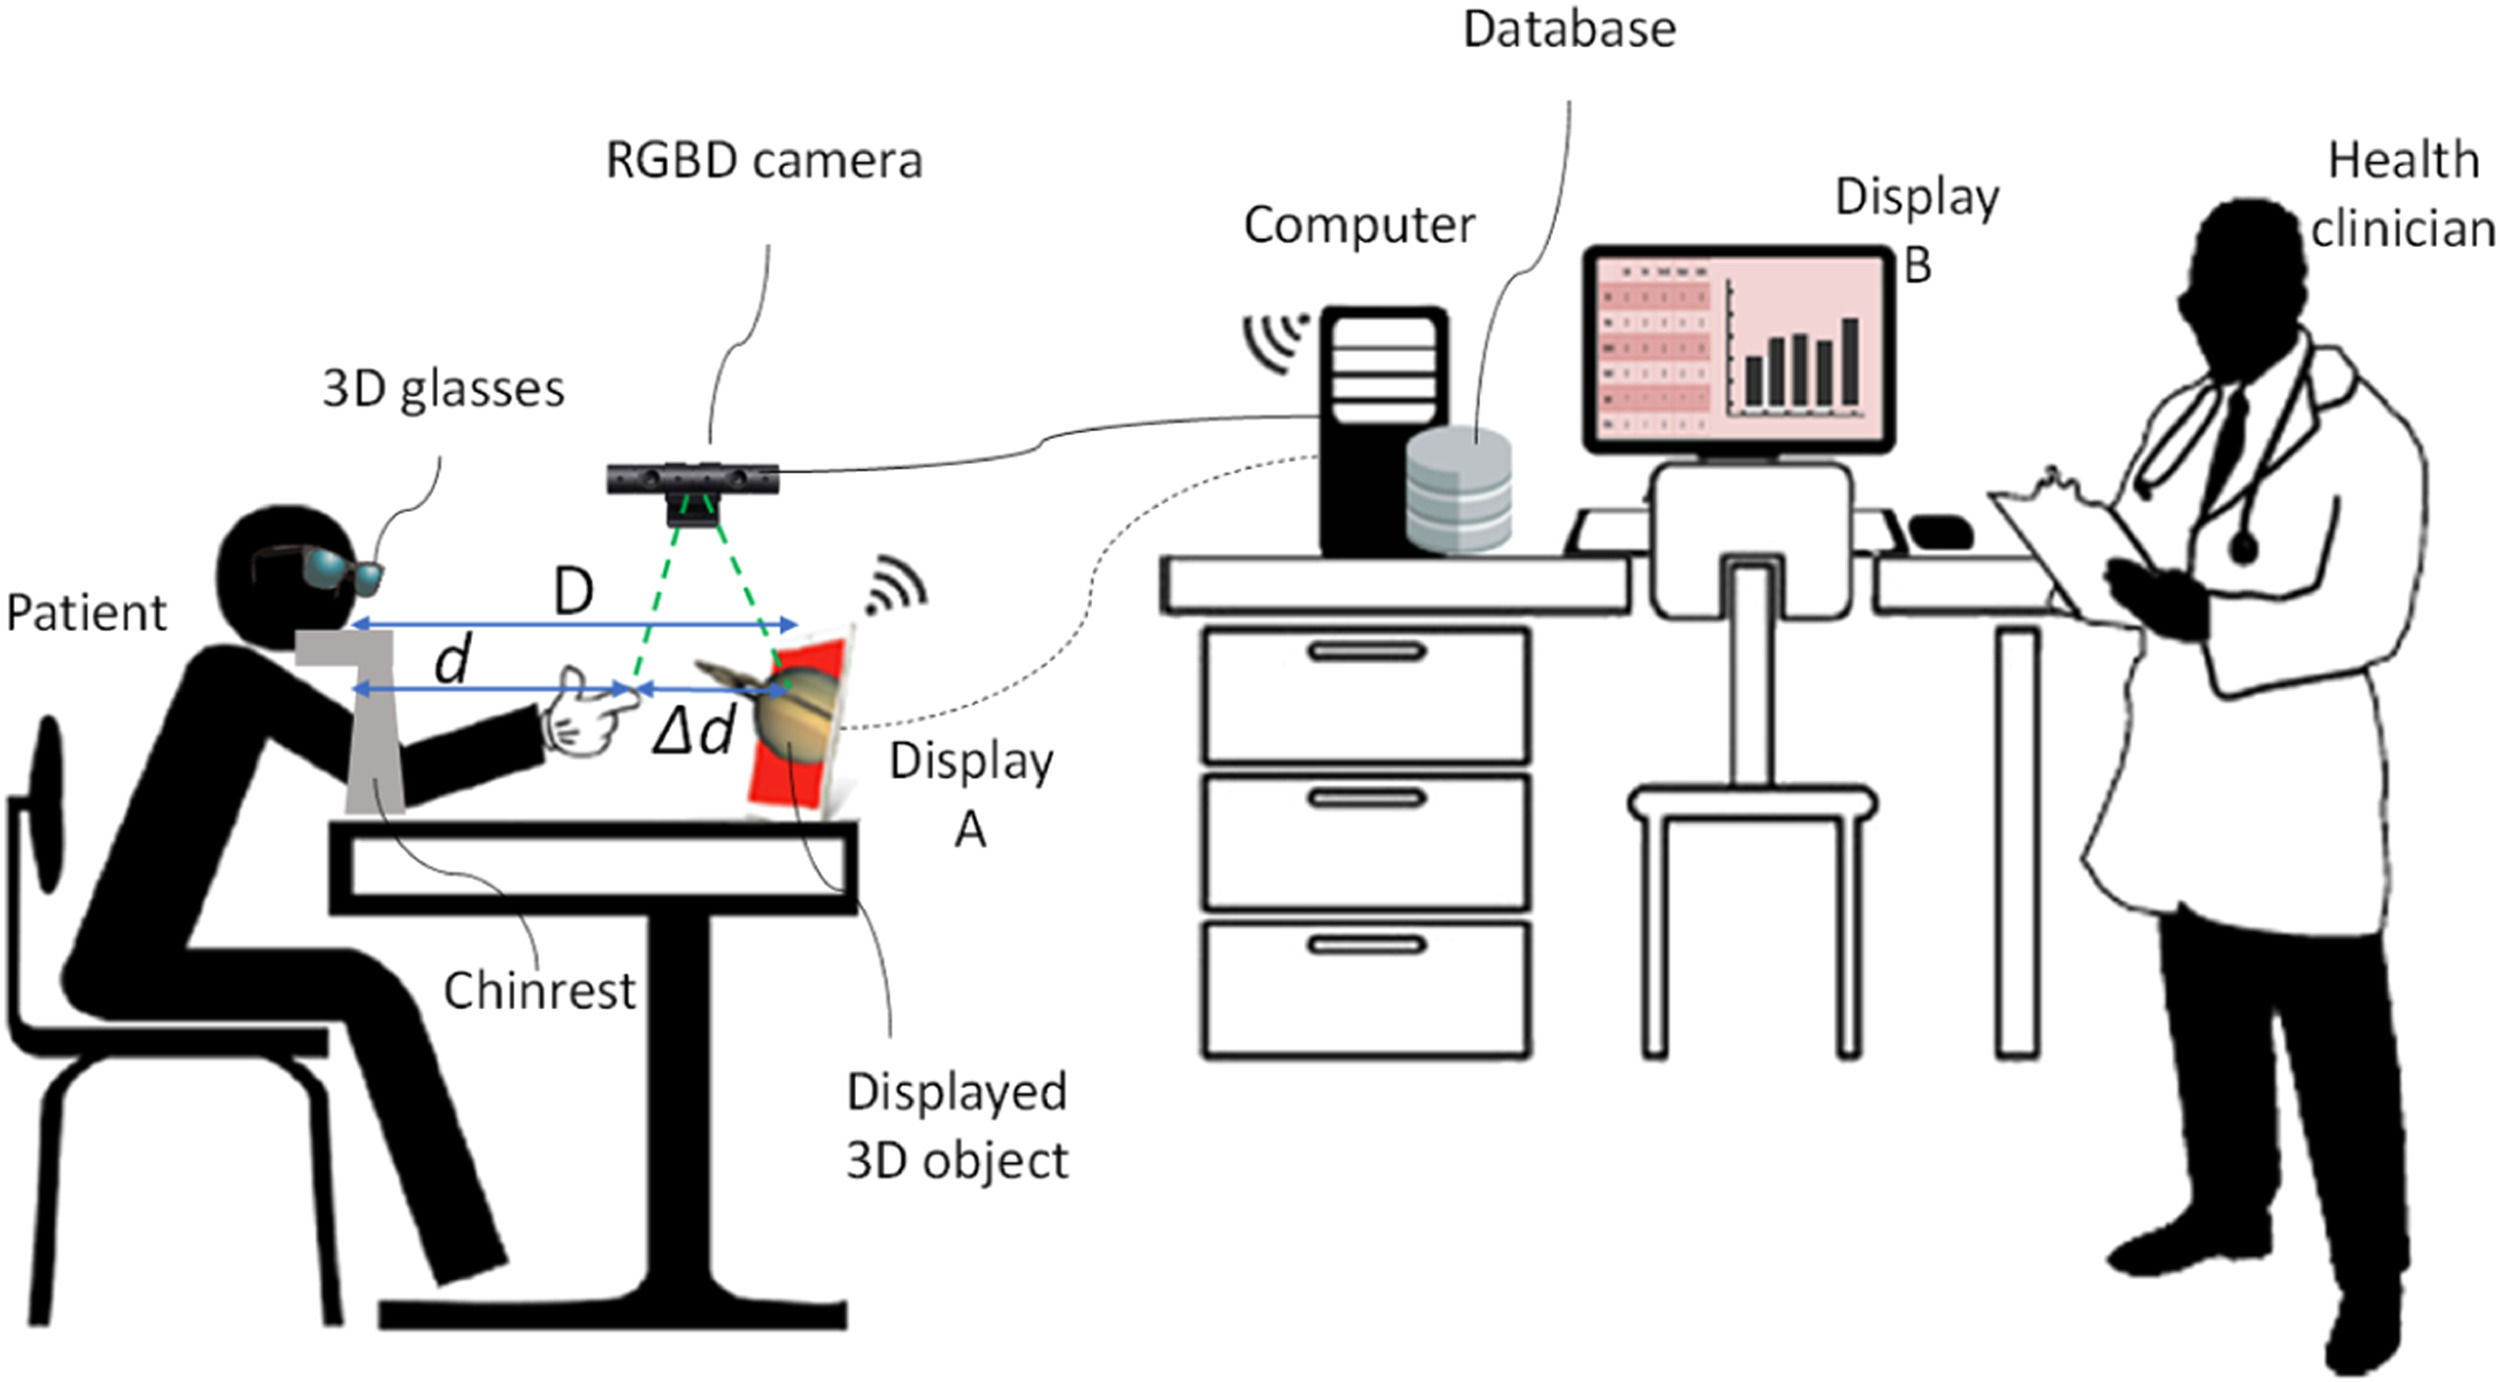
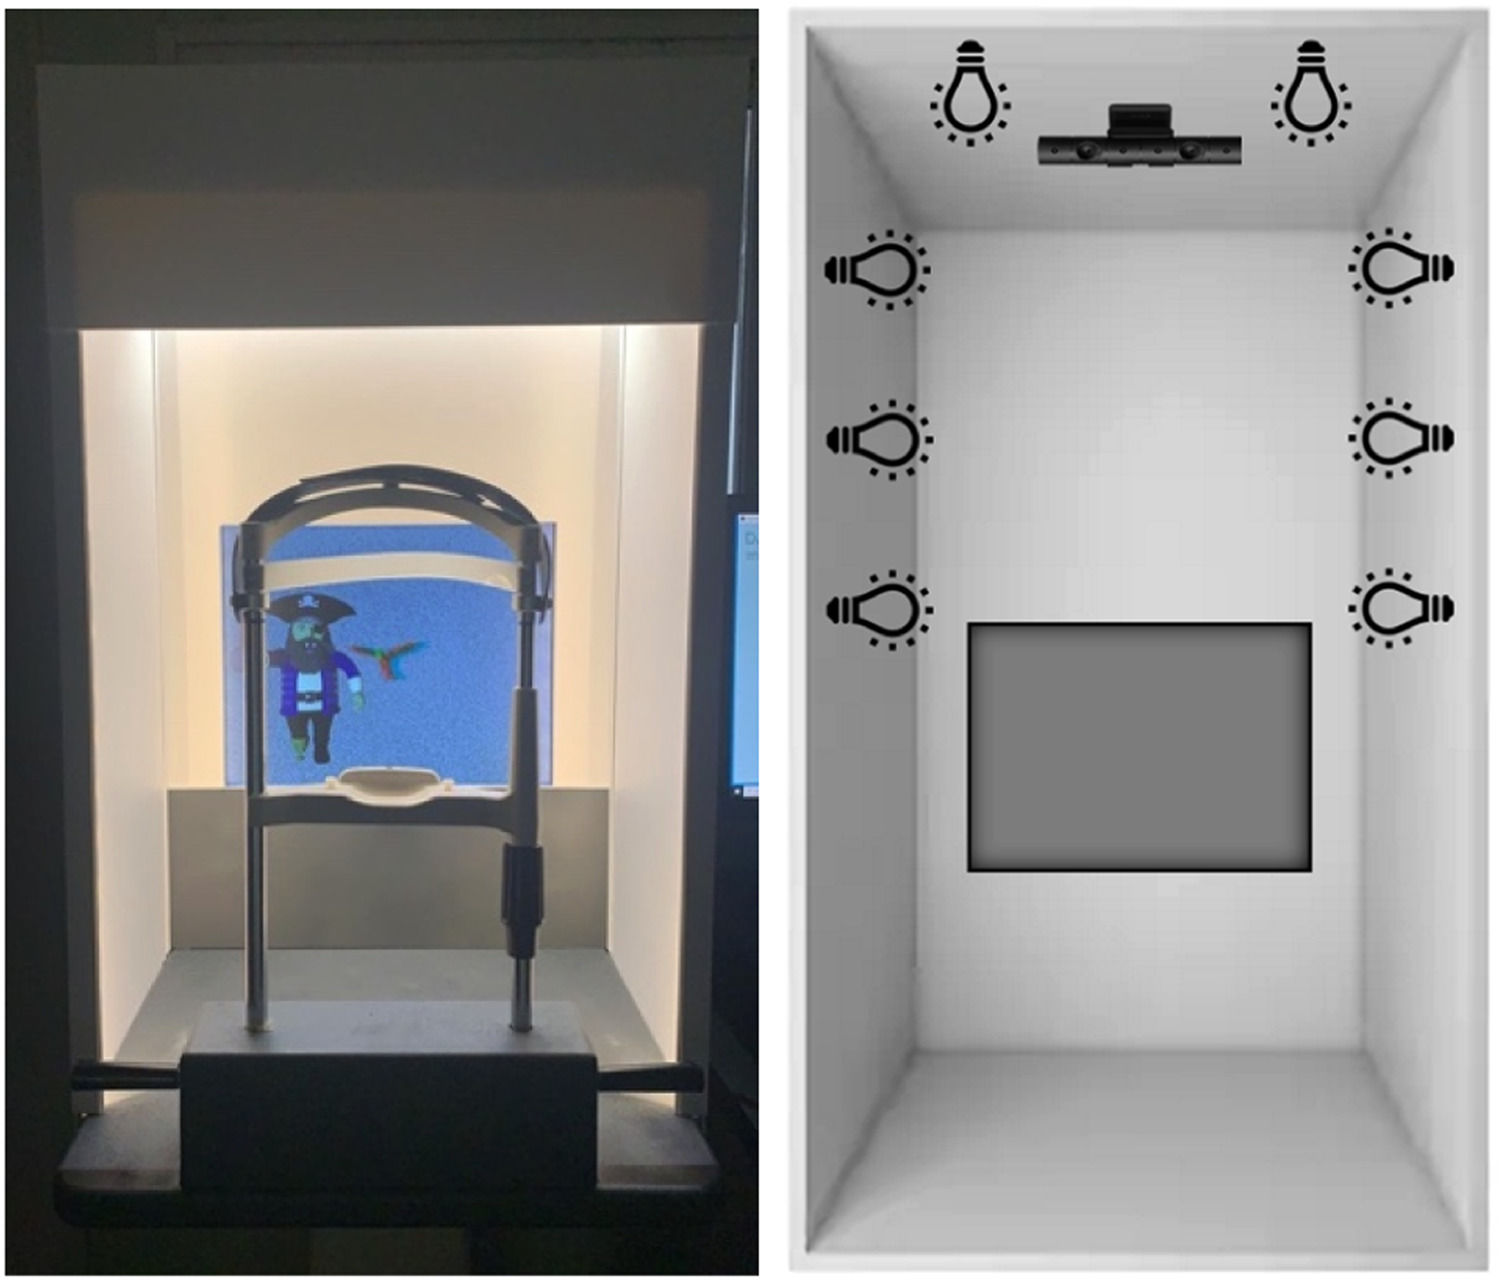
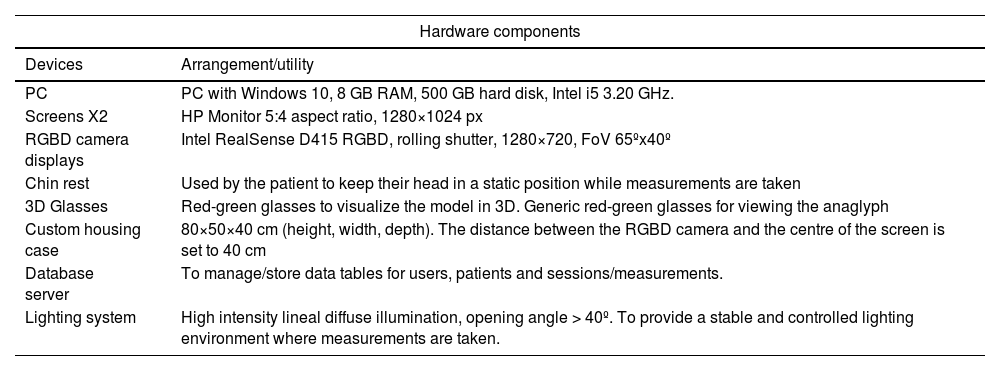
Materials and methodsPhysical components of the equipmentThe physical part of the system (hardware) includes (Table 1): (a) a three-dimensional display screen configured to show stereoscopic anaglyphs previously stored in a database; (b) a chin rest upon which the subject's chin is placed, positioned 40 cm from the viewing screen; (c) red–green 3D glasses; (d) an upper camera that measures the distance between the tip of the index finger and the monitor using computer vision technology; (e) a computer with the processing unit configured to manage the equipment software; and (f) a second monitor that can be viewed by the clinician (Fig. 1). Devices a, b, and d are incorporated into a compact system with custom housing and its own lighting system (Fig. 2).
Hardware components.


Additionally, the software comprises:
Patient applicationThat includes stereoscopic models; a graphical interface with a 3D object viewer; and a module for communication with the clinician application.
Clinician applicationThat includes a data processing unit connected to a camera equipped with a module for assessing depth perception using computer vision processing algorithms and technology; a program designed to measure the distance between a point in space indicated by the subject with respect to the 3D monitor; a patient database manager for analysing progress over time; a module for communication with the patient application; and data storage.
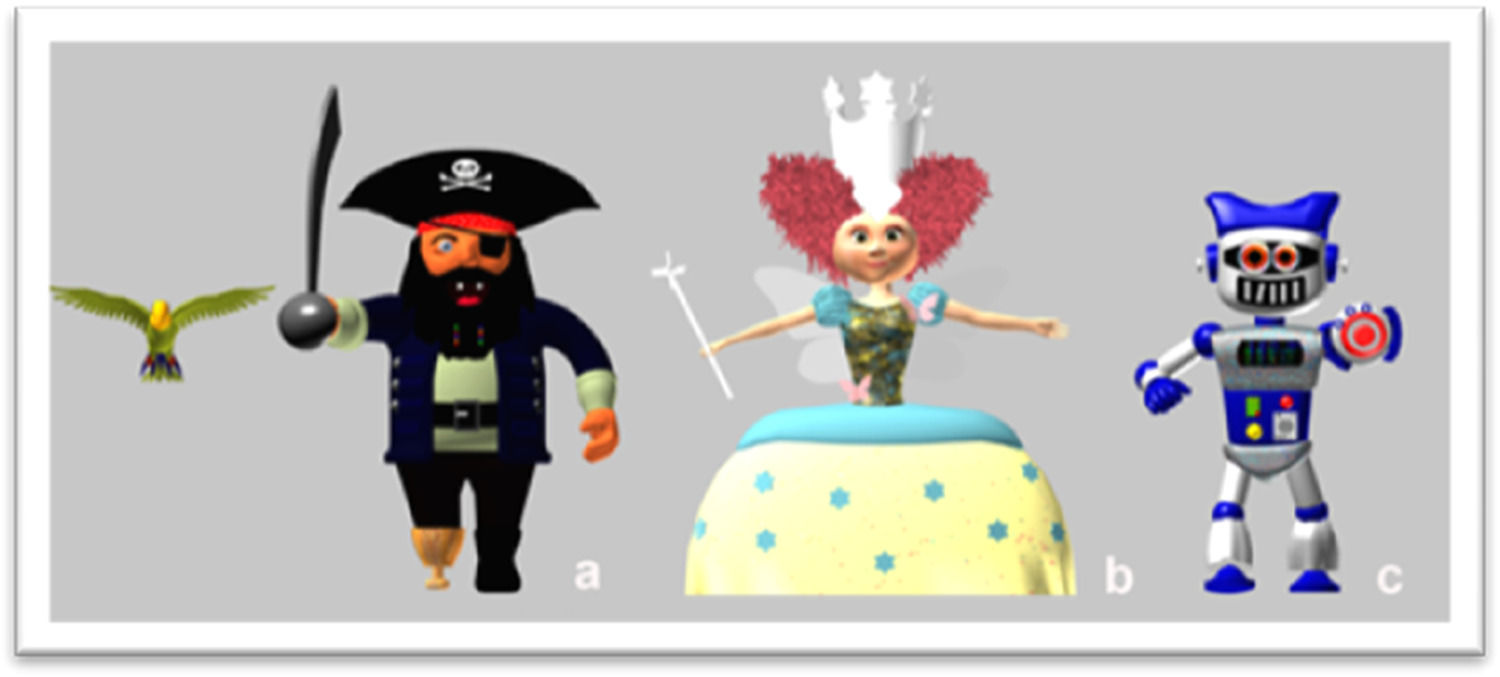
Creation of the modelsGraphic design and professional 3D animation software were used to model, texture and generate multimedia content for three original characters, developed to be attractive to children: parrot-pirate, fairy and robot (Fig. 3).

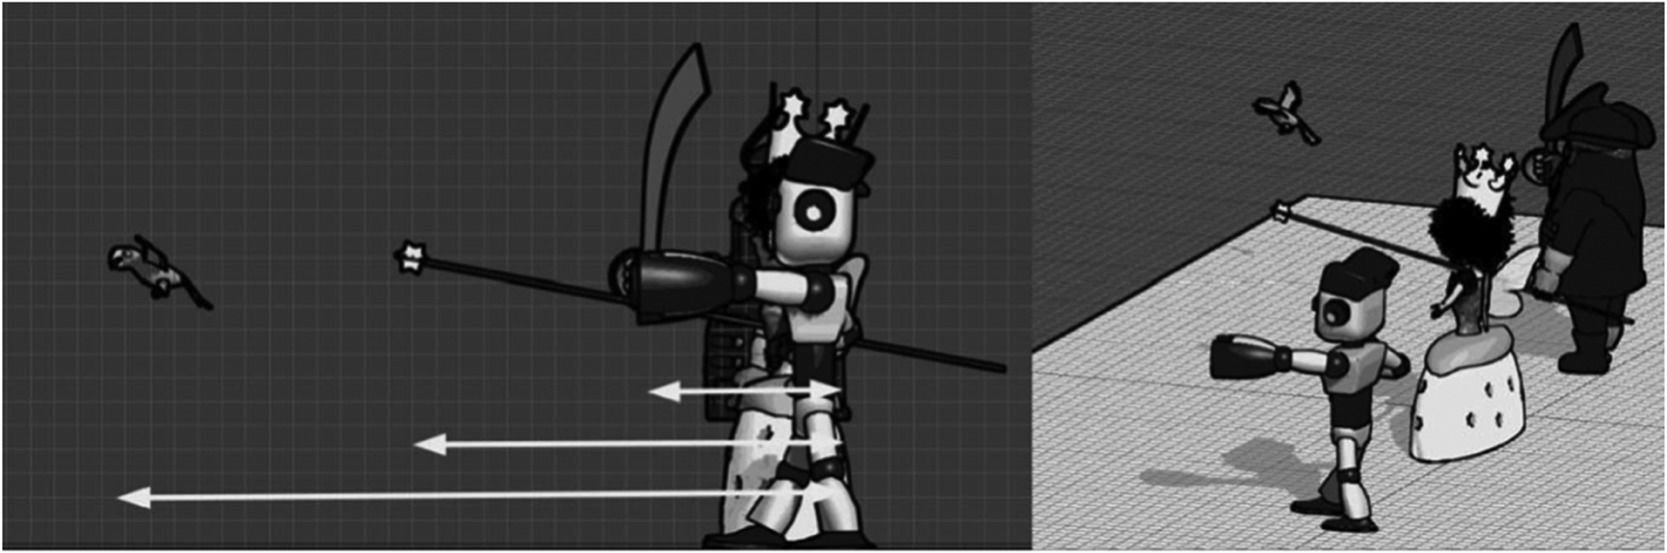
These are 3D models of complex figures that are located in the most distal plane and have a reference point (guide point) that the subject must point to with the tip of their index finger. The character and guide point are displayed so that there are no monocular cues that are helpful for the user to determine the distance between the objects. Each of these guide points appears at a different distance: further away in the parrot-pirate and closer in the robot (Fig. 4). This way, it will be easier to detect stereopsis with the parrot-pirate and more difficult with the robot, being the fairy the intermediate difficulty.
.")
The guide point (parrot's beak in the pirate model, tip of the magic wand in the fairy model, and end of the fist in the robot model), is located (1) in the monitor centre, and (2) shifted to one side respect the main object, leaving the character displaced to one side; thus preventing monocular cues of superposition.
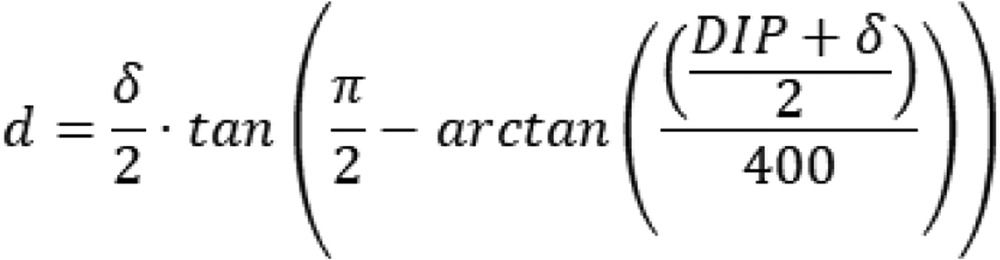
Using the known measurements of the design of the different images (IPD and distance of the figures on the screen (δ)), the exact point where subjects should place their fingertip for detection by the camera was calculated mathematically in milimeters (Fig. 5), i.e., the geometric prediction.
 of each patient, and the distance of the figures on the screen (δ).")
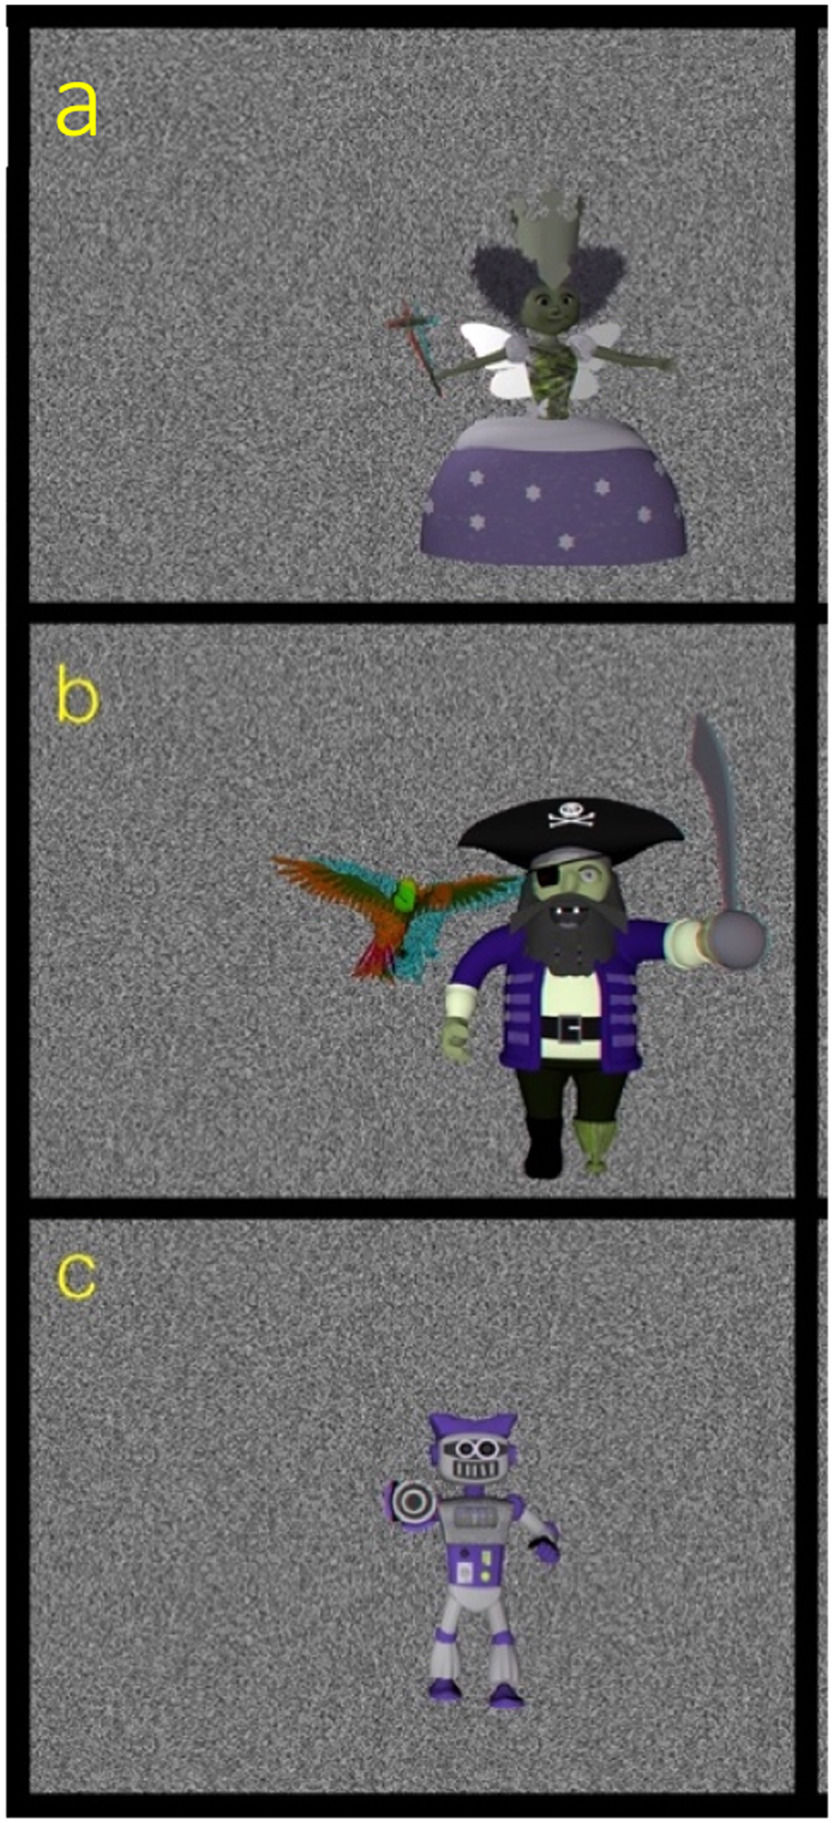
The models are shown with a background image that allows clear separation between the background and the 3D model. To that end, a background with a white noise random-dots pattern was used, as shown in Fig. 6.
 stereoscopic model of a fairy with a magic wand with a star at the tip, leaning forward; (b) stereoscopic model of a pirate with a parrot flying ahead at a certain distance; (c) stereoscopic model of a robot with the left fist outstretched.")
Images of each of the stereoscopic models: (a) stereoscopic model of a fairy with a magic wand with a star at the tip, leaning forward; (b) stereoscopic model of a pirate with a parrot flying ahead at a certain distance; (c) stereoscopic model of a robot with the left fist outstretched.
The sample size was calculated in order to detect significant differences between different stereopsis grades, assuming an α error of 5 % and a ß error of 10 %. Based on these calculations, the number of subjects needed was at least 80.
The study included 94 healthy volunteers who met the following inclusion criteria: (1) age range: 4–65 years; (2) corrected visual acuity 20/20 or higher; (3) absence of far and near tropia by cover test; (4) correct fusion with Worth light test; (5) measurable stereopsis on the Randot Stereostest; (6) absence of past or current eye or systemic diseases.
In the study, a descriptive analysis of the demographic and clinical variables of the subjects was carried out. Quantitative variables are summarized by mean, median, and standard deviation. Categorical variables are reported as frequencies and percentages.
MethodologySubjects were examine and included by ophthalmologist investigators. Each of the participating subjects underwent an anamnesis, including their age and sex, and an ophthalmological examination that included autorefractometry (including IPD), visual acuity, biomicroscopy, fundoscopy, cover test, Worth test, and eye dominance. The subjects’ depth perception was then analyzed using the DALE3D platform.
In addition, a stereopsis study was performed using the following standard stereoscopic tests: Lang I and II (Vision Assessment Corporation, Illinois, USA), TNO (TNO test for stereoscopic vision, 5th edition, Lameris Ootech, Nieuwegein, Netherlands) and Randot (Cicle test, Stereo Optical Company, Inc., Chicago, Illinois). The Randot circles test was selected for the DALE3D correlation study because it offers the most levels of stereoacuity.
Examination using standard stereoscopic testsDifferent types of stereoscopic tests were used: continuous contour-based (Randot test) and random-dot tests (Lang I and II test, and TNO test). All show haploscopic images whose stereoacuity is measured in seconds of arc (arcsec). Lang I and Lang II are panoscopy based test that do not require a separation between the eyes, whereas the TNO is anaglyphic and Randot is vectrogaphic (polarization based separation between the eyes).
Randot testThis test consists of three tests: the butterfly, circles and animals, and measures disparities from 3000 arcsec (“the butterfly”) to 40 arcsec (“the nine circles”). During the test, stereoscopic images mixed with 2D flat images are presented, and the subject has to detect the stereoscopic images from among them using polarized glasses. The pictures are located 40 cm from the subject, in a well-lit environment.15
Lang tests I and IIThese are three-dimensional plastic cards that show the subject at a distance of 40 cm, in a well-lit environment, detecting disparities from 1200 to 200 arcsec.16
TNO testThe stereograms are presented to the subject at 40 cm, and viewed through complementary red/green glasses. In particular, plates of “pancakes” (plates V–VI) which detect disparities between 480 and 15 arcsec were presented.16
Examination using the DALE3D platformAfter the clinician has entered the subject's personal data into the system, the subject is positioned in front of a monitor. The monitor is configured to display patient-viewable 3D models that are stored in a database. The subject, wearing red–green anaglyph 3D glasses, rests their chin on a chin rest. The monitor is located 40 cm away from the chin rest to allow the subject to touch the monitor with their index finger by extending their arm. The clinician instructs the subject to try to touch the guide point of the stereoscopic model with their fingertip and to hold the fingertip at that point. The camera detects the subject´s index finger and measures the distance to the monitor in milimetetres (distance d in Fig. 1).
Three measurements are taken for each of the three models presented sequentially, from highest to lowest geometric prediction.
Test validationTo validate the test, the repeatability and reliability of the test were calculated, analyzing the data using R software (version 4.0.2).
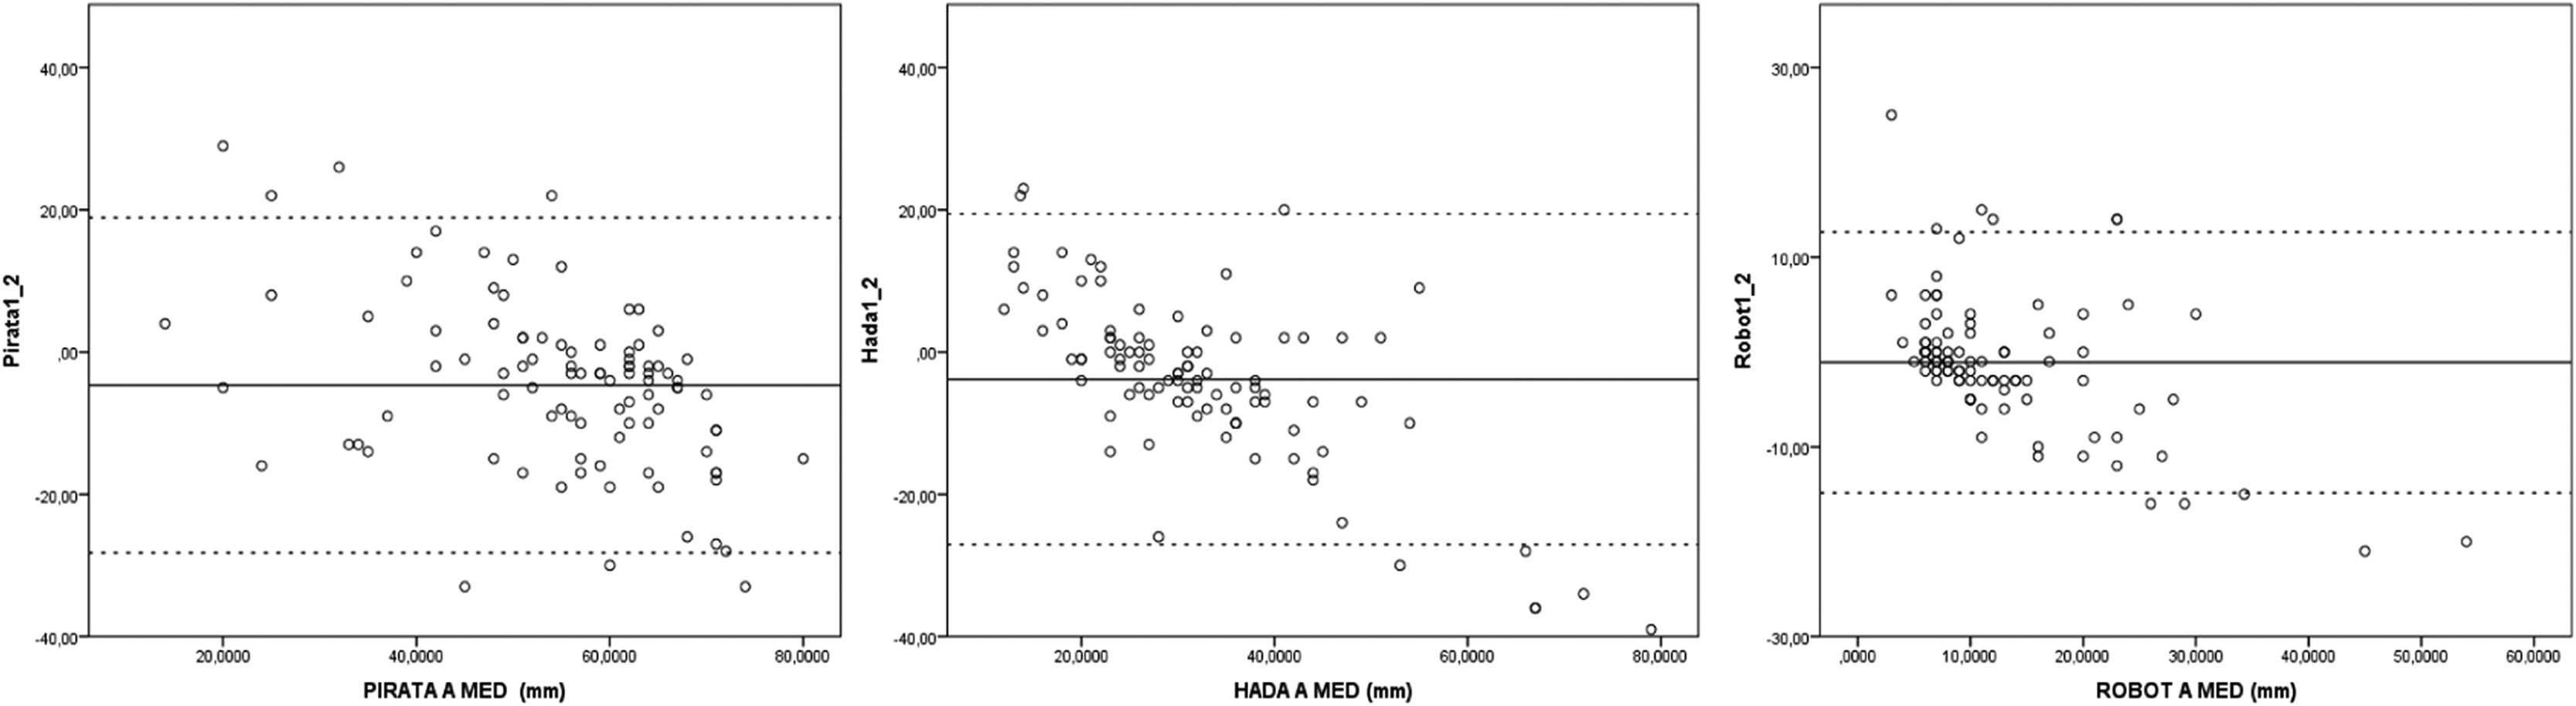
RepeatabilityMeasurements A, B and C for each model (pirate, fairy and robot), made by the same subject, were analyzed. To that end, the coefficient of variation (CV) and the intraclass correlation coefficient (ICC) were used, and represented by Bland–Altman plots.
ReliabilityUsing Spearman's correlation coefficient, the correlation between the Randot test and the results of the DALE3D test was calculated.
Additionally, to compare the results of the Randot test (arcsec) with those of the DALE3D platform (mm), a threshold was established to determine stereopsis as optimal or suboptimal in both tests. Consequently, contingency tables were developed to calculate the positive predictive value (PPV), negative predictive value (NPV), sensitivity (Se) and specificity (Sp) for each of the models of the DALE3D platform.
Subgroup analysisTo assess possible differences between different groups of the study sample (sex, age, spherical equivalent, IPD), subgroup analyses was performed. After verifying that the variables did not conform to normal using the Kolmogorov–Smirnov test, non-parametric tests were used. The Mann–Whitney test was used to compare two groups and the Wilcoxon test was used to compare more than two groups.
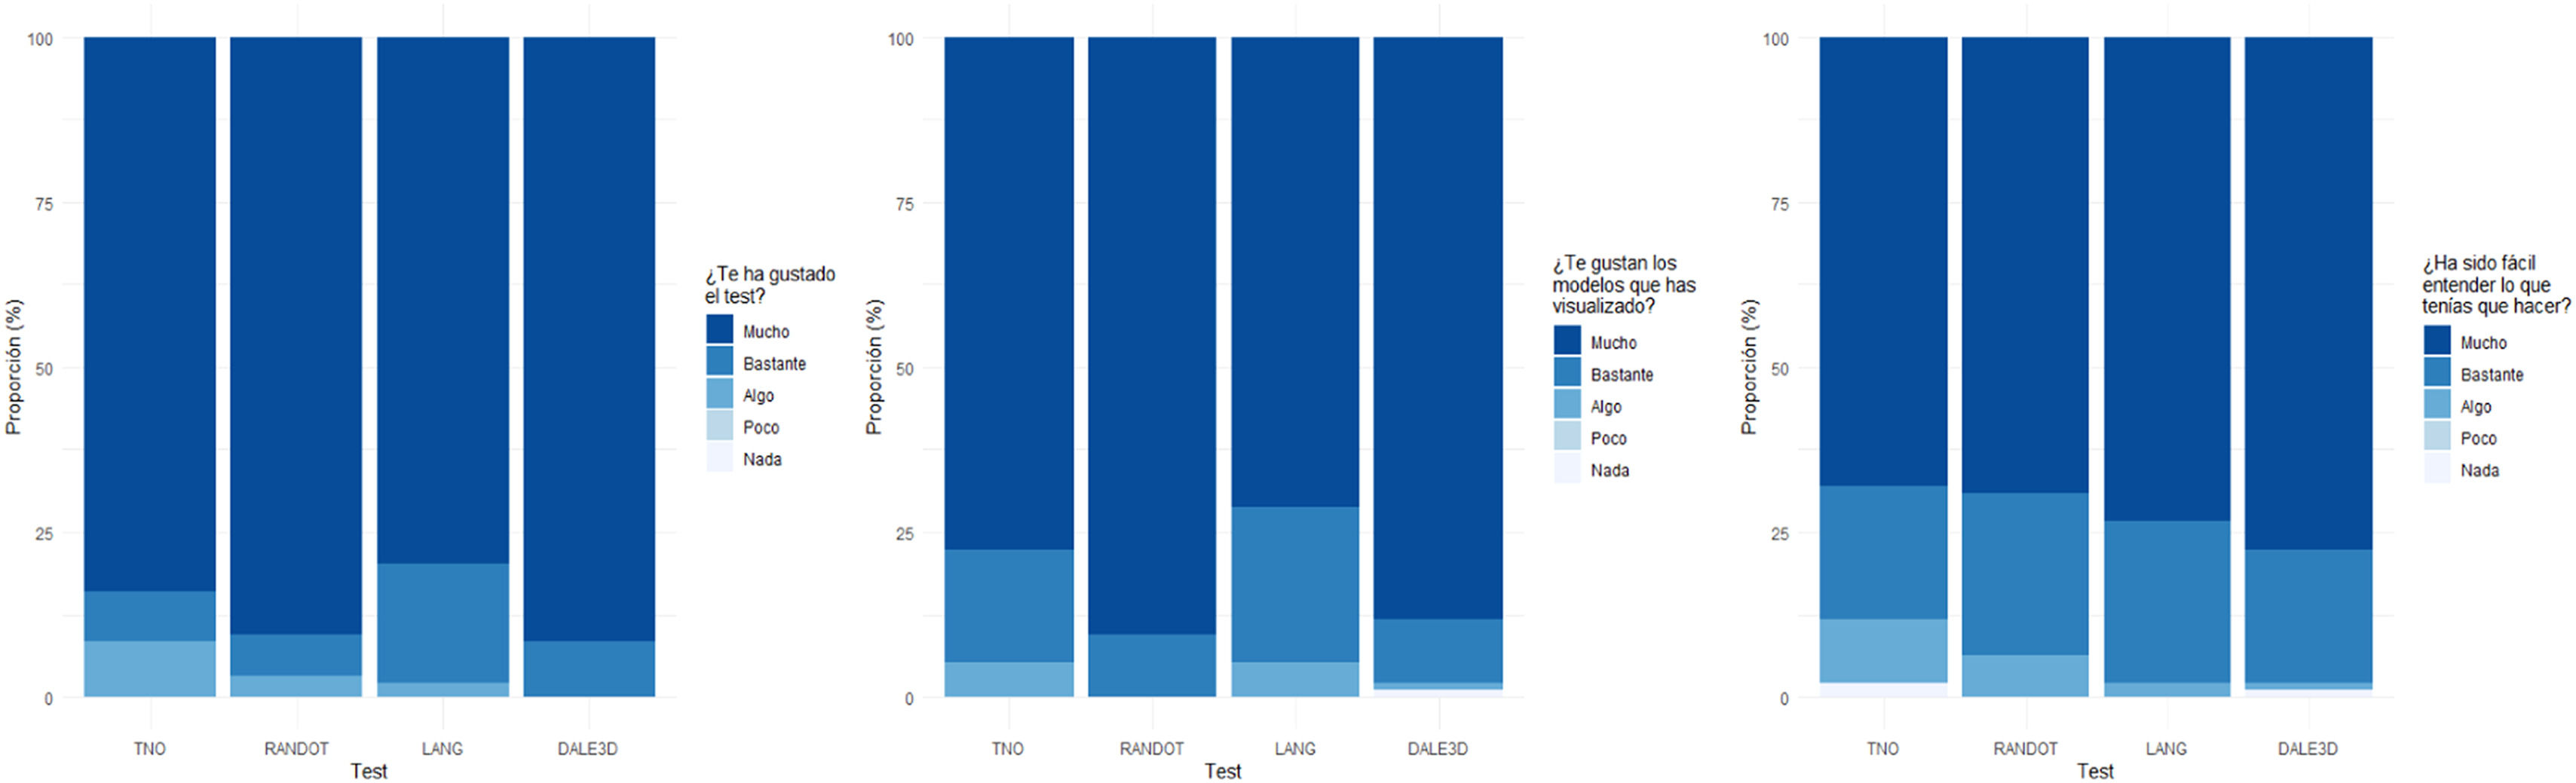
Satisfaction surveyEach subject was given a satisfaction survey for the different stereopsis tests (TNO, Randot, Lang and DALE3D) with a score of 1(worst) to 5 (best) represented by emoticons. Three question about each test were asked: Did you like the test? Did you like the images shown? Was it difficult to understand?
EthicsThe studies of this diagnostic platform were carried out in accordance with the Declaration of Helsinki and approved by the Clinical Research Ethics Committee of the Hospital General de Elda (Alicante) / FISABIO (Foundation for the Promotion of Biomedical Health Research of the Valencian Community). All participating subjects were informed about the study and signed written informed consent to participate; confidentiality and data protection was guaranteed in accordance with Spanish data protection law (Organic Law 7/2021).
ResultsDescriptive analysis of the sampleThe study included 94 subjects, 25 children and 69 adults, with a mean age of 34.2 ± 18.9 years; 36.2 % were men and 63.8 % were women. Two-thirds of participants (60.6 %) showed right ocular dominance compared to 39.4 % with left ocular dominance. The spherical equivalent of both eyes showed a myopic tendency (OD −0.17 ± 2.4; OS −0.01 ± 2.4). The mean IPD recorded was 61.3 ± 4.67 mm (Table 2).
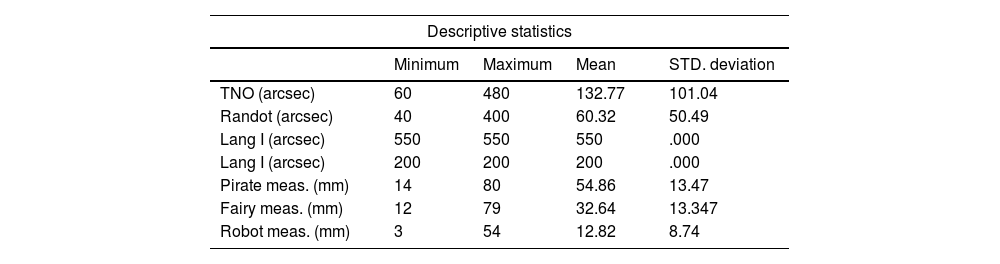
The mean results of the standard stereoscopic tests are shown in arcsec, obtaining a maximum for stereoacuity with the Randot test (60.32 arcsec) and a minimum with the Lang I test (550 arcsec). With respect to the DALE3D platform, depth perception is shown in mm, the maximum being in pirate model (54.86 mm) and the minimum in robot (12.82 mm) (Table 3).
RepeatabilityThe DALE3D platform obtained very good repeatability with an ICC (Table 4) close to 1 in all models (0.94–0.87), and CV (Table 5) between 0 % and 5 % in all models (0.1–0.26). It is represented by Bland Altman plots for each model in Fig. 7.

We found a weak correlation (0-0.4) that did not reach statistical significance (p value > 0.05) (Table 6).
Correlation between DALE3D and the geometric predictionWe found a weak correlation (0–0.4) that did not reach statistical significance (p value > 0.05) in all models (Table 7).
Comparision Randot and DALE3DThreshold determinationRandot test thresholdThe stereoacuity threshold in the general population was set at 60 arcsec.17 Therefore, values on the Randot circles test less than or equal to 60 arcsec were considered optimal, and values greater than 60 arcsec were suboptimal.
DALE3D thresholdUsing the known measurements of the design of the different images, the exact point where subjects should place their fingertip for detection by the camera was calculated mathematically (Fig. 6), i.e., the geometric prediction (distance “d” in Fig. 1).
Table 8 shows the mean and standard deviation of the calculated geometric prediction for each model.
To obtain the threshold, the mean of the difference of the geometric prediction and the mean of the DALE3D measurement in each of the models was calculated (Table 9).
Measurements with a value greater than or equal to the threshold were considered optimal, while measurements with values less than the threshold were considered suboptimal.
Contingency tablesThe overall sensitivity and specificity of the DALE3D platform was 50 % in both cases. The overall positive predictive value was 15 % and the overall negative predictive value was 80 % (Table 10).
Subgroup analysisNo statistically significant differences were observed between the two age groups: children (0–18 years) and adults (>18 years) (p value > 0.05), either in the standard stereoscopic tests or in the DALE3D test (Table 11).
Among the groups established according to the spherical equivalent (hyperopia and emetropia, and myopia), no statistically significant differences (p value > 0.05) were observed in any of the stereoscopic tests (Table 12).
The analysis of depth sensation according to sex (male or female) showed statistically significant differences (p value < 0.05) in all models, with higher measurements in females than in males (Table 13).
In terms of the correlation between the IPD and the depth sensation detected, no statistically significant differences were obtained in any of the models (p value > 0.05) (Table 14).
Satisfaction surveyThe test that was most liked was the DALE3D (90 % of the maximum score) and the least liked was the Lang test. The favourite models were the DALE3D (88 % maximum score) and the least popular were those of the Lang test. The test reported as the easiest to perform by the participants was the DALE3D (73 % very easy) and the most difficult to perform was the TNO test (Fig. 8).
Discussion
The DALE3D platform consists of a system for measuring depth sensation using computer vision technology and 3D models. This is a double innovation that represents advances in both the method of measurement, overcoming the limitations of the traditional tests, and the parameter to be measured, i.e., depth perception.
With respect to the method of measurement, the repeatability of the machine was studied and showed very favourable results in all models (ICC close to 1, and CV between 0 % and 5 %).
The measurement of stereopsis is especially important in childhood to screen for amblogenic factors that are most successfully treated in this population group.7 Therefore, it is important that stereoscopic tests are suitable for children, in terms of difficulty and visual appealing. This study has shown that there are no significant differences in outcomes obtained by adults compared to children (p value >0.05). In addition, the results of the satisfaction survey report the DALE3D platform as the preferred method of measurement due to its attractive models and simplicity of implementation.
On the other hand, as regards the objective to be measured, the new platform offers the possibility of evaluating stereopsis by measuring depth perception. Depth perception is understood as the sensation of three-dimensionality described by the subject. As it is a perception described by the individual himself, this concept is subjective and even changeable, and therefore difficult to correlate with both the routine tests and the geometric prediction (Spearman 0–0.4, and p value > 0.5).
Given the weak correlation obtained, the results in terms of sensitivity and specificity (50 % in both cases) show that the measurement of depth perception using the DALE3D platform is not a reliable system as a diagnostic method for stereoscopic impairments.
Therefore, limitations of this study can be summarize as follows: (1) The main limitation of this study is that depth perception concept is subjective, necessitating future research lines on stereopsis evaluation, which rethinking of this concept in order to develop a measurement system that can provide objective quantification of this parameter. (2) The use of anaglyphic separation between the eyes, which has been shown to induce differences in perception, leading to reduced stereothresholds. For instance, the TNO test notoriously yields higher thresholds compared to other stereotests.18 (3) Cost is not set as this is a prototype but it is stimated to be higher than traditional tests.
ConclusionThe DALE3D platform is a potentially useful tool for measuring depth perception. Its innovative design makes it a more visual appealing and easier-to-use tool for children than current stereoscopic tests. However, depth perception measured using the DALE3D platform is not sufficiently reliable to assess stereopsis.
Key messages- 1
In current clinical practice stereopsis is detected by haploscopic devices which have some limitations.
- 2
The DALE3D platform offers the possibility of evaluating stereopsis by measuring a new concept: depth perception.
- 3
The platform presents an innovate design, being more attractive and easier-to-use tool for children than current stereoscopic tests.
- 4
Depth perception measured using DALE3D platform is not sufficiently reliable to assess stereopsis.
The project was funded by a UPV-FISABIO grant (Ref. UPV-FISABIO-2017-002-939) for the realization of preparatory activities to support the exploration and development of Research/Innovation Projects and by a UPV-FISABIO grant (Ref. UPV-FISABIO-2019-B19) to support the development of innovation projects, provided by the Polytechnic University of Valencia (UPV) and the FISABIO Foundation of the Ministry of Health and Public Health.


