

To determine whether the assessment of visual acuity ratios might improve the referral of children with (sub)normal visual acuity but at risk of cerebral visual impairment.
MethodsIn an exploratory study, we assessed visual acuity, crowding ratio and the ratios between grating acuity (Teller Acuity Cards-II) and optotype acuity (Cambridge Crowding Cards) in 60 typically developing school children (mean age 5y8m±1y1m), 21 children with ocular abnormalities only (5y7m±1y9m) and 26 children with (suspected) brain damage (5y7m±1y11m). Sensitivities and specificities were calculated for targets and controls from the perspective of different groups of diagnosticians: youth health care professionals (target: children with any visual abnormalities), ophthalmologists and low vision experts (target: children at risk of cerebral visual impairment).
ResultsFor youth health care professionals subnormal visual acuity had the best sensitivity (76%) and specificity (70%). For ophthalmologists and low vision experts the crowding ratio had the best sensitivity (67%) and specificity (79 and 86%).
ConclusionYouth health care professionals best continue applying subnormal visual acuity for screening, whereas ophthalmologists and low vision experts best add the crowding ratio to their routine diagnostics, to distinguish children at risk of visual impairment in the context of brain damage from children with ocular pathology only.
Determinar si la valoración de los ratios de agudeza visual en niños podría mejorar la derivación de niños con agudeza visual (sub)normal, pero con riesgo de discapacidad visual cerebral.
MétodosEn un estudio exploratorio, valoramos la agudeza visual, el ratio de aglomeración y los ratios comprendidos entre la agudeza de difracción (Teller Acuity Cards-II) y la agudeza visual de optotipos (Cambridge Crowding Cards) en 60 escolares con desarrollo normal (edad media 5.8±1,1), 21 con anomalías oculares únicamente (5,7±1,9) y 26 niños con daño cerebral (sospechado) (5,7±1,1). Las sensibilidades y especificidades fueron calculados para los casos de estudio y controles desde la perspectiva de diferentes grupos de evaluadores: profesionales sanitarios para jóvenes (objetivo: niños con cualquier anomalía visual), oftalmólogos y expertos en baja visión (objetivo: niños con riesgo de discapacidad visual cerebral).
ResultadosPara los profesionales sanitarios para jóvenes la agudeza visual obtuvo la mejor sensibilidad (76%) y especificidad (70%). Para los oftalmólogos y los expertos en baja visión el ratio de aglomeración obtuvo la mejor sensibilidad (67%) y especificidad (79 y 86%).
ConclusiónLos profesionales sanitarios para jóvenes siguen aplicando la agudeza visual inferior a lo normal en los exámenes visuales, mientras que los oftalmólogos y los expertos en baja visión incorporan el ratio de aglomeración a sus diagnósticos rutinarios, para distinguir a los niños con riesgo de discapacidad visual en el contexto del daño cerebral, de los niños con patología ocular únicamente.
Childhood cerebral visual impairment often goes unrecognised, especially in case of mild brain damage which has remained obscure, delaying rehabilitation to support normal development. Dutch youth health care physicians (physicians providing preventive services), paediatricians and paediatric ophthalmologists indicated difficulties in recognising higher visual problems and expressed the need for clear diagnostic guidelines, whereas experts of low vision services indicated that it is not efficient to perform time-consuming assessments of cerebral visual functions, e.g. object and face recognition, in all referred children. They expressed the need for a quantitative, evidence-based measure that could help with the selection.1
Hård et al.2 suggested that ‘crowding’ might be an indicator for visual perception problems. Crowding is the phenomenon of impaired discrimination of visual stimuli in the middle of other stimuli.3 Abnormal crowding may show in daily life as difficulties handling complex visual situations, for example finding a toy in a toy box or coping with busy environments like supermarkets; reading may be hampered, as well as visual acuity testing with routinely used cards.4 It may either concern a selective attention problem, negatively influencing specific higher perceptual functions,5 or it might be a failure in the neural development of small integration fields.6 In both instances, crowding might predict (unidentified) brain damage and, indirectly, visual perception problems.7–9
Children without any neurological impairment who have developmental visual problems, like strabismic amblyopia, are also at risk of crowding10,11 as well as of cerebral visual impairments, for example motion-defined form perception.12 All these visual problems in both children with amblyopia13 and children with cerebral visual impairment are associated with anatomical and functional abnormalities of the brain's visual system.13,14
If, indeed, abnormal crowding is more common in children with brain damage than in other children, a small addition to routine visual acuity assessment might improve the detection of children at risk of cerebral visual impairment. Instead of a single acuity test, two tests at the same test distance would have to be performed, namely a test with a single optotype and a test with multiple optotypes, after which the difference can be expressed as a ratio. Studies comparing grating acuity (Teller Acuity Cards) with optotype acuity (single and/or multiple optotypes) also indicate that larger differences between acuities are found in children with strabismic amblyopia11 and children with brain damage15 than in normally developing children and children with ocular disorders.11,15
Therefore, the first aim of this exploratory study was to assess whether the crowding ratio, estimated by the Cambridge Crowding Cards (optotypes), and the ratio between grating acuity and optotype acuity, differentiate better than visual acuity alone between children without any neurological and ocular abnormalities, children with ocular disorders only, and children with (indications of) brain damage.
In clinical practice, different levels in the care supply chain, i.e. youth health care physicians or nurses, ophthalmologists, and experts in low vision services, see different populations and have different detection goals and indications for referral.
Therefore, our second aim was to study which parameter (visual acuity alone, different ratios) for each level has the best sensitivity and specificity to meet their detection goal.
MethodsFor this cross-sectional study, a heterogeneic group of 107 children in the age range 3–12 years was recruited in the Rotterdam area through primary schools, two rehabilitation centres, and the Rotterdam Eye Hospital. For all participants, informed consent was obtained from their parents or guardians.
Medical files and the children's histories were used to categorise participants as ‘typically developing without indications of neurological or ocular abnormalities’ (group 1), ‘ocular abnormalities without indications of neurological abnormalities’ (group 2) and ‘(indications of) brain damage with or without ocular abnormalities’ (group 3). Cerebral palsy (CP) as well as visual problems not explained by ocular abnormalities were considered indications of brain damage. Children without neurological symptoms with high myopia or hyperopia (spherical error≥6D) were included in group 2, and those with smaller refractive errors in group 1.
To meet study aim 2, we had to compose different control and target groups per discipline. In order to refer properly, youth health care physicians want to identify all children with visual problems irrespective of their cause (target: groups 2 and 3, controls: group 1), whereas ophthalmologists and specialists at low vision services want to differentiate between children at risk of cerebral visual impairment (target: group 3) and children with ocular abnormalities only (controls ophthalmologist: group 1 and 2, controls low vision centre: group 2). To this end, the following child characteristics were collected from the clinical files: visual acuity, refractive errors, use of glasses or lenses, strabismus, contrast sensitivity, other ocular abnormalities, and if present, aetiology of brain damage. Visual fields were checked using the confrontation test. Although refractive errors and strabismus are associated with crowding problems, these children were not excluded from the analyses, because this reflects clinical practice.
The study adhered to the Declaration of Helsinki and the protocol has been approved by the Medical Ethical Testing Committee of the Erasmus University Medical Center Rotterdam (MEC nr: 2006-056).
In the period June 2006–September 2010, visual acuity was assessed in all participants with the Cambridge Crowding Cards16 to assess uncrowded and crowded optotype acuity, and the Teller Acuity Cards-II17 to assess grating acuity. The uncrowded Cambridge Crowding Cards show a single letter and the crowded cards show a target letter surrounded by four letters, with a distance between letters of half a letter width. To minimise the effect of differences in test distance, the Teller Acuity Cards as well as the Cambridge Crowding Cards were presented at a distance of 3m. Outcomes of the Teller Acuity Cards were corrected for the greater than recommended presentation distance, using the following formula: cycl/deg=(test distance/57)×cycl/cm. Children were assessed binocularly, if applicable wearing their own glasses. Grating acuity was assessed first, followed by single and crowded optotype acuities. During Teller Acuity Card assessment, children were asked to actively point out the location of the stripes (left or right), and during optotype assessment, they had to name or match the target letter. All tests were started with coarse gratings/large letter sizes. Finer gratings/smaller letter sizes were presented until the child was unable to identify the correct position/letter. Maximally three cards were presented per visual acuity level and the visual acuity threshold was defined as the highest visual acuity level with two out of three correctly identified grating positions/letters. All assessments were performed by trained orthoptists.
To enable comparisons between grating and optotype acuities, we expressed all acuities in cycl/deg. We determined two cut-off values for crowded visual acuity, because in youth health care, children with ‘subnormal vision’ should be referred for ophthalmological examination, whereas ‘low vision’ is a traditional eligibility requirement for low vision services. Subnormal visual acuity was defined as a crowded acuity lower than 20cycl/deg (Snellen equivalent 6/9) for 3½–4½ year olds and lower than 30cycl/deg (Snellen equivalent 6/6) for older children (norms from The Cambridge Crowding Cards leaflet), whereas low vision was defined as a crowded acuity equal to or lower than 10cycl/deg (Snellen equivalent 6/18).18
Crowding was quantified as a crowding ratio (CR), which is defined as the acuity presenting a single optotype, divided by the acuity presenting several optotypes (linear optotype acuity). Because linear acuity tests mostly result in lower visual acuities than single optotype testing, the crowding ratio is usually higher than 1.16 In typically developing children, there is a developmental effect, with a mean crowding ratio (CR 1.8) in 3–4 year olds, decreasing with age.19 Therefore, a crowding ratio≥2 (i.e. halving of the visual acuity outcome) was considered as the standard for abnormal crowding, irrespective of age or developmental level.
The following ratios were calculated for each participant: crowding ratio (uncrowded/crowded optotype acuity), grating acuity/uncrowded acuity, grating acuity/crowded acuity. Mean (SD) and median ratios were calculated for the three participant groups. Between-test differences were analysed with Friedman and Wilcoxon Signed Rank tests and between-group differences with Kruskall–Wallis tests.
To answer the second study question, per specialist discipline, the proportion of correctly identified children-at-risk within the target group (sensitivity) and the proportion of correctly identified non-targets within the control group (specificity) were calculated. We plotted ROC-curves for crowded visual acuity and each ratio, to check which outcome and cut-off value could be used best by each discipline. If visual acuity, measured during the study, appeared different from the received information, the child was not excluded from the analysis or transferred to a different group, because we wanted to act on clinically defined risks. To be certain that the presence of abnormal crowding could not be explained by the presence of strabismus, risk factor for amblyopia, we calculated the correlation (Spearman's ρ) between a crowding ratio ≥2 and manifest or latent strabismus in the total study population.
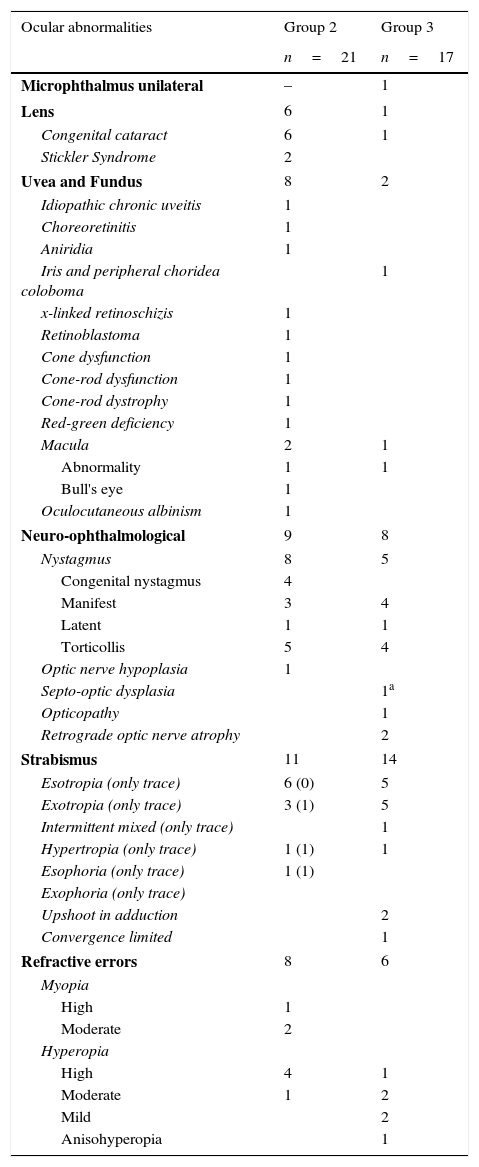
ResultsParticipantsSixty of the 107 children (25 boys, 35 girls) were included in group 1, 21 (11 boys, 10 girls) in group 2, and 26 (13 boys, 13 girls) in group 3. Ages of groups 2 and 3 did not differ significantly, whereas group 1 included significantly more young children (H(2)=9.17, p=0.01). Ocular abnormalities in groups 2 and 3 are presented in Table 1.
Ocular abnormalities present in subgroups of children with ocular abnormalities only and with brain damage.
| Ocular abnormalities | Group 2 | Group 3 |
|---|---|---|
| n=21 | n=17 | |
| Microphthalmus unilateral | – | 1 |
| Lens | 6 | 1 |
| Congenital cataract | 6 | 1 |
| Stickler Syndrome | 2 | |
| Uvea and Fundus | 8 | 2 |
| Idiopathic chronic uveitis | 1 | |
| Choreoretinitis | 1 | |
| Aniridia | 1 | |
| Iris and peripheral choridea coloboma | 1 | |
| x-linked retinoschizis | 1 | |
| Retinoblastoma | 1 | |
| Cone dysfunction | 1 | |
| Cone-rod dysfunction | 1 | |
| Cone-rod dystrophy | 1 | |
| Red-green deficiency | 1 | |
| Macula | 2 | 1 |
| Abnormality | 1 | 1 |
| Bull's eye | 1 | |
| Oculocutaneous albinism | 1 | |
| Neuro-ophthalmological | 9 | 8 |
| Nystagmus | 8 | 5 |
| Congenital nystagmus | 4 | |
| Manifest | 3 | 4 |
| Latent | 1 | 1 |
| Torticollis | 5 | 4 |
| Optic nerve hypoplasia | 1 | |
| Septo-optic dysplasia | 1a | |
| Opticopathy | 1 | |
| Retrograde optic nerve atrophy | 2 | |
| Strabismus | 11 | 14 |
| Esotropia (only trace) | 6 (0) | 5 |
| Exotropia (only trace) | 3 (1) | 5 |
| Intermittent mixed (only trace) | 1 | |
| Hypertropia (only trace) | 1 (1) | 1 |
| Esophoria (only trace) | 1 (1) | |
| Exophoria (only trace) | ||
| Upshoot in adduction | 2 | |
| Convergence limited | 1 | |
| Refractive errors | 8 | 6 |
| Myopia | ||
| High | 1 | |
| Moderate | 2 | |
| Hyperopia | ||
| High | 4 | 1 |
| Moderate | 1 | 2 |
| Mild | 2 | |
| Anisohyperopia | 1 | |
Five children in group 1 had refractive errors and 12 latent strabismus. In group 2, eight children had multiple ocular abnormalities other than refractive errors or strabismus. Fifteen wore glasses and/or contact lenses, including seven because of pseudophakia or aphakia. Nine had strabismus and eight had other ocular abnormalities. In 3 children, contrast sensitivity was reduced (>5% contrast needed), whereas in one child the right visual field seemed to be somewhat impaired (confrontation test). There was no significant correlation between a crowding ratio ≥2 and latent or manifest strabismus.
The aetiology of brain damage in group 3 was: hypoxic ischaemic encephalopathy (11: 4 intraventricular haemorrhage, 6 periventricular leucomalacia, 1 both), asphyxia (4), brain malformation (2), leukoencephalopathy with optic neuropathy (1), Beckwith Wiedemann syndrome (1), meningitis (2) and unknown (3 cerebral palsy, 2 visual problems not explained by ocular abnormalities). In 7/26 children, no ocular abnormalities were found. Six had refractive errors and fourteen strabismus. In addition to a child with opticopathy, four children had structural ocular abnormalities other than abnormalities due to retrograde optic atrophy or refractive errors. Contrast sensitivity was reduced in three and visual field defects seemed present in ten children.
Visual acuitiesAll visual acuity tasks were completed by 59/60 children in group 1, 15/21 in group 2 and 19/26 in group 3. Grating acuity was missing in 9 participants because of logistical reasons; optotype acuities were missing in five children with brain damage, because of low vision, short attention or problems with the test distance.
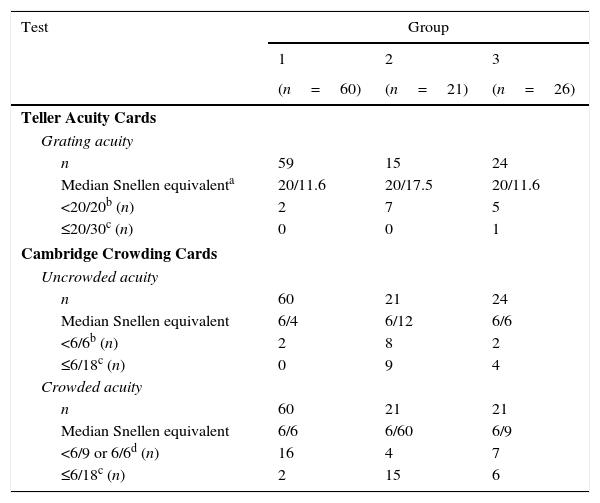
Results of the acuity tests are reported in Table 2. As was to be expected, within all groups, visual acuity varied with the test used: Teller Acuity Cards resulted in a significantly higher median visual acuity than the uncrowded Cambridge cards (p<0.01) and median uncrowded acuity was significantly higher than median crowded acuity (p<0.01). Remarkably, low vision (<10cycl/deg) was found in two children of group 1. One of them was known in the Eye Hospital and wore glasses to correct mild hyperopia; we referred the other for ophthalmological assessment.
Visual acuity results of the Teller Acuity Cards (grating acuity) and the Cambridge Crowding Cards (uncrowded and crowded acuity) in typically developing children (group 1), children with ocular disorders (group 2), children with brain damage (group 3).
| Test | Group | ||
|---|---|---|---|
| 1 | 2 | 3 | |
| (n=60) | (n=21) | (n=26) | |
| Teller Acuity Cards | |||
| Grating acuity | |||
| n | 59 | 15 | 24 |
| Median Snellen equivalenta | 20/11.6 | 20/17.5 | 20/11.6 |
| <20/20b (n) | 2 | 7 | 5 |
| ≤20/30c (n) | 0 | 0 | 1 |
| Cambridge Crowding Cards | |||
| Uncrowded acuity | |||
| n | 60 | 21 | 24 |
| Median Snellen equivalent | 6/4 | 6/12 | 6/6 |
| <6/6b (n) | 2 | 8 | 2 |
| ≤6/18c (n) | 0 | 9 | 4 |
| Crowded acuity | |||
| n | 60 | 21 | 21 |
| Median Snellen equivalent | 6/6 | 6/60 | 6/9 |
| <6/9 or 6/6d (n) | 16 | 4 | 7 |
| ≤6/18c (n) | 2 | 15 | 6 |
Groups performed significantly different on the visual acuity tests (Kruskal–Wallis tests p<0.01). To control for unequal variance we performed post hoc tests on ranks using the Welch t-test.20 Median grating acuity only differed significantly between group 1 and 2 (tw(16)=2.43, p=0.03), whereas the differences in median uncrowded and crowded acuities between groups were all significant (p≤0.02). To study a possible confounding effect by age, we calculated the Spearman rank correlations between age and test outcomes. Only in group 1, a significant relation was found between test outcomes and age (range ρ=0.44–0.52, p<0.01), which may indicate a developmental trend. Because group 1, which included younger children than the other groups, performed equal to or better than group 2 and 3, confounding by age is not likely.
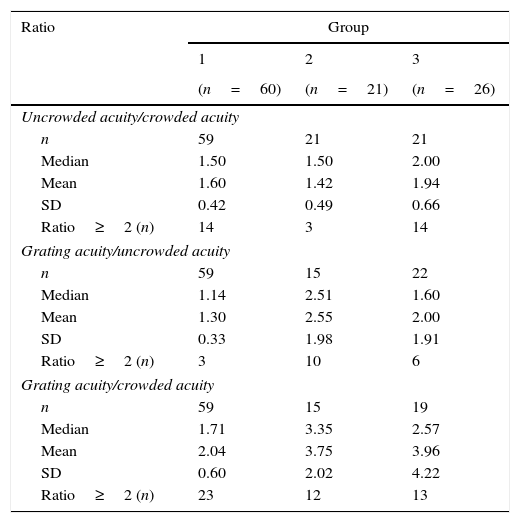
Acuity ratiosIn Table 3, we present the observed crowding and grating/optotype ratios within each group. Significant group differences were found for all ratios (Kruskal–Wallis tests: p<0.01).
Observed ratios in typically developing children (group 1), children with ocular disorders (group 2) and children with brain damage (group 3).
| Ratio | Group | ||
|---|---|---|---|
| 1 | 2 | 3 | |
| (n=60) | (n=21) | (n=26) | |
| Uncrowded acuity/crowded acuity | |||
| n | 59 | 21 | 21 |
| Median | 1.50 | 1.50 | 2.00 |
| Mean | 1.60 | 1.42 | 1.94 |
| SD | 0.42 | 0.49 | 0.66 |
| Ratio≥2 (n) | 14 | 3 | 14 |
| Grating acuity/uncrowded acuity | |||
| n | 59 | 15 | 22 |
| Median | 1.14 | 2.51 | 1.60 |
| Mean | 1.30 | 2.55 | 2.00 |
| SD | 0.33 | 1.98 | 1.91 |
| Ratio≥2 (n) | 3 | 10 | 6 |
| Grating acuity/crowded acuity | |||
| n | 59 | 15 | 19 |
| Median | 1.71 | 3.35 | 2.57 |
| Mean | 2.04 | 3.75 | 3.96 |
| SD | 0.60 | 2.02 | 4.22 |
| Ratio≥2 (n) | 23 | 12 | 13 |
Post hoc analysis on the ranks indicated that the ranks of the ratios in group 1 were significantly higher than in group 2, (tw(31.7)=2.25, p=0.03), although median score for the uncrowded/crowded acuity ratio of group 1 and 2 was equal. This difference cannot be explained by the different step sizes in the Cambridge Crowding Cards and its ratios, but is the result of the higher proportion of participants with a crowding ratio ≥2 in group 1.
The difference between group 1 and 3 was nearly significant (tw(28.9)=−2.09, p=0.05) and the ratio in group 3 was significantly higher than that in group 2 (tw(40)=3.20, p<0.01). A crowding ratio of 1.5 (crowded acuity is a half octave or one step lower than uncrowded acuity) or lower was found in 76% of group 1, 86% of group 2, and 33% of group 3.
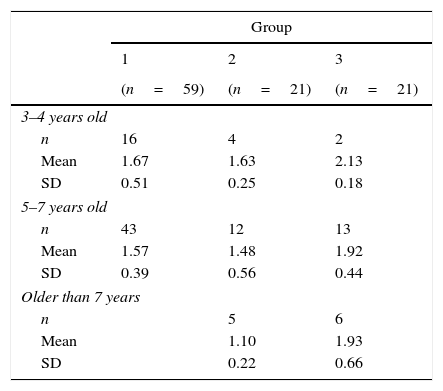
Only in group 2, a significant relationship between age and the uncrowded/crowded ratio was found (ρ=−0.53, p=0.01). Ratios in older children were lower than those in younger children, which might be indicative of non-parallel trends in acuity development: a relatively stable uncrowded acuity (ρ=0.06) over the age range and a small but positive trend for crowded acuity (ρ=0.27). Mean uncrowded/crowded ratios per age group can be found in Table 4. Correlations between age and other ratios were not significant (range ρ=0.05–0.27).
Mean ratio between uncrowded acuity and crowded acuity per age group in typically developing children (group 1), children with ocular disorders (group 2) and children with brain damage (group 3).
| Group | |||
|---|---|---|---|
| 1 | 2 | 3 | |
| (n=59) | (n=21) | (n=21) | |
| 3–4 years old | |||
| n | 16 | 4 | 2 |
| Mean | 1.67 | 1.63 | 2.13 |
| SD | 0.51 | 0.25 | 0.18 |
| 5–7 years old | |||
| n | 43 | 12 | 13 |
| Mean | 1.57 | 1.48 | 1.92 |
| SD | 0.39 | 0.56 | 0.44 |
| Older than 7 years | |||
| n | 5 | 6 | |
| Mean | 1.10 | 1.93 | |
| SD | 0.22 | 0.66 | |
Group 2 had significantly higher ratio of grating acuity to uncrowded acuity, compared to group 1 (tw(72)=4.90, p<0.01) and group 3 (tw(35)=2.24, p=0.03), whereas ratios for group 1 and 3 did not differ significantly.
Grating acuity/crowding acuityThe ratios between grating acuity and crowded acuity of group 2 and 3 did not differ significantly, but were significantly higher than in group 1 (tw(72)=3.90, p<0.01 and tw(24.8)=2.23, p=0.04).
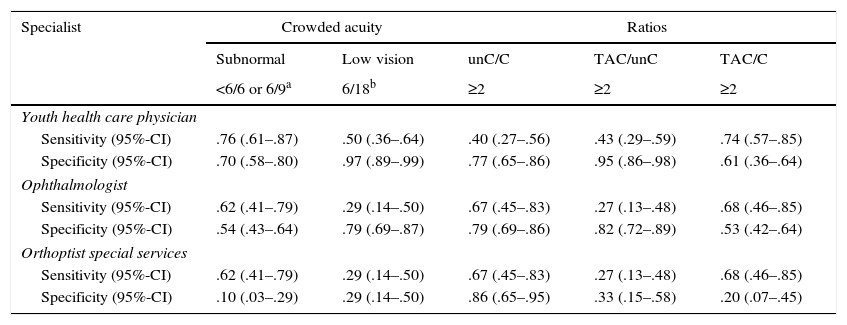
Referral criteria for different specialistsIn order to decide which parameter could be used best by youth health care physicians versus specialist groups, we used results presented in Table 5 and ROC-curves, shown in Fig. 1. Youth health care physicians best continue to use subnormal crowded acuity, i.e. routinely used acuity tests, to discriminate between children with and without any visual abnormalities (area under the curve (AUC)=0.80, 95%-CI: 0.71–0.89, p<0.01). Results of the crowding ratio (uncrowded acuity/crowded acuity) are equal to a random guess (AUC=0.50).
Sensitivity and specificity for cut-off values evaluated for different specialist groups.
| Specialist | Crowded acuity | Ratios | |||
|---|---|---|---|---|---|
| Subnormal | Low vision | unC/C | TAC/unC | TAC/C | |
| <6/6 or 6/9a | 6/18b | ≥2 | ≥2 | ≥2 | |
| Youth health care physician | |||||
| Sensitivity (95%-CI) | .76 (.61–.87) | .50 (.36–.64) | .40 (.27–.56) | .43 (.29–.59) | .74 (.57–.85) |
| Specificity (95%-CI) | .70 (.58–.80) | .97 (.89–.99) | .77 (.65–.86) | .95 (.86–.98) | .61 (.36–.64) |
| Ophthalmologist | |||||
| Sensitivity (95%-CI) | .62 (.41–.79) | .29 (.14–.50) | .67 (.45–.83) | .27 (.13–.48) | .68 (.46–.85) |
| Specificity (95%-CI) | .54 (.43–.64) | .79 (.69–.87) | .79 (.69–.86) | .82 (.72–.89) | .53 (.42–.64) |
| Orthoptist special services | |||||
| Sensitivity (95%-CI) | .62 (.41–.79) | .29 (.14–.50) | .67 (.45–.83) | .27 (.13–.48) | .68 (.46–.85) |
| Specificity (95%-CI) | .10 (.03–.29) | .29 (.14–.50) | .86 (.65–.95) | .33 (.15–.58) | .20 (.07–.45) |
C, crowded acuity; unC, uncrowded acuity; TAC, grating acuity.
 Youth health care physicians (target group: children at risk of visual problems due to ocular abnormalities or brain damage; control group: children without visual problems). (B) Ophthalmologists (target group: children with cerebral visual problems; control group: children without visual problems and children with ocular visual problems). (C) Low vision centres (target: group: children with cerebral visual problems; control group: children with ocular visual problems). C, crowded acuity; unC, uncrowded acuity; TAC, grating acuity. Each marker is a different cut-off point. Filled makers indicate cut-off points used in the current study: low vision (grey diamond), subnormal acuity (black diamond) and ratios equal to 2.0 (other black markers). Crowded acuity markers to the right of these filled markers are higher cut-off values and markers to the left are lower cut-off values. Ratio markers to the right of the filled markers are lower cut-off values, markers to the left are higher cut-off values.")
ROC-curves for crowded visual acuity and acuity ratios from the perspective of different groups of diagnosticians. (A) Youth health care physicians (target group: children at risk of visual problems due to ocular abnormalities or brain damage; control group: children without visual problems). (B) Ophthalmologists (target group: children with cerebral visual problems; control group: children without visual problems and children with ocular visual problems). (C) Low vision centres (target: group: children with cerebral visual problems; control group: children with ocular visual problems). C, crowded acuity; unC, uncrowded acuity; TAC, grating acuity. Each marker is a different cut-off point. Filled makers indicate cut-off points used in the current study: low vision (grey diamond), subnormal acuity (black diamond) and ratios equal to 2.0 (other black markers). Crowded acuity markers to the right of these filled markers are higher cut-off values and markers to the left are lower cut-off values. Ratio markers to the right of the filled markers are lower cut-off values, markers to the left are higher cut-off values.
For ophthalmologists, the primary choice for the detection of children at risk of cerebral visual impairments would be the crowding ratio (AUC=0.68, 95%-CI=0.54–0.83, p=0.01). Subnormal vision and the ratio between grating acuity and crowded acuity resulted in comparable sensitivities, but lower specificities.
Within low vision services, too, the crowding ratio with a cut-off value of 2 is currently the best option for screening for a risk of cerebral visual impairment (AUC=0.76, 95%-CI=0.60–0.91, p<0.01). Table 5 shows that subnormal vision and a ratio of 2 or higher between grating acuity and crowded acuity were relatively frequent in both patient groups 2 and 3 (high sensitivity, low specificity). Low vision and a ratio of 2 or higher between grating acuity and uncrowded acuity were relatively frequent in group 2, but relatively uncommon in group 3 (low sensitivity and low specificity).
We conclude that the results so far indicate that in groups referred for ophthalmological assessment or specialist evaluation in a low vision service, the crowding ratio is sensitive to detect children at risk of cerebral visual impairment, with and without low vision.
DiscussionThis study explored an opportunity to improve clinical identification of children at risk of cerebral visual impairment, based on visual acuity ratios, in order to advance effective referrals for specialist neuropsychological assessment. The outcomes indicate, that the crowding ratio (ratio between uncrowded and crowded acuity) has a favourable sensitivity (67%) and specificity (79–86%), independent of visual acuity, to distinguish children at risk of cerebral visual impairment from children with ocular pathology only. Current referral for specialist low vision assessment, based on visual acuity, is less sensitive and specific for this aim: the ‘low vision’ criterion only detects 29% of the at risk children. A crowding ratio ≥2, easily checked by orthoptists, might be a valuable referral criterion. However, for screening of unselected groups of children, such as in youth health care, it does not provide useful information. Youth health care professionals best continue applying subnormal crowded acuity as an indication for referral.
The present study indicates that the Cambridge Crowding Cards are highly applicable (80–100%) and better accepted than the addition of a grating acuity test to routine assessment. Further studies have to prove whether or not ratios differ using different crowded acuity tests, because acuity tests vary in letter distances and step sizes (Snellen vs. log-based acuity). A published study in 3-year olds comparing results of different crowded acuity tests, indicates that differences can be expected,21 although these differences might have been age-dependent.
Even though crowding has been extensively studied during more than 80 years22 and is considered clinically relevant, little is known about developmental changes and normal limits in children. We were surprised to find that 14 out of 59 typically developing children had crowding ratios≥2. This might be explained by the relatively large number of younger children in this group: a significant relationship between crowding ratio and age in the group without brain damage suggests a developmental phenomenon.
Because in an earlier study applying Cambridge Crowding Cards in children without ocular and neurological abnormalities16 standard deviations have not been reported, we cannot statistically compare findings. Mean crowding ratios found in 3–4 year olds seem comparable (1.7 vs. 1.8), whereas the mean crowding ratio in 5–7-year olds in the present study is slightly higher than in the earlier report (1.6 vs. 1.2).
Although the use of crowding ratio≥2 may help to detect children with unconfirmed brain damage, especially those with subnormal vision that are otherwise not referred for or entitled to specialised diagnostics and low vision care, we did not address the question whether or not the crowding ratio directly predicts perception problems and can be used as selection criterion in low vision services. Studying the developmental changes of the crowding ratio in relation to results on tasks with a high attentional load or with stimuli that can be considered ‘crowded’ (i.e. visual search tasks and object perception tasks under suboptimal conditions), might help to answer the question whether or not the crowding ratio can be used as selection criterion and predict higher visual impairments. If target identification in ‘crowded’ stimuli is modulated by attention and determined by the attentional resolution,5 task performance might be dependent on age and task duration. Young children with brain damage might have a higher crowding ratio as well as weak perception performances, whereas older children might perform normally on the short acuity task but worse on perception tests, with their longer duration i.e. with a higher attentional load.
Statement of financial and other relationshipsThis study was financed by Royal Dutch Visio and the Intellectual Disability Medicine research group of the Erasmus University Medical Center Rotterdam.
Conflicts of interestThe authors have no conflicts of interest to declare.
We thank the participating children and their parents, the primary schools (Eduard van Beinum, Openbare basisschool Charlois, De Bergse Zonnebloem, Visio-school), Rijndam Rehabilitation Centre, and Royal Dutch Visio, all located in Rotterdam, the Netherlands, for their participation and help.


