
According to Taiwan optometry act, low-vision services, such as refractive correction and low vision assessment, are now included in Optometric profession. This study was designed to investigate the efficiency of refractive correction and the relationship between refractive correction, eye diseases, visual symptoms, and optical device selection for patients with low vision.
MethodsThis study involved a total of 220 participants aged from 7 to 99, with 119 males and 101 females. All of them were referred from three institutes of Taiwan Resource Portal of Assistive Technology under the supervision of the Ministry of Health and Welfare during Feb 2016 to Jan 2018. Accordingly, 42, 76, and 102 of the participants were identified as having mild, moderate, and severe visual impairments, respectively, by five experienced and licensed optometrists for this comprehensive low vision examination.
ResultsThe most common eye diseases in this study were retinal disease, cataract, glaucoma, and optic nerve hypoplasia; some of the participants had multiple eye diseases while participating in the study. Except visual acuity decrease, eye diseases were highly correlated with participants’ visual symptoms. Refractive correction is the first step in low-vision examination, therefore, it might be much helpful to some types of eye diseases, visual symptoms, and to the decisions of optical devices for low-vision patients. The results herein suggest that color vision and contrast sensitivity should be taken into consideration when calculating the second optical magnifying power after refractive correction.
ConclusionsRefractive correction is necessary for the treatment of patients’ visual symptoms and also for the prescription of low-vision aids.
Con arreglo a la ley de Optometría de Taiwán, los servicios de baja visión, tales como la corrección refractiva y la evaluación de la baja visión, se incluyen ahora en la profesión optométrica. Este estudio fue diseñado para investigar la eficiencia de la corrección refractiva y la relación entre corrección refractiva, enfermedades oculares, síntomas visuales, y selección del dispositivo óptico para pacientes con baja visión.
MétodosEste estudio incluyó a un total de 220 participantes, 119 varones y 101 mujeres, con edades comprendidas entre 7 y 99 años. Todos ellos procedían de tres institutos del Portal de Recursos de Tecnología Asistencial de Taiwán, bajo la supervisión del Ministerio de Sanidad y Bienestar, desde febrero de 2016 a enero de 2018. En total, se identificaron 42, 76, y 102 participantes con trastornos visuales leves, moderados y graves, respectivamente, por parte de cinco optometristas experimentados y licenciados, para este amplio examen de baja visión.
ResultadosLas enfermedades oculares más comunes en este estudio fueron: enfermedad retiniana, cataratas, glaucoma, e hipoplasia del nervio óptico. Algunos de los participantes tenían enfermedades oculares múltiples cuando participaron en el estudio. Exceptuando la disminución de la agudeza visual, las enfermedades oculares guardaron una alta correlación con los síntomas visuales de los participantes. La corrección refractiva es el primer paso del examen de la baja visión y, por tanto, podría resultar muy útil para ciertos tipos de enfermedades oculares, síntomas visuales, y para la toma de decisiones sobre los dispositivos ópticos para los pacientes con baja visión. Los resultados del presente estudio sugieren que la visión del color y la sensibilidad al contraste deberían tenerse en consideración a la hora de calcular la segunda potencia de magnificación óptica tras la corrección refractiva.
ConclusionesLa corrección refractiva es necesaria para el tratamiento de los síntomas visuales de los pacientes, y también para la prescripción de dispositivos ópticos para los pacientes con baja visión.
As WHO reported in 2017, the most common causes of visual impairment are uncorrected refractive errors and un-operated cataract,1–3 and the incidence is higher in under-developed than in developing areas or countries. Owing to immature optometrist act, the definition of visual impairment, and interdisciplinary stereotype, the application of comprehensive refractive correction for low-vision patients are very limited in many Asian countries including Taiwan.4–7 However, refractive correction has been proved to be very effective in dealing with poor walking performance, stair negotiation, and reading difficulties among both elderly and other low-vision patients.8–12
General definition of refractive correction includes ametropia correction (myopia, hyperopia, presbyopia, and astigmatism), light treatments through tinted filter lenses to decrease the symptoms of glare / photophobia / light adaptation, prism for esophoria / esotropia as well as exophoria / exotropia, or nystagmus management, and magnifier fitting on the glasses.2 Furthermore, many low-vision devices could be used in combination with refractive correction lenses.13,14 Relatively, uncorrected refractive error will provide another type of optical devices or optical power. Therefore, it is necessary to put emphasis on these variances when calculating the equivalent viewing power (EVP), working distance (WD), and field of view (FOV) between two different optical systems.
The most commonly used optical aids for low-vision patients are magnifiers, high-power reading glasses, near or bifocal glasses, telescopes, closed circuit television (CCTV), or video magnifiers. Due to the rapid development of related technology, digital devices, such as screen magnifier and screen reader installed and operated on the computers, are increasingly used.15,16 In addition to visual acuity degeneration, low-vision patients have various eye symptoms, including nystagmus, light sensitivity or photophobia, sluggish dark adaptation, contrast sensitivity decrease, and visual field loss.17–21 All the symptoms above might result in searching or reading difficulties, easy fatigue, stumble or falls, and even serious accidents22–28 consequently. Hence, the purpose of this study was to investigate the efficiency of refractive correction (including ametropia lenses and filter lenses) and the relationship between refractive correction, eye diseases, visual symptoms, and optical device selection for patients with low vision.
Materials and methodsThis study complied with the Declaration of Helsinki as a statement of ethical principles to provide guidance to physicians and other participants in medical research involving human subjects and had reviewed by CSMUH IRB(CS2-15011). Five experienced and licensed optometrists were responsible for the comprehensive low vision examination and optical devices prescriptions. There were totally 220 participants from the age group 7–99 years (51.31±19.54) who were all referred from Taiwan Resource Portal of Assistive Technology, the Ministry of Health and Welfare during Feb 2016 to Jan 2018. The patients who cannot see hand movement at 1m after refractive correction were considered as blind and were excluded from this study. There were 119 males (54.1%) and 101 females (45.9%); 42 (19.1%) participants were identified as having mild visual impairment, 76 (34.5%) moderate, and 102 (46.4%) severe under best corrected visual acuity which are classified by Taiwan Ministry of Health and Welfare.38 Above forty percent of the participants (N=90, 40.9%) were in the age group from 40 to 60, 15 (6.8%) participants under age 18, 43 (19.5%) from 18 to 40, and 72 (32.7%) participants were over 60 years. Eye examination included visual acuity (ETDRS or reading cards), visual field (Confrontation test and Amsler Grid), contrast sensitivity or glare disability (CSV-1000), and color vision (D-15 or color tickets). In addition, a functional vision assessment form which was conducted by Taiwan Social and Family Affairs Administration,39 was asked for finishing throughout the process of low vision evaluation. Visual functions such as accommodation and visual field were recorded as “fail” while the deficits have had influence on patients’ activities, reading or even adaption in their daily life. Statistical analysis was performed by using the SPSS 24 package (IBM, Armount, NY), descriptive statistical analysis, Pearson X² test, odds ratio, and independent t test were utilized to analyze.
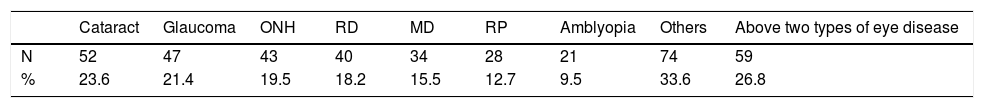
ResultsRelationship between eye diseases and visual symptomsThe prevalence of eye diseases and visual symptoms in this study was shown in Table 1. All the patients with eye diseases were first diagnosed by ophthalmologists before low vision examination, otherwise, visual functions and visual symptoms were rechecked by optometrists. Almost half of the participants showed retinal diseases (retinal detachment, n=40 18.2%; macular degeneration: n=34, 15.5%; retinitis pigmentosa: n=28, 12.7%), about 20% of the participants had cataract (n=52, 23.6%; 9 pre-operated, 43 post-operated), glaucoma (n=52, 23.6%), or optic nerve hypoplasia (n=43, 19.5%). Some participants (n=59, 26.8%) had multi-eye diseases while participating in the study. It’s worth noting that cataract surgery is reimbursed by the Taiwan National Health Insurance Bureau, therefore, most of the patients had cataract surgery before low vision examination. No matter participants had cataract surgery or not were all counted in the cataract group while correlation and risk were analyzed.
Eye diseases and visual symptoms.
| Cataract | Glaucoma | ONH | RD | MD | RP | Amblyopia | Others | Above two types of eye disease | |
|---|---|---|---|---|---|---|---|---|---|
| N | 52 | 47 | 43 | 40 | 34 | 28 | 21 | 74 | 59 |
| % | 23.6 | 21.4 | 19.5 | 18.2 | 15.5 | 12.7 | 9.5 | 33.6 | 26.8 |
| Nystagmus | Photophobia or glare | Contrastsensitivity | Color | Dark adaptation | Visualfield | Strabismus | Accommodative problems | Eye frame/Refractive errors | |
|---|---|---|---|---|---|---|---|---|---|
| N | 29 | 73 | 73 | 38 | 73 | 151 | 40 | 162 | 95/199 |
| % | 13.2 | 33.2 | 33.2 | 17.3 | 33.2 | 68.6 | 18.2 | 73.6 | 43.2/90.5 |
Among all participants, 70% of participants had experienced visual field loss (n=151, 68.6%) or accommodative problems (n=162, 73.6%). Risk factor analysis indicated that most visual field loss was resulted from retinal disease (MD: OR=4.921; RP, OR=12.877), traumatic brain injury or optic nerve hyperplasia (OR=11.057), and glaucoma (OR=11.645). Accommodative problems probably due to presbyopia (OR=14.546), cataract (OR=7.711), or traumatic brain injury (OR=2.431).
Participants also showed obvious visual symptoms about photophobia (n=73, 33.2%), contrast sensitivity (n=73, 33.2%), dark adaptation (n=73, 33.2%), strabismus (n=40, 18.2%), color vision deficit (n=38, 17.3%), and nystagmus (n=29, 13.2%) during the time of examination.
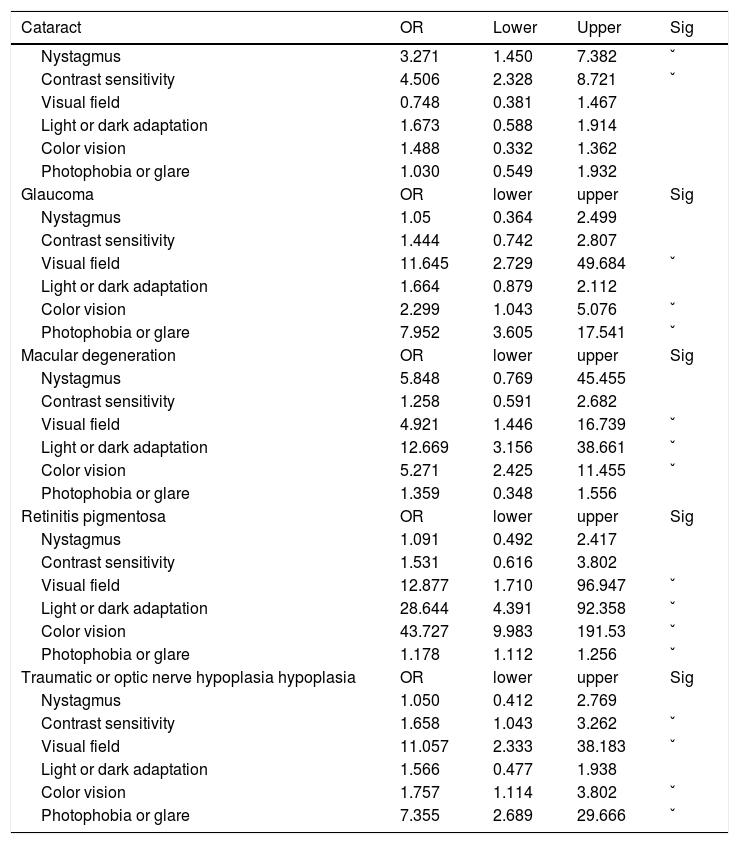
From an ophthalmologic perspective (Table 2), risk factor values showed that cataract might lead to nystagmus (OR=3.271, probably due to 17.3% of congenital cataract among all cataract patients) and contrast sensitivity problems (OR=4.506). Glaucoma might lead to visual field loss (OR=11.645), color vision deficit (OR=2.299), photophobia or glare disability (OR=7.952). Retinal disease might induce visual field loss (MD: OR=4.921; RP: R, OR=12.877), color vision deficit (MD: OR=5.271; RP: OR=43.727), dark adaptation problems (MD: OR=12.669; RP: OR=28.644), as well as photophobia or glare disability (RP: OR=1.178). Moreover, traumatic brain injury or optic nerve hyperplasia was generally correlated with visual field loss (OR=11.057), contrast sensitivity (OR=1.658), color vision deficit (OR=1.757), photophobia, or glare disability (OR=7.355). However, this does not mean that the disease corresponds to certain symptoms, it is just a matter of proportional risk. Clinically, all symptoms must be based on the patient's main complaints.
Risk analysis of eye disease and visual symptoms.
| Cataract | OR | Lower | Upper | Sig |
|---|---|---|---|---|
| Nystagmus | 3.271 | 1.450 | 7.382 | ˇ |
| Contrast sensitivity | 4.506 | 2.328 | 8.721 | ˇ |
| Visual field | 0.748 | 0.381 | 1.467 | |
| Light or dark adaptation | 1.673 | 0.588 | 1.914 | |
| Color vision | 1.488 | 0.332 | 1.362 | |
| Photophobia or glare | 1.030 | 0.549 | 1.932 | |
| Glaucoma | OR | lower | upper | Sig |
| Nystagmus | 1.05 | 0.364 | 2.499 | |
| Contrast sensitivity | 1.444 | 0.742 | 2.807 | |
| Visual field | 11.645 | 2.729 | 49.684 | ˇ |
| Light or dark adaptation | 1.664 | 0.879 | 2.112 | |
| Color vision | 2.299 | 1.043 | 5.076 | ˇ |
| Photophobia or glare | 7.952 | 3.605 | 17.541 | ˇ |
| Macular degeneration | OR | lower | upper | Sig |
| Nystagmus | 5.848 | 0.769 | 45.455 | |
| Contrast sensitivity | 1.258 | 0.591 | 2.682 | |
| Visual field | 4.921 | 1.446 | 16.739 | ˇ |
| Light or dark adaptation | 12.669 | 3.156 | 38.661 | ˇ |
| Color vision | 5.271 | 2.425 | 11.455 | ˇ |
| Photophobia or glare | 1.359 | 0.348 | 1.556 | |
| Retinitis pigmentosa | OR | lower | upper | Sig |
| Nystagmus | 1.091 | 0.492 | 2.417 | |
| Contrast sensitivity | 1.531 | 0.616 | 3.802 | |
| Visual field | 12.877 | 1.710 | 96.947 | ˇ |
| Light or dark adaptation | 28.644 | 4.391 | 92.358 | ˇ |
| Color vision | 43.727 | 9.983 | 191.53 | ˇ |
| Photophobia or glare | 1.178 | 1.112 | 1.256 | ˇ |
| Traumatic or optic nerve hypoplasia hypoplasia | OR | lower | upper | Sig |
| Nystagmus | 1.050 | 0.412 | 2.769 | |
| Contrast sensitivity | 1.658 | 1.043 | 3.262 | ˇ |
| Visual field | 11.057 | 2.333 | 38.183 | ˇ |
| Light or dark adaptation | 1.566 | 0.477 | 1.938 | |
| Color vision | 1.757 | 1.114 | 3.802 | ˇ |
| Photophobia or glare | 7.355 | 2.689 | 29.666 | ˇ |
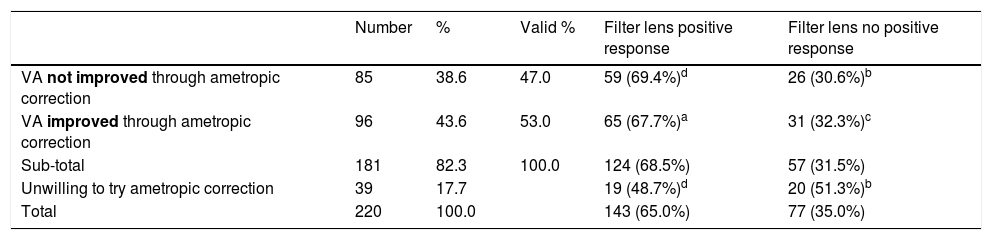
This study showed that over 90% of participants showed more or less refractive errors (spherical ≦−0.75D, ≧+0.75D, or astigmatism over 0.50D), but less than half of them had an eye frame for ametropic correction (Table 1, eye frame/refractive error=95/199). Among all participants, 39 (17.7%) subjects refused ametropic correction in this study because of bad experience in the past (Table 3, Fig. 1). For the visual acuity, approximately half of the participants (N=96, 53.0%) could be improved just through refractive examination and ametropic correction. The best corrected VA (logMAR value) was significantly observed if non-corrected VA (mean difference=0.17±0.3, t=7.285, p=0.000) and habitual corrected VA (mean difference=0.082±0.11, t=2.285, p=0.044) were compared. To summarize, only 46 (20.9%) subjects did not accept both refractive prescriptions (§ in Table 3), indicating that refractive prescription was almost 80% effective for the treatment of participants’ VA or visual problems. Finally, 112 (50.9%) of the participants accepted eye frames prescriptions with the combination of 96 ametropic corrections, 12 reading magnifiers, 7 prisms, and 56 tinted or coating lenses after low vision assessment (Table 4).
The efficiency of refractive correction.
| Number | % | Valid % | Filter lens positive response | Filter lens no positive response | |
|---|---|---|---|---|---|
| VA not improved through ametropic correction | 85 | 38.6 | 47.0 | 59 (69.4%)d | 26 (30.6%)b |
| VA improved through ametropic correction | 96 | 43.6 | 53.0 | 65 (67.7%)a | 31 (32.3%)c |
| Sub-total | 181 | 82.3 | 100.0 | 124 (68.5%) | 57 (31.5%) |
| Unwilling to try ametropic correction | 39 | 17.7 | 19 (48.7%)d | 20 (51.3%)b | |
| Total | 220 | 100.0 | 143 (65.0%) | 77 (35.0%) |

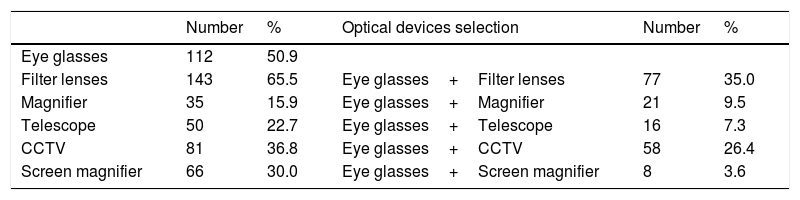
Descriptive analysis of low vision devices prescription.
| Number | % | Optical devices selection | Number | % | |
|---|---|---|---|---|---|
| Eye glasses | 112 | 50.9 | |||
| Filter lenses | 143 | 65.5 | Eye glasses+Filter lenses | 77 | 35.0 |
| Magnifier | 35 | 15.9 | Eye glasses+Magnifier | 21 | 9.5 |
| Telescope | 50 | 22.7 | Eye glasses+Telescope | 16 | 7.3 |
| CCTV | 81 | 36.8 | Eye glasses+CCTV | 58 | 26.4 |
| Screen magnifier | 66 | 30.0 | Eye glasses+Screen magnifier | 8 | 3.6 |
In Table 4, 3.6–35.0% participants used eye glasses in combination with another optical device, especially on filter lens (N=77, 35.0%) and CCTV (N=58, 26.4%). In addition, Pearson chi-square analysis showed that participants’ age and degree of impairment were significant influence on optical devices prescription, mainly on eye glasses(χ²=8.451, p=0.038), filter lenses (χ²=8.822, p=0.032), and CCTV (χ²=13.569, p=0.004) decision.
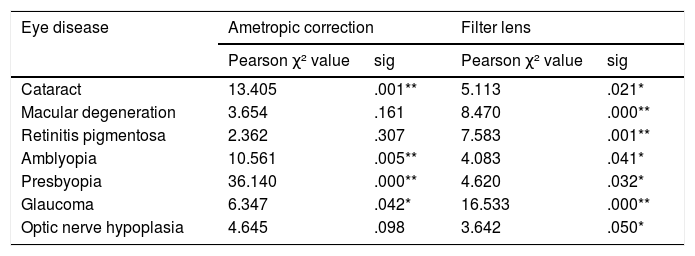
Moreover, ametropic correction (Table 5) showed significantly positive responses on cataract (χ²=13.405, p=0.001), amblyopia (χ²=10.561, p=0.005), presbyopia (χ²=36.140, p=0.000), and glaucoma (χ²=6.347, p=0.042), while it was not very effective on retinal diseases (MD: χ²=3.654, p=0.161; RP: χ²=2.362, p=0.307) and optic nerve hypoplasia (χ²=4.645, p=0.098). Furthermore, statistical analysis indicated that ametropic correction was conspicuously correlated with light sensitivity or photophobia (χ²=4.028, p=0.045), nystagmus (χ²=8.477, p=0.004), and visual field (χ²=13.405, p=0.001). It is reasonable that ametropic correction would be helpful for visual field: central visual acuity improvement might be positively related to peripheral visual acuity. For example, it is highly possible that patients could not point out the target because of the poor central and peripheral visual acuity when they were under subjective visual field test.
Relationship between eye disease, ametropic correction, and filter lens.
| Eye disease | Ametropic correction | Filter lens | ||
|---|---|---|---|---|
| Pearson χ² value | sig | Pearson χ² value | sig | |
| Cataract | 13.405 | .001** | 5.113 | .021* |
| Macular degeneration | 3.654 | .161 | 8.470 | .000** |
| Retinitis pigmentosa | 2.362 | .307 | 7.583 | .001** |
| Amblyopia | 10.561 | .005** | 4.083 | .041* |
| Presbyopia | 36.140 | .000** | 4.620 | .032* |
| Glaucoma | 6.347 | .042* | 16.533 | .000** |
| Optic nerve hypoplasia | 4.645 | .098 | 3.642 | .050* |
As mentioned above, the preliminary prescription of refractive correction included ametropia correction and filter lenses. Although some participants (N=85, 38.6%) did not show obvious visual acuity progression (Table 3 and Fig. 1), but some had reported to have clear, better resolution after ametropia correction. Moreover, participants who could not make further progress on VA (N=59) through ametropic correction or denied refractive examination (N=19) chose filter lenses (N=78, 35.5%) for good light accommodation or eye comfort. This alternative prescription also produced the same contributions for VA progression group (N=65, 67.7%). A total of 143 (65%) subjects were satisfied with filter prescription, only 46 (20.9%) subjects believed that both ametropic correction and filter lens were ineffective and therefore were unwilling to try.
Table 5 showed that the use of filter lens was significantly correlated with all types of eye diseases, mostly on glaucoma (χ²=16.533, p=0.000), MD (χ²=8.470, p=0.000), RP (χ²=7.583, p=0.001), and was also correlated with cataract, amblyopia, optic nerve hypoplasia and presbyopia. In addition, it was speculated that filter lens could alleviate light sensitivity or photophobia (χ²=24.207, p=0.000), dark adaptation (χ²=18.477, p=0.000), contrast sensitivity (χ²=13.111, p=0.000), and visual field loss (χ²=8.926, p=0.003).
The affectivity between Refractive correction and optical devicesStatistical data presented earlier confirmed the impact of refractive correction on visual symptoms and better visual acuity. Obviously, this would lead to different magnifying powers and selection of optical devices. Since refractive correction in this study would help to improve participants’ visual acuity about 1.48 times, it would decrease near ADD prescription from 16.7D (uncorrected VA was 1.2 logMAR) to 10.0D (after corrected VA was 1.0 logMAR). Many participants chose a combination of refractive prescription and another optical device instead of only one visual assistant.
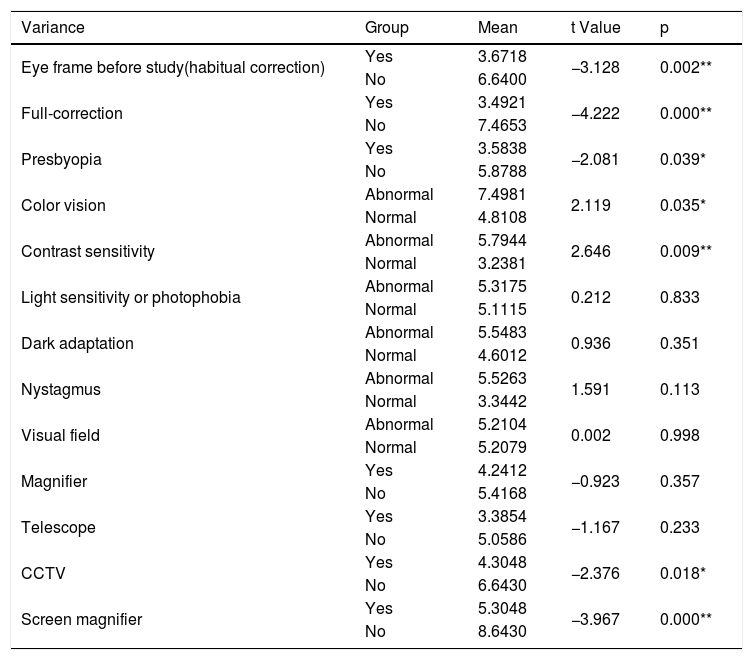
Refractive correction had great influence on visual acuity, and magnifying power was concomitantly became a dependent factor. t test analysis in Table 6 indicated that prescription of magnifying power for the glasses had significant differences between habitual correction (t=−3.128, p=0.002), full correction (t=−4.222, p=0.000), and near ADD for presbyopia (t=2.081, p=0.039). Moreover, the calculation of magnifying power should take color vision (t=2.119, p=0.035) and contrast sensitivity (t=2.646, p=0.009) into consideration. It means that lower magnifying power is required for participants with normal color vision or normal contrast sensitivity compared with participants having abnormal color vision or contrast sensitivity. In addition, Table 6 indicated that the magnifying power prescription might be significantly different between CCTV (t=−2.376, p=0.018) and screen magnifier (t=−3.967, p=0.002) after refractive correction.
Refractive correction and magnifying power(D) calculation.
| Variance | Group | Mean | t Value | p |
|---|---|---|---|---|
| Eye frame before study(habitual correction) | Yes | 3.6718 | −3.128 | 0.002** |
| No | 6.6400 | |||
| Full-correction | Yes | 3.4921 | −4.222 | 0.000** |
| No | 7.4653 | |||
| Presbyopia | Yes | 3.5838 | −2.081 | 0.039* |
| No | 5.8788 | |||
| Color vision | Abnormal | 7.4981 | 2.119 | 0.035* |
| Normal | 4.8108 | |||
| Contrast sensitivity | Abnormal | 5.7944 | 2.646 | 0.009** |
| Normal | 3.2381 | |||
| Light sensitivity or photophobia | Abnormal | 5.3175 | 0.212 | 0.833 |
| Normal | 5.1115 | |||
| Dark adaptation | Abnormal | 5.5483 | 0.936 | 0.351 |
| Normal | 4.6012 | |||
| Nystagmus | Abnormal | 5.5263 | 1.591 | 0.113 |
| Normal | 3.3442 | |||
| Visual field | Abnormal | 5.2104 | 0.002 | 0.998 |
| Normal | 5.2079 | |||
| Magnifier | Yes | 4.2412 | −0.923 | 0.357 |
| No | 5.4168 | |||
| Telescope | Yes | 3.3854 | −1.167 | 0.233 |
| No | 5.0586 | |||
| CCTV | Yes | 4.3048 | −2.376 | 0.018* |
| No | 6.6430 | |||
| Screen magnifier | Yes | 5.3048 | −3.967 | 0.000** |
| No | 8.6430 |
Most common eye diseases in Taiwan were retinal disease, cataract, glaucoma, and optic nerve hypoplasia, many participants even suffered from multiple eye diseases in this study. This was confirmed by the study of Chung, et al.,29 Tsai, et al.,30 and Cheng, et al.5,31 Unlike other countries5,32–34 and WHO1 investigation, refractive error was found not to be a major cause of eye diseases in this study.30 In view of the increasing population of visual impairment, it is important to speculate how to prevent or how to detect early, usage of new precision medicine,40 or development of genetic engineering41 researches are all constructive ways to study in the future.
From the viewpoint of physiology and anatomy, refractive correction might be beneficial to some types of eye diseases, and there is an association between eye diseases and visual symptoms.2 For example, retinal disease might lead to visual acuity decrease, color vision or dark adaptation deficit, and even visual field loss because of macular, con, and rod cell functions. Furthermore, traumatic brain injury or optic nerve hypoplasia were always accompanied with visual field loss, strabismus, accommodative degeneration, convergence insufficiency, and photophobia due to the dysfunctions of optic nerve conduction, cranial nerve problems (oculomotor: Edinger–Westphal, trochlear, abducent Nerve),35 and sympathetic or parasympathetic nervous system.36 This study found that all the symptoms of low-vision patients could easily infer the diseases if the patients were carefully verified clinically. Medical professions should be of benefit to deal with patients’ visual symptoms through prescribing low vision devices.
Because the high prevalence of non-, under-, or wrong refractive correction was the characteristic of ocular pathologies, refractive findings could be changed more rapidly compared to healthy eyes. Refractive correction is not only conducive to visual acuity improvement, but also to the decreases of blunt nystagmus, light discomforts, and even helpful for cosmetic purpose.4,37 In addition, refractive correction can also be applied to have the lower equivalent viewing power (EVP), larger field of view (FOV), or more ergonomics working distance (WD)12–14 simultaneously. Results herein indicated that color vision and contrast sensitivity should be taken into consideration for the calculation of second optical magnifying power, and this result is consistent with the previous studies by CSMU.4,37 Finally, patients’ age and degree of impairment showed intermediate effect.
LimitationThe paper presents the results of a study involving people who were referred to the authors from the Taiwan Resource Portal of Assistive Technology(TRPAT) over the period February 2016 to January 2018. As the criteria for selection into the study required participants to have come through the TRPAT and as policies influenced who was eligible for this service, the prevalence of ophthalmologic eye diseases and visual symptoms in this study may not be well-extensive and well-developed. The next step will investigate or analyze through National Health Insurance research databases in Taiwan.
Conflicts of interest: All authors have no association with or involvement in any organization or entity with any financial or nonfinancial interest in the subject matter or materials discussed in this manuscript.
We thank the Taiwan Resource Portal of Assistive Technology, and Ministry of Health and Welfare for supporting this project. Most importantly, the efforts of the therapists and social workers from Tainan, Taichung, Kaohsiung, Taipei, and Halian Assistive Technology Resource Centers were highly appreciated.


