

To determine normative values for stereoacuity, accommodative and vergence measures for high school populations.
MethodsUsing a multi-stage random cluster sampling, 1211 children (481 males and 730 females) between 13 and 18 years of age, with a median age of 16 years, were selected. Visual acuity, stereoacuity and suppression, refractive errors, near point of convergence, heterophoria and fusional vergences, as well as, amplitude of accommodation, accommodative response, facility and relative accommodation were evaluated.
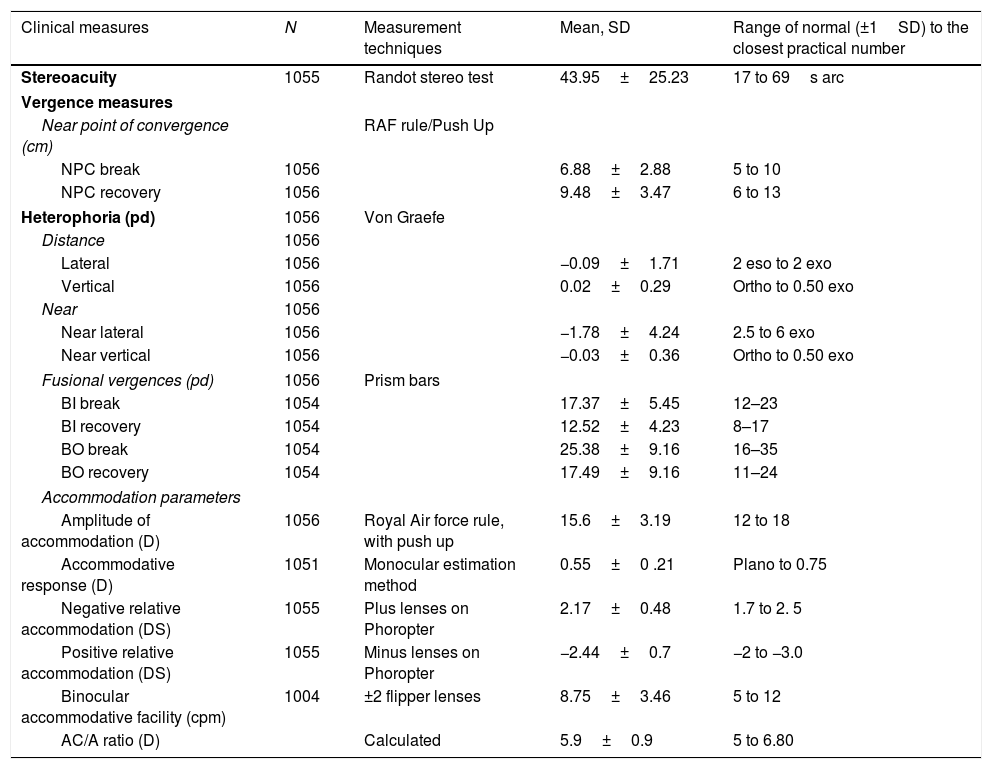
ResultsMost data did not have a normal distribution. The range of normality for the vergence measures were: near point of convergence break, 5–10cm, recovery, 6–13cm, near lateral phoria, 2.5–6 prism dioptre (pd) (nasal), near vertical, orthophoria to 0.50pd, negative fusional vergence break, 12–23pd, recovery, 8–17pd, positive fusional vergence break, 16–35 and recovery 11–24pd. For accommodative measures, the range of normality for accommodative measures was: amplitude of accommodation, 12–18pd, accommodative response, plano to +0.75D, binocular accommodative facility, 5–12 cycles per minute (cpm), negative relative accommodation, 1.75–2.50DS, positive relative accommodation, −2.0 to −3.0DS and 17–69s arc for stereoacuity.
ConclusionThis study provides norms for clinical measures which could be used to classify accommodative and vergence parameters for children aged 13–18 years in this population or beyond. Findings should be applied in the context of the measurement techniques and the associated limitations outlined in this report.
Determinar los valores normativos para la estereoagudeza, y las mediciones de acomodación y vergencia para poblaciones de estudiantes de secundaria.
MétodosUtilizando un muestreo de grupo aleatorio de etapas múltiples, se seleccionaron 1.211 chicos (481 varones y 730 mujeres) de edades comprendidas entre 13 y 18 años, con una edad media de 16 años. Se evaluaron la agudeza visual, estereoagudeza y supresión, errores refractivos, punto próximo de convergencia, heteroforia y vergencias fusionales, así como amplitud de acomodación, respuesta acomodativa, flexibilidad de acomodación y acomodación relativa.
ResultadosMuchos datos no reflejaron una distribución normal. El rango de normalidad para las mediciones de vergencia fue: punto próximo de rotura de convergencia, de 5 a 10cm, recobro, de 6 a 13cm, foria lateral de cerca, de 2,5 a 6 dioptrías prismáticas (pd) (nasal), vertical de cerca, ortoforia 0,5 pd, rotura de vergencia fusional negativa, 12-23 pd, recobro, 8-17 pd, rotura de vergencia fusional positiva, 16-35 y recobro 11-24 pd.
Para las mediciones de la acomodación, el rango de normalidad para mediciones acomodativas fue: amplitud de acomodación, de 12 a 18 pd, respuesta acomodativa, de plano a + 0,75 D, flexibilidad acomodativa binocular, de 5 a 12 ciclos por minuto (cpm), acomodación relativa negativa, de 1,75 a 2,5 DS, acomodación relativa positiva, de −2 a −3 DS y 17–69 s arc para estereoagudeza.
ConclusiónEste estudio aporta normas para mediciones clínicas que podrían utilizarse para clasificar los parámetros de acomodación y vergencia medidos en niños de edades comprendidas entre 13 y 18 años en esta población, o con edades superiores. Deberán aplicarse los hallazgos en el contexto de las técnicas de medición y las limitaciones asociadas destacadas en este estudio.
Normative data (abbreviated as norms) comprise observations from a reference population which characterizes what is usual or expected in a defined population.1
Accommodative and vergence mechanisms constitute part of the visual efficiency system2 and associated anomalies are disorders of the eye that result in an inappropriate response to a particular visual demand and an inability to sustain comfortable bifoveal fixation.2 Clinicians and researchers rely on criteria derived from norms to distinguish between normal and abnormal conditions as the definition of an anomaly influences its diagnosis and treatment. Currently, the classification systems for most accommodative and vergence anomalies vary across studies which makes it difficult to establish consistent prevalence estimates of these anomalies.3 In some cases, what constitutes the accommodative and vergence system and the reported prevalence of associated anomalies have been questioned.3,4 Furthermore, the symptoms in accommodative and vergence anomalies are similar and interrelated, although each syndrome may have unique symptoms.2,5 The similarities in symptoms warrant the need for differential diagnosis of accommodative and vergence anomalies which makes establishing defined criteria even much needed. The way an anomaly is defined influences prevalence estimates, as well as, diagnosis and treatment. Given the clinical importance of classification and definitions, researchers have studied various aspects of accommodative and vergence measures to determine normative data for these parameters in various populations.6–48
Classic studies6–11 on normative data including those by Morgan10 Haines6,7 and Sheppard,11 studied accommodative and vergence measures and remain relevant till date. Haines6,7 and later, Morgan10 determined reference data for accommodative and vergence measures for prepresbyopic patients. The Optometric Extension Progamme (OEP) reference data were based on thousands of cases from varying age ranges15 and the table of expected reported in Scheiman and Wick10 were derived from various studies including those reported by Morgan. Other studies include Wesson12 who studied prism bar fusional vergences in participants aged between 4 and 70 years in a clinical setting. Various studies were conducted on accommodative measures,28–47 as well as, those that determined norms for stereoacuity48–55 were also reviewed, as stereopsis is an important parameter used to evaluate interactions between accommodation and vergence mechanism.13
Various factors limit the application of findings from previous studies to all populations. These factors include that most of these studies were based on Caucasian populations6–19,34–45 and findings may not be appropriate to make inference on Black populations. Some data were derived from a wide age range and included children and adult participants,6,7,11,12 and others studied either mainly primary school children13,14,16–18,21 or university populations.15,22,23 In some studies, generalization of findings is limited as data were derived from clinical populations and without random sampling6,21 while others had small sample sizes.15,28,31 In most cases, only the mean values were presented as normative values without consideration for variability of data, and range from which the lower and upper limits of measures could be obtained. More so, only a few studies determined aspects of normative data for accommodative and vergence variables on African populations.25,45,46
Age and race are variables thought to influence accommodative and vergence variables,31 and considering the outlined limitations with previous studies, the present study was designed to fill a gap by determining accommodative, vergence and stereoacuity measures using a firm research design. It included studying a relatively large sample size using random sampling, data collected by one examiner and participants selected from several high schools in the municipality with a high response rate. The high school is a population of interest as it comprises an important stage in learning with relative increase in intensity of school work. Prolonged near task could result in near vision anomalies and associated symptoms may affect reading and academic performance.2 Accordingly, the aim of the present research was to determine normative values which could be used to define accommodative and vergence anomalies in high school children.
MethodsStudy designThis report is part of a larger cross sectional study designed to quantify near vision anomalies (refractive and accommodative-vergence) and their association with symptoms in order to develop strategies on how to identify and treat them. Therefore, the focus of this report is on near vision variables. The study protocol was approved by the Biomedical Research Ethics Committee (ethical clearance reference number BE 177/12) of the University of KwaZulu-Natal, South Africa. Written informed consents for access to the schools were obtained from the Department of Education and the school principals.
SamplingThe target population was Black high school children in the uMhlathuze Municipality of northern Kwazulu-Natal Province, South Africa. The study participants comprised 1211 children (481 males and 730 females) with ages ranging from 13 and 18 years who were selected from 13 out of a sample frame of 60 high schools in the municipality. The sample size was derived from the original study-part of which has been published.56,57 The total number of students enrolled for the study per school was obtained by dividing the total sampling frame (from the 60 schools) by the tentative sample size to obtain the sample interval. The total number of students per school was then divided by the sample interval to obtain the total number of students studied per school. One to two classes were randomly selected from each school grade of 8–12. At the class level, the registers were used as the sampling frame from which individual students were selected using systematic sampling approach where a random starting point was selected and every nth (from sample interval) student examined. Some minor modifications were made for cases such as inadequate number of students in a class where participants were selected from the next class.
Information sheets and consent forms were written in both English language and the childrens’ indigenous language (isiZulu). Only Black South African children, males and females were eligible to participate in the study. In the identified schools, assent forms were distributed to selected students and consent forms for parents were sent to them through their children. The leaflets contained information that explained the purpose of the study. Students who returned their approved parental consent and assent forms were enrolled for the study, conduct of which complied with the Declaration of Helsinki regarding research on human subjects. For the entire study, students were excluded if they had suppression on the Worth-4-dot, strabismus, ocular diseases, nystagmus, motility problems, any systemic conditions or any systemic medication that might affect near vision function.
Study settings, materials and procedureThe school principals provided rooms at the school venues where the visual examinations were conducted. The purpose and procedure for every technique was carefully explained to each participant before starting the eye examination. Validated optometric instruments were used and techniques were applied as described. All vision testing was performed between 08h30 and 13h30 over a period of one year. As much as possible, the same conditions including test distances and standard room illumination were applied for all sessions and at all testing sites.
Eye examination proceduresThe vergence measures include the near point of convergence (NPC), phoria and fusional vergences and clinical tests used to define accommodative measures which are relevant to this study include: the amplitude of accommodation (AA), accommodative response (AR), accommodative facility (AF) and relative accommodation (RA). The testing sequence was arranged in two stations. The techniques performed in the first station by a trained assistant included case history comprising recording of each participant's demographic details, visual acuity measurement (VA) and history of ocular and systemic conditions. As an approach to minimize bias, the research assistant in station one worked independently of the optometrist who collected data in station two. The tests in the second station were performed by one optometrist who was experienced in performing the techniques therefore addressing the concern of inter-examiner variability. The techniques performed in the second station included the preliminary and the main tests. The preliminary test were performed with participants wearing no correction and included ocular health status evaluation using the direct ophthalmoscope. Suppression was evaluated at near using the Worth-4-dot test. (Bernell Corporation, Mishawaka Inc, USA)58 The main tests performed included evaluation of refractive errors, accommodative, and vergence tests The tests are routine optometric techniques and have been described in detail in earlier publications for refractive errors,56 and accommodative and vergence measures- in this journal.57
Refractive errorsRefractive error was evaluated objectively using an autorefractor (MRK/3100; Huvitz) and subjectively on the phoropter.56 Cycloplegia could not be applied as the entire study was on investigating near vision anomalies and cycloplegia could affect near vision functions. In addition, our intention was to evaluate students’ binocular vision status in their habitual state. All cases were treated as new to ensure that maximal refractive compensation was utilized although most students did not wear glasses. As cycloplegia was not applied, a +2.00D lens was used to screen for latent hyperopia.
StereoacuityStereoacuity was assessed using the Randot stereo test (Vision Assessment Corporation USA).58 The test was done at 40cm in normal room illumination with participant seated and wearing vectographic spectacles without refractive correction. Participants’ attention was then directed to the top 4 panels on the right-hand side of the open test book. Given a time limit of 5s per line for response, participant was asked to identify the 3 panels which contain either a shape or figure.58 If all figures were correctly identified, the participant was asked to look at the 12 boxes each containing 3 circles and to indicate which circle (left, middle, or right) appeared to be floating slightly above the other circles or different from the others.58 The procedure was repeated for boxes 2–12 and the number of figures identified correctly was recorded. The first incorrect response on the circles was considered the limit of disparity except when the patient identified two consecutive finer stimuli correctly.58
Accommodative and vergence testsThe focus of the study was on near vision and all near tests were performed at 40cm with the best refractive distance corrections in place. The tests were performed three times and an average reading taken for analysis. For vergence test, the near point of convergence (NPC) was measured using the Royal Air Force (RAF) rule with a vertical line target, the unilateral cover test was first performed to rule out strabismus while distance and near heterophoria were evaluated using the von Graefe technique in a specially-designed phoropter tripod. (Fig. 1) Fusional vergences (positive and negative) were measured using a horizontal prism bar (Gulden B-16 horizontal prism bars-Gulden Ophthalmics, Elkins Park, PA). Negative fusional vergence was routinely measured first before positive fusional vergences as the convergence responses stimulated during the base-out measurements may produce adaptation of tonic vergence (related to the physiological position of rest and due to the extra-ocular muscles’ tonus) which may bias the subsequent base-in values.26,58

Accommodation tests performed included amplitude of accommodation (AA) which was assessed using the Donder's push-up method with the RAF near point rule,57 accommodation response (AR) was measured using the monocular estimated method (MEM) dynamic retinoscopy technique57,58 and accommodative facility (AF) was assessed using the plus/minus 2.00D flipper lens. Relative accommodation tests were performed on the phoropter, negative relative accommodation (NRA) was measured first followed by positive relative accommodation. (PRA).57–58
Data analysisAll data were entered on Microsoft Excel, checked by the author and thereafter imported into and analyzed by a statistician using the Statistical Package for Social Sciences. (SPSS for Windows, Version 21.0, IBM-SPSS, Chicago, IL, USA) Descriptive statistics were presented as means, standard deviation and median. The Kolmogorov–Smirnov (K–S) was used to tests for normality of data. For data that were not normally distributed, the Independent samples Mann–Whitney U test was used to compare means of two groups while the Kruskal–Wallis equality-of-population rank non-parametric test was applied to compare differences in means for related measures among groups and the independent t-test was used to compare the means of gender, age groups and grade levels. A significance level (p) of less than 0.05 was considered significant. The distributions of variables were presented using tables.
ResultsSample characteristicsA total of 1211 returned their consent and assent forms but 10 students were excluded, (seven had amblyopia, one had diabetes, another had diagnosed glaucoma and the other had corneal scars due to trauma) leaving 1201. A further 145 children aged 19 and older, were excluded from this report as it is intended to report only on participants of official high school age range of 13–18 years in South Africa. Thus, data was analyzed for 1056 participants (a response rate of 87%) with mean age 15.8±1.58 years and median age 16 years. There were 403 (38%) males and 653 (62%) females. The sample comprised 781 (73.9%) students from grades 8–10 (lower grade level) and 275 (26.0%) from grades 11–12 (higher grade level). There was a high correlation between left and right eyes spherical equivalent refractions. (r=0.645, p=0.01), therefore, only data for right eye are reported.
Given the data mean and standard deviations (SD), a range was determined within which the lower and upper limits of normal were obtained. The smaller the variance and standard deviations (SD), the more the sample mean is indicative of the population mean.59 As a convention, statisticians accept as normal, any measurement that falls in the range mean ±0.7 (68% or 2/3 that is, approximately 1 SD).10 With the SD of ±1, 68% of the observations will include all values lying within one mean deviation on either side of the mean, therefore is safely within normal limits.6,7,10,59 The mean ±1 was applied to calculate the range of normal in the present study. This range has the advantage of being wider and results in a slightly more liberal set of standards.6,10,59
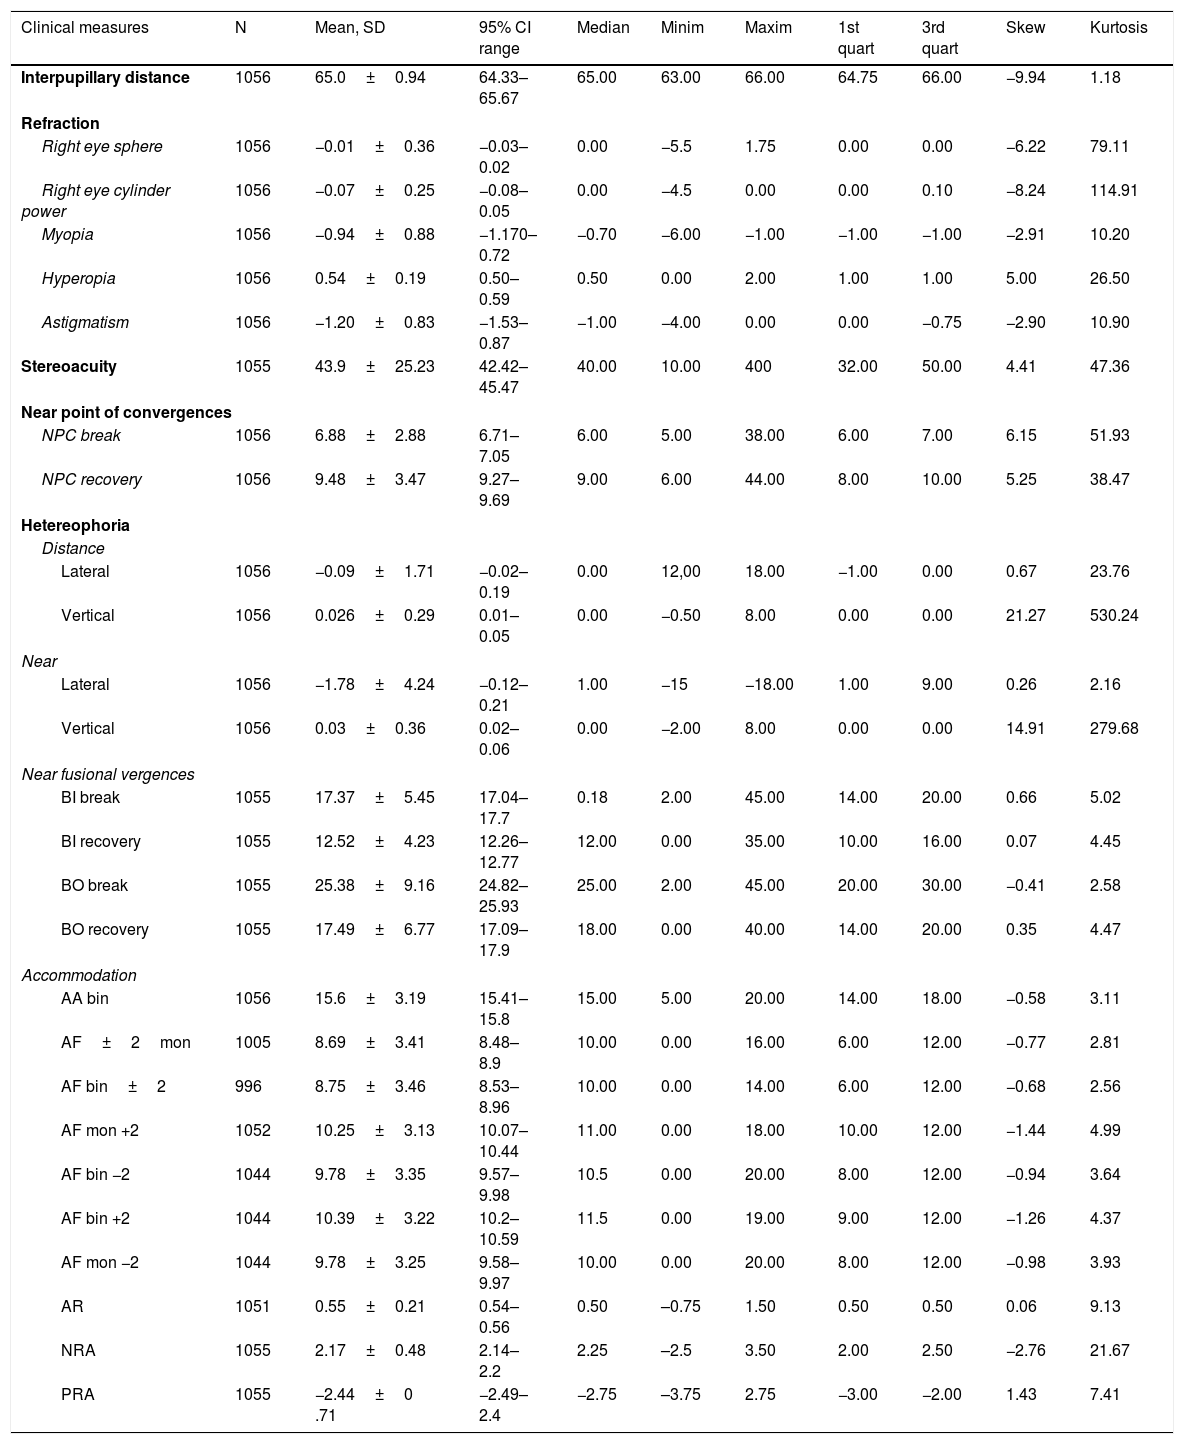
The descriptive statistics for refractive errors, stereoacuity, accommodative and vergence measures are shown in Table 1. Invariably, the skewness and kurtosis in normal distribution are near zero.14,59 Considering the similarity of the mean and median, as well as, the skewness being close to zero, only the data for distance lateral phoria, negative fusional vergences and accommodative response were somewhat close to normal distribution. The data for other variables were either positively skewed where more findings are distributed on the plus side of the peak than a normal distribution or negatively skewed which indicates that more findings are on the minus side of the peak than in a normal distribution.14,59 In addition, all data had a plus kurtosis (leptokurtosis) where the distribution had a higher peak than in a normal distribution and none had a minus kurtosis (platykurtosis) where the distribution has a lower peak than a normal distribution.14,59 It is noteworthy that measurement of accommodative facility with ±2D flipper lenses, (monocularly and binocularly), as well as, with +2D and −2.0D separately, (monocularly and binocularly) (Table 1) is in line with the criteria for classifying accommodative anomalies (Table 10).
Descriptive statistics for refractive, and vergence measures.
| Clinical measures | N | Mean, SD | 95% CI range | Median | Minim | Maxim | 1st quart | 3rd quart | Skew | Kurtosis |
|---|---|---|---|---|---|---|---|---|---|---|
| Interpupillary distance | 1056 | 65.0±0.94 | 64.33–65.67 | 65.00 | 63.00 | 66.00 | 64.75 | 66.00 | −9.94 | 1.18 |
| Refraction | ||||||||||
| Right eye sphere | 1056 | −0.01±0.36 | −0.03–0.02 | 0.00 | −5.5 | 1.75 | 0.00 | 0.00 | −6.22 | 79.11 |
| Right eye cylinder power | 1056 | −0.07±0.25 | −0.08–0.05 | 0.00 | −4.5 | 0.00 | 0.00 | 0.10 | −8.24 | 114.91 |
| Myopia | 1056 | −0.94±0.88 | −1.170–0.72 | −0.70 | −6.00 | −1.00 | −1.00 | −1.00 | −2.91 | 10.20 |
| Hyperopia | 1056 | 0.54±0.19 | 0.50–0.59 | 0.50 | 0.00 | 2.00 | 1.00 | 1.00 | 5.00 | 26.50 |
| Astigmatism | 1056 | −1.20±0.83 | −1.53–0.87 | −1.00 | −4.00 | 0.00 | 0.00 | −0.75 | −2.90 | 10.90 |
| Stereoacuity | 1055 | 43.9±25.23 | 42.42–45.47 | 40.00 | 10.00 | 400 | 32.00 | 50.00 | 4.41 | 47.36 |
| Near point of convergences | ||||||||||
| NPC break | 1056 | 6.88±2.88 | 6.71–7.05 | 6.00 | 5.00 | 38.00 | 6.00 | 7.00 | 6.15 | 51.93 |
| NPC recovery | 1056 | 9.48±3.47 | 9.27–9.69 | 9.00 | 6.00 | 44.00 | 8.00 | 10.00 | 5.25 | 38.47 |
| Hetereophoria | ||||||||||
| Distance | ||||||||||
| Lateral | 1056 | −0.09±1.71 | −0.02–0.19 | 0.00 | 12,00 | 18.00 | −1.00 | 0.00 | 0.67 | 23.76 |
| Vertical | 1056 | 0.026±0.29 | 0.01–0.05 | 0.00 | −0.50 | 8.00 | 0.00 | 0.00 | 21.27 | 530.24 |
| Near | ||||||||||
| Lateral | 1056 | −1.78±4.24 | −0.12–0.21 | 1.00 | −15 | −18.00 | 1.00 | 9.00 | 0.26 | 2.16 |
| Vertical | 1056 | 0.03±0.36 | 0.02–0.06 | 0.00 | −2.00 | 8.00 | 0.00 | 0.00 | 14.91 | 279.68 |
| Near fusional vergences | ||||||||||
| BI break | 1055 | 17.37±5.45 | 17.04–17.7 | 0.18 | 2.00 | 45.00 | 14.00 | 20.00 | 0.66 | 5.02 |
| BI recovery | 1055 | 12.52±4.23 | 12.26–12.77 | 12.00 | 0.00 | 35.00 | 10.00 | 16.00 | 0.07 | 4.45 |
| BO break | 1055 | 25.38±9.16 | 24.82–25.93 | 25.00 | 2.00 | 45.00 | 20.00 | 30.00 | −0.41 | 2.58 |
| BO recovery | 1055 | 17.49±6.77 | 17.09–17.9 | 18.00 | 0.00 | 40.00 | 14.00 | 20.00 | 0.35 | 4.47 |
| Accommodation | ||||||||||
| AA bin | 1056 | 15.6±3.19 | 15.41–15.8 | 15.00 | 5.00 | 20.00 | 14.00 | 18.00 | −0.58 | 3.11 |
| AF±2mon | 1005 | 8.69±3.41 | 8.48–8.9 | 10.00 | 0.00 | 16.00 | 6.00 | 12.00 | −0.77 | 2.81 |
| AF bin±2 | 996 | 8.75±3.46 | 8.53–8.96 | 10.00 | 0.00 | 14.00 | 6.00 | 12.00 | −0.68 | 2.56 |
| AF mon +2 | 1052 | 10.25±3.13 | 10.07–10.44 | 11.00 | 0.00 | 18.00 | 10.00 | 12.00 | −1.44 | 4.99 |
| AF bin −2 | 1044 | 9.78±3.35 | 9.57–9.98 | 10.5 | 0.00 | 20.00 | 8.00 | 12.00 | −0.94 | 3.64 |
| AF bin +2 | 1044 | 10.39±3.22 | 10.2–10.59 | 11.5 | 0.00 | 19.00 | 9.00 | 12.00 | −1.26 | 4.37 |
| AF mon −2 | 1044 | 9.78±3.25 | 9.58–9.97 | 10.00 | 0.00 | 20.00 | 8.00 | 12.00 | −0.98 | 3.93 |
| AR | 1051 | 0.55±0.21 | 0.54–0.56 | 0.50 | –0.75 | 1.50 | 0.50 | 0.50 | 0.06 | 9.13 |
| NRA | 1055 | 2.17±0.48 | 2.14–2.2 | 2.25 | –2.5 | 3.50 | 2.00 | 2.50 | −2.76 | 21.67 |
| PRA | 1055 | −2.44±0 .71 | −2.49–2.4 | −2.75 | –3.75 | 2.75 | −3.00 | −2.00 | 1.43 | 7.41 |
For lateral phoria, minus denotes exophoria while plus represents esophoria. For vertical phoria, plus values represent hyperphoria. SS=school setting, CS=clinic setting. PU=push up. AT=accommodative target. RL=red lens. PL=pen light. PLRG=pen light, red green.mon=monocular, bin=binocular.
The accommodative-convergence (AC/A) ratio is a measure of the change in accommodation convergence that occurs when a person accommodates or relaxes accommodation by a given amount.58 The AC/A ratio were calculated using the formula:
where IPD=interpupillary distance; NFD=near fixation distance in metres; Hn=near phoria (Esophoria is plus and exophoria is minus); Hf=far phoria (Esophoria is plus and exophoria is minus).
The mean and standard deviation of calculated AC/A ratio for the study was 5.9±0.9.
Clinical measures, gender and ageAge did not significantly influence the distribution of most vergence measures which may be due to the restricted age range of 13–18 years studied whereas some accommodative measures showed significant associations with age. Monocular accommodative facility, amplitude of accommodation and negative relative accommodation decreased with age (F=2, df=5, p=0.01). For gender, the means for near lateral and distance lateral phoria were significantly higher in males than females (p=0.01) while amplitude of accommodative were reduced in females compared to males (p=0.01).
DiscussionThe aim of this study was to establish reference values for accommodative and vergence measures in children aged between 13 and 18 years as aspects of the data is not available for this age range in an African population. The data for near phoria and fusional vergences, accommodative response, as well as, relative accommodation did not vary markedly across reviewed studies. This suggests that the normative range obtained in this study for those variables may be applicable to other populations for age ranges 13–40 years, which is the maximum age for studies reviewed. Due to the differences in study designs, findings from this study will be discussed in relation to those with similar designs, especially regarding race and measurement techniques. In this report, the mean values are reference point of comparison as most studies reported only mean values as “normative.” The mean values for some studies were also reviewed regardless whether the authors aimed to determine normative data or not. It is intended to investigate the trend of distribution for the variables, using the mean value. Selected studies which had participants’ ages higher than those in the present study and including much older studies (Tables 2–7) were also reviewed for the same purpose of studying trends.
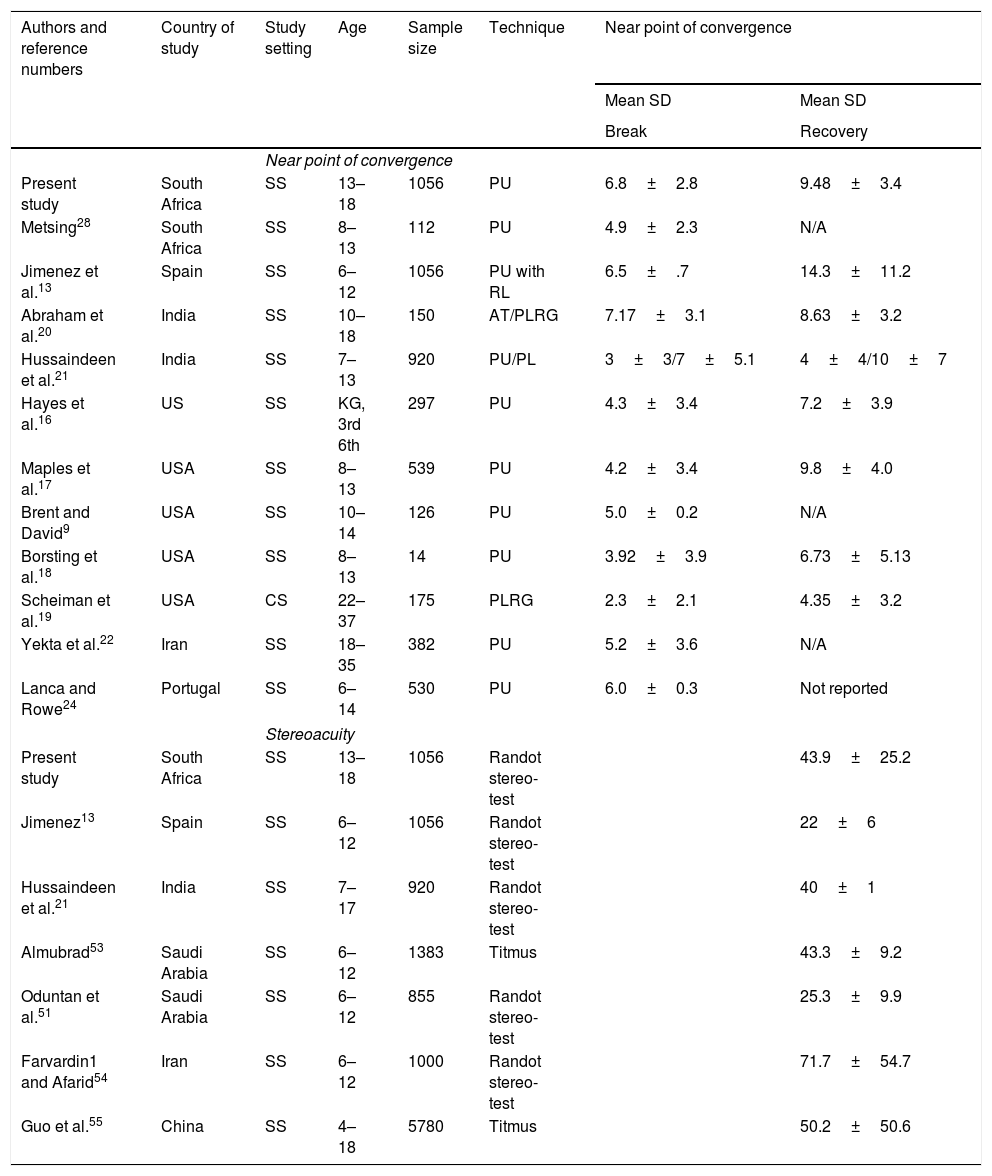
Mean and standard deviation for near point of convergence and stereoacuity from previous studies.
| Authors and reference numbers | Country of study | Study setting | Age | Sample size | Technique | Near point of convergence | |
|---|---|---|---|---|---|---|---|
| Mean SD | Mean SD | ||||||
| Break | Recovery | ||||||
| Near point of convergence | |||||||
| Present study | South Africa | SS | 13–18 | 1056 | PU | 6.8±2.8 | 9.48±3.4 |
| Metsing28 | South Africa | SS | 8–13 | 112 | PU | 4.9±2.3 | N/A |
| Jimenez et al.13 | Spain | SS | 6–12 | 1056 | PU with RL | 6.5±.7 | 14.3±11.2 |
| Abraham et al.20 | India | SS | 10–18 | 150 | AT/PLRG | 7.17±3.1 | 8.63±3.2 |
| Hussaindeen et al.21 | India | SS | 7–13 | 920 | PU/PL | 3±3/7±5.1 | 4±4/10±7 |
| Hayes et al.16 | US | SS | KG, 3rd 6th | 297 | PU | 4.3±3.4 | 7.2±3.9 |
| Maples et al.17 | USA | SS | 8–13 | 539 | PU | 4.2±3.4 | 9.8±4.0 |
| Brent and David9 | USA | SS | 10–14 | 126 | PU | 5.0±0.2 | N/A |
| Borsting et al.18 | USA | SS | 8–13 | 14 | PU | 3.92±3.9 | 6.73±5.13 |
| Scheiman et al.19 | USA | CS | 22–37 | 175 | PLRG | 2.3±2.1 | 4.35±3.2 |
| Yekta et al.22 | Iran | SS | 18–35 | 382 | PU | 5.2±3.6 | N/A |
| Lanca and Rowe24 | Portugal | SS | 6–14 | 530 | PU | 6.0±0.3 | Not reported |
| Stereoacuity | |||||||
| Present study | South Africa | SS | 13–18 | 1056 | Randot stereo-test | 43.9±25.2 | |
| Jimenez13 | Spain | SS | 6–12 | 1056 | Randot stereo-test | 22±6 | |
| Hussaindeen et al.21 | India | SS | 7–17 | 920 | Randot stereo-test | 40±1 | |
| Almubrad53 | Saudi Arabia | SS | 6–12 | 1383 | Titmus | 43.3±9.2 | |
| Oduntan et al.51 | Saudi Arabia | SS | 6–12 | 855 | Randot stereo-test | 25.3±9.9 | |
| Farvardin1 and Afarid54 | Iran | SS | 6–12 | 1000 | Randot stereo-test | 71.7±54.7 | |
| Guo et al.55 | China | SS | 4–18 | 5780 | Titmus | 50.2±50.6 | |
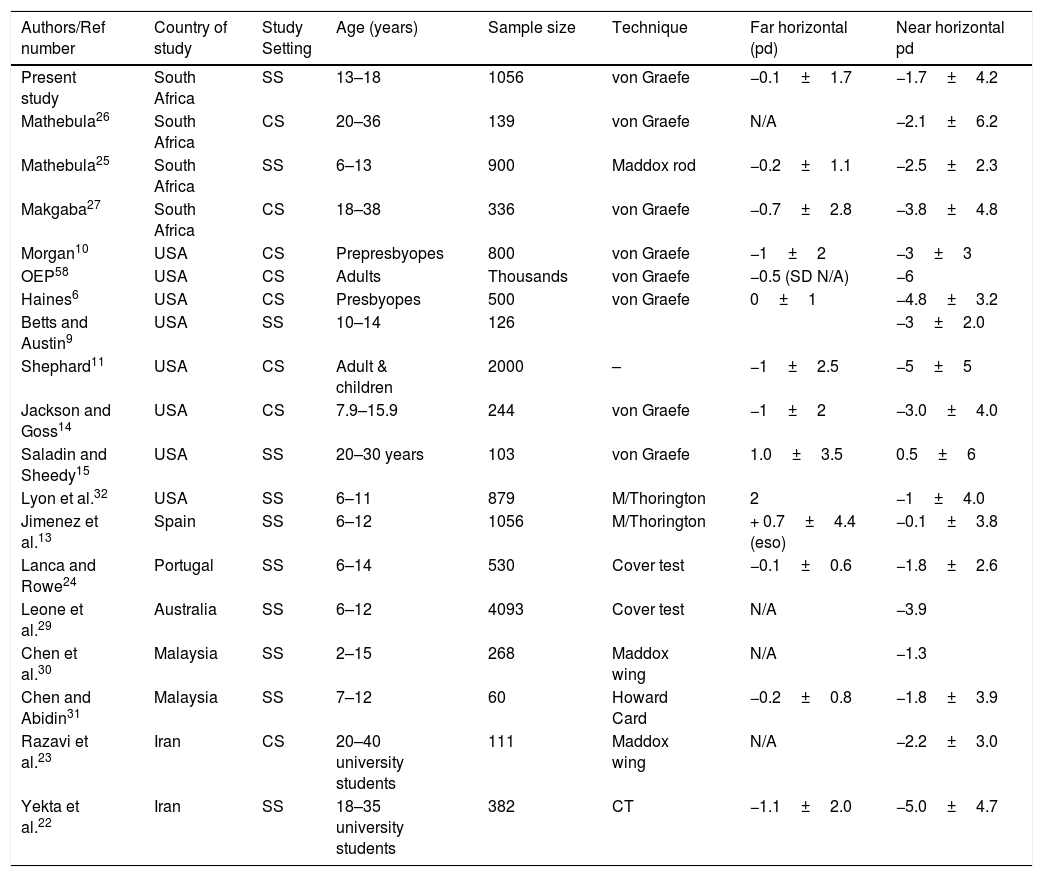
Summary of findings on means and standard deviations for lateral heterophoria at far and near fixations.
| Authors/Ref number | Country of study | Study Setting | Age (years) | Sample size | Technique | Far horizontal (pd) | Near horizontal pd |
|---|---|---|---|---|---|---|---|
| Present study | South Africa | SS | 13–18 | 1056 | von Graefe | −0.1±1.7 | −1.7±4.2 |
| Mathebula26 | South Africa | CS | 20–36 | 139 | von Graefe | N/A | −2.1±6.2 |
| Mathebula25 | South Africa | SS | 6–13 | 900 | Maddox rod | −0.2±1.1 | −2.5±2.3 |
| Makgaba27 | South Africa | CS | 18–38 | 336 | von Graefe | −0.7±2.8 | −3.8±4.8 |
| Morgan10 | USA | CS | Prepresbyopes | 800 | von Graefe | −1±2 | −3±3 |
| OEP58 | USA | CS | Adults | Thousands | von Graefe | −0.5 (SD N/A) | −6 |
| Haines6 | USA | CS | Presbyopes | 500 | von Graefe | 0±1 | −4.8±3.2 |
| Betts and Austin9 | USA | SS | 10–14 | 126 | −3±2.0 | ||
| Shephard11 | USA | CS | Adult & children | 2000 | – | −1±2.5 | −5±5 |
| Jackson and Goss14 | USA | CS | 7.9–15.9 | 244 | von Graefe | −1±2 | −3.0±4.0 |
| Saladin and Sheedy15 | USA | SS | 20–30 years | 103 | von Graefe | 1.0±3.5 | 0.5±6 |
| Lyon et al.32 | USA | SS | 6–11 | 879 | M/Thorington | 2 | −1±4.0 |
| Jimenez et al.13 | Spain | SS | 6–12 | 1056 | M/Thorington | + 0.7±4.4 (eso) | −0.1±3.8 |
| Lanca and Rowe24 | Portugal | SS | 6–14 | 530 | Cover test | −0.1±0.6 | −1.8±2.6 |
| Leone et al.29 | Australia | SS | 6–12 | 4093 | Cover test | N/A | −3.9 |
| Chen et al.30 | Malaysia | SS | 2–15 | 268 | Maddox wing | N/A | −1.3 |
| Chen and Abidin31 | Malaysia | SS | 7–12 | 60 | Howard Card | −0.2±0.8 | −1.8±3.9 |
| Razavi et al.23 | Iran | CS | 20–40 university students | 111 | Maddox wing | N/A | −2.2±3.0 |
| Yekta et al.22 | Iran | SS | 18–35 university students | 382 | CT | −1.1±2.0 | −5.0±4.7 |
Values in minus sign=exophoria. N/A=information is not available.
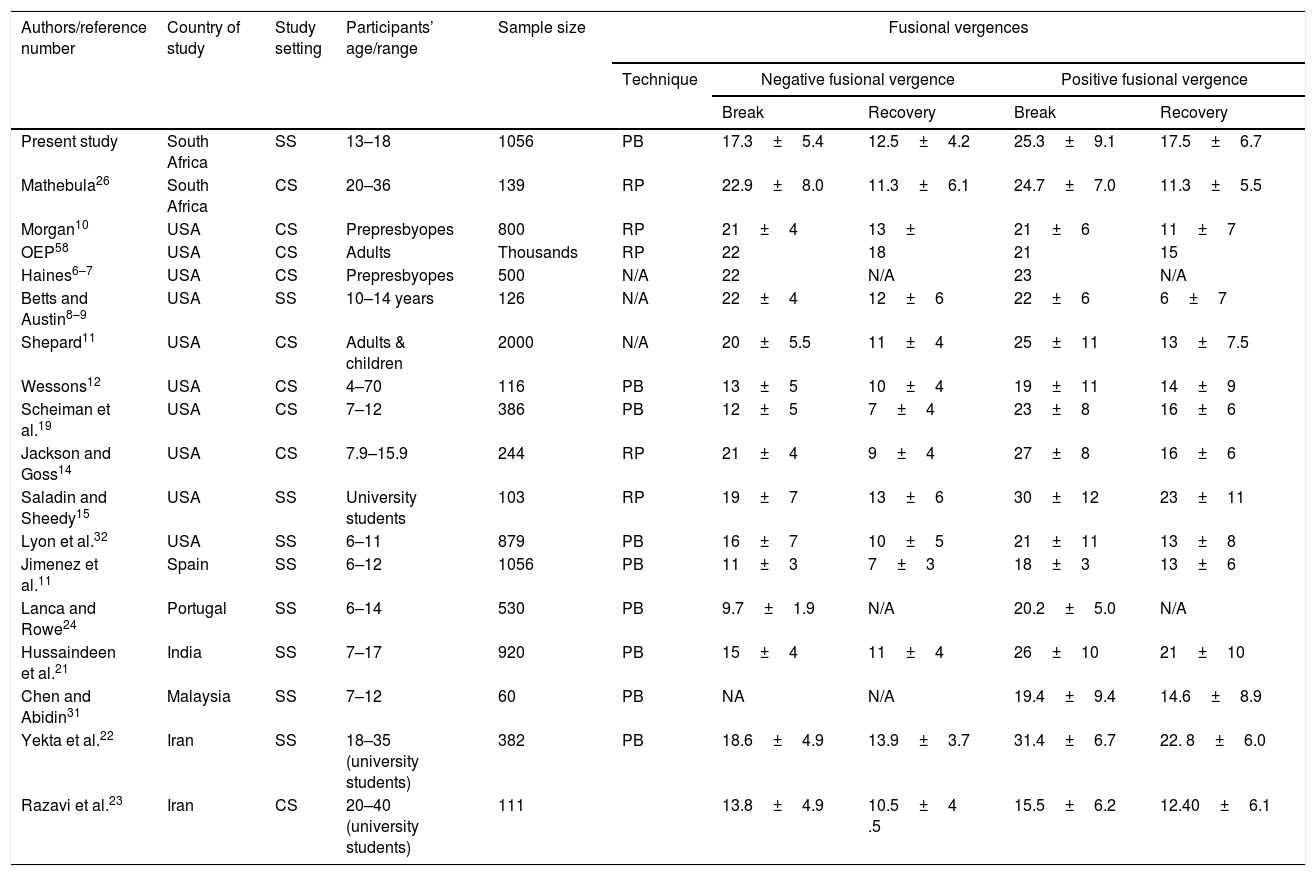
Summary of means and standard deviation for near fusional vergences from present study and available studies reviewed.
| Authors/reference number | Country of study | Study setting | Participants’ age/range | Sample size | Fusional vergences | ||||
|---|---|---|---|---|---|---|---|---|---|
| Technique | Negative fusional vergence | Positive fusional vergence | |||||||
| Break | Recovery | Break | Recovery | ||||||
| Present study | South Africa | SS | 13–18 | 1056 | PB | 17.3±5.4 | 12.5±4.2 | 25.3±9.1 | 17.5±6.7 |
| Mathebula26 | South Africa | CS | 20–36 | 139 | RP | 22.9±8.0 | 11.3±6.1 | 24.7±7.0 | 11.3±5.5 |
| Morgan10 | USA | CS | Prepresbyopes | 800 | RP | 21±4 | 13± | 21±6 | 11±7 |
| OEP58 | USA | CS | Adults | Thousands | RP | 22 | 18 | 21 | 15 |
| Haines6–7 | USA | CS | Prepresbyopes | 500 | N/A | 22 | N/A | 23 | N/A |
| Betts and Austin8–9 | USA | SS | 10–14 years | 126 | N/A | 22±4 | 12±6 | 22±6 | 6±7 |
| Shepard11 | USA | CS | Adults & children | 2000 | N/A | 20±5.5 | 11±4 | 25±11 | 13±7.5 |
| Wessons12 | USA | CS | 4–70 | 116 | PB | 13±5 | 10±4 | 19±11 | 14±9 |
| Scheiman et al.19 | USA | CS | 7–12 | 386 | PB | 12±5 | 7±4 | 23±8 | 16±6 |
| Jackson and Goss14 | USA | CS | 7.9–15.9 | 244 | RP | 21±4 | 9±4 | 27±8 | 16±6 |
| Saladin and Sheedy15 | USA | SS | University students | 103 | RP | 19±7 | 13±6 | 30±12 | 23±11 |
| Lyon et al.32 | USA | SS | 6–11 | 879 | PB | 16±7 | 10±5 | 21±11 | 13±8 |
| Jimenez et al.11 | Spain | SS | 6–12 | 1056 | PB | 11±3 | 7±3 | 18±3 | 13±6 |
| Lanca and Rowe24 | Portugal | SS | 6–14 | 530 | PB | 9.7±1.9 | N/A | 20.2±5.0 | N/A |
| Hussaindeen et al.21 | India | SS | 7–17 | 920 | PB | 15±4 | 11±4 | 26±10 | 21±10 |
| Chen and Abidin31 | Malaysia | SS | 7–12 | 60 | PB | NA | N/A | 19.4±9.4 | 14.6±8.9 |
| Yekta et al.22 | Iran | SS | 18–35 (university students) | 382 | PB | 18.6±4.9 | 13.9±3.7 | 31.4±6.7 | 22. 8±6.0 |
| Razavi et al.23 | Iran | CS | 20–40 (university students) | 111 | 13.8±4.9 | 10.5±4 .5 | 15.5±6.2 | 12.40±6.1 | |
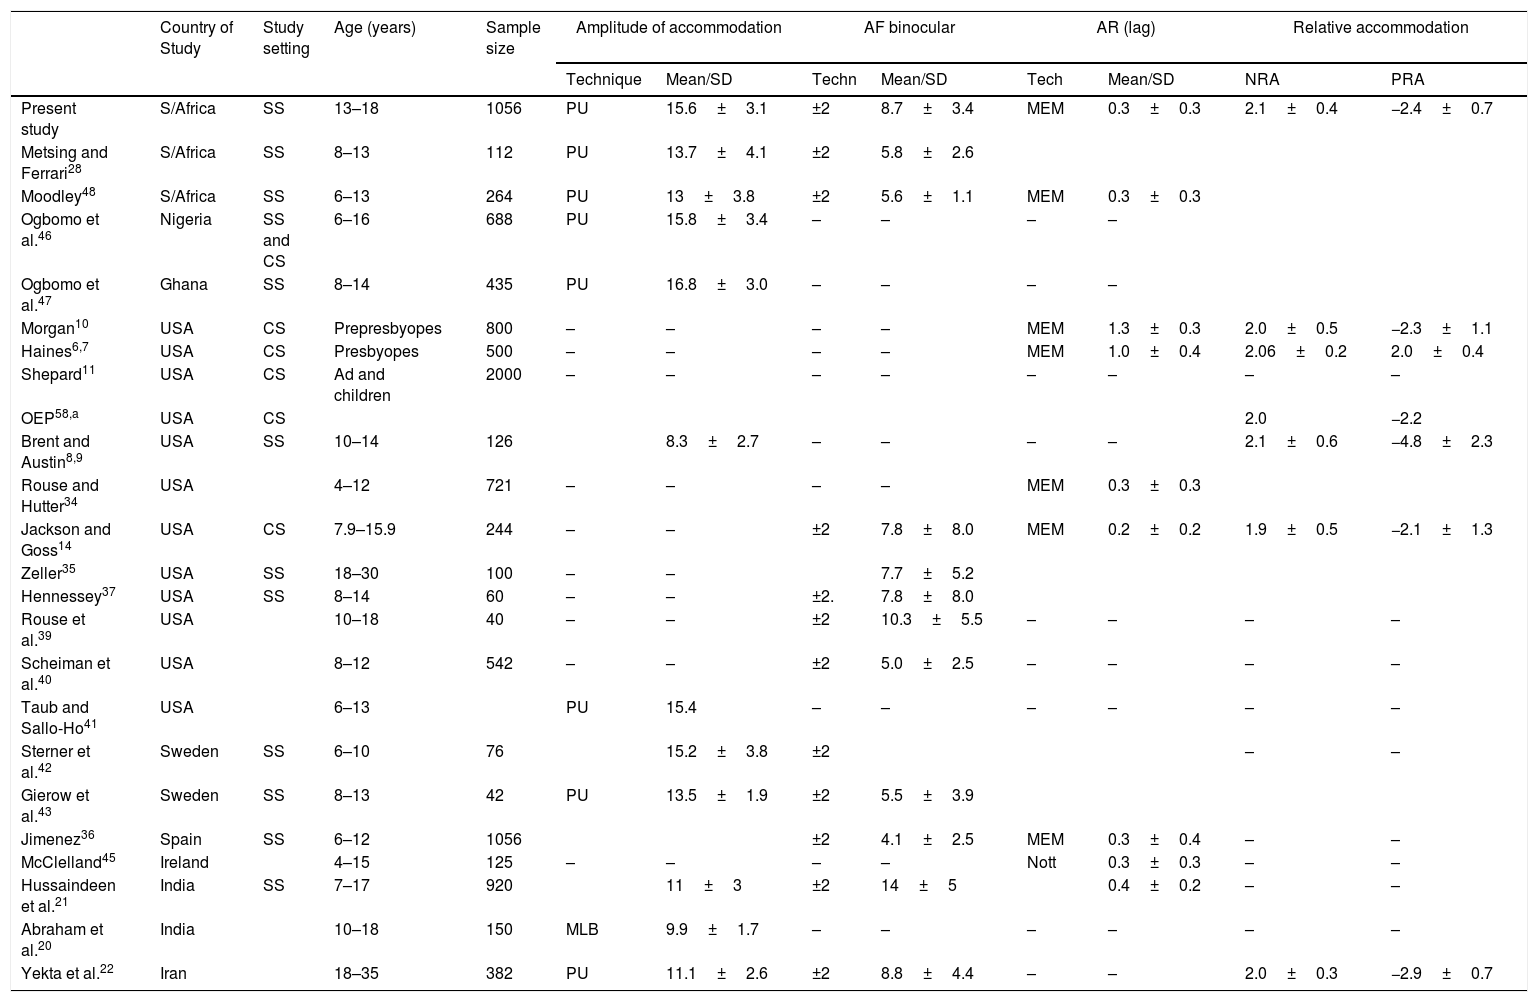
Means and standard deviations on accommodative measures from reviewed studies.
| Country of Study | Study setting | Age (years) | Sample size | Amplitude of accommodation | AF binocular | AR (lag) | Relative accommodation | |||||
|---|---|---|---|---|---|---|---|---|---|---|---|---|
| Technique | Mean/SD | Techn | Mean/SD | Tech | Mean/SD | NRA | PRA | |||||
| Present study | S/Africa | SS | 13–18 | 1056 | PU | 15.6±3.1 | ±2 | 8.7±3.4 | MEM | 0.3±0.3 | 2.1±0.4 | −2.4±0.7 |
| Metsing and Ferrari28 | S/Africa | SS | 8–13 | 112 | PU | 13.7±4.1 | ±2 | 5.8±2.6 | ||||
| Moodley48 | S/Africa | SS | 6–13 | 264 | PU | 13±3.8 | ±2 | 5.6±1.1 | MEM | 0.3±0.3 | ||
| Ogbomo et al.46 | Nigeria | SS and CS | 6–16 | 688 | PU | 15.8±3.4 | – | – | – | – | ||
| Ogbomo et al.47 | Ghana | SS | 8–14 | 435 | PU | 16.8±3.0 | – | – | – | – | ||
| Morgan10 | USA | CS | Prepresbyopes | 800 | – | – | – | – | MEM | 1.3±0.3 | 2.0±0.5 | −2.3±1.1 |
| Haines6,7 | USA | CS | Presbyopes | 500 | – | – | – | – | MEM | 1.0±0.4 | 2.06±0.2 | 2.0±0.4 |
| Shepard11 | USA | CS | Ad and children | 2000 | – | – | – | – | – | – | – | – |
| OEP58,a | USA | CS | 2.0 | −2.2 | ||||||||
| Brent and Austin8,9 | USA | SS | 10–14 | 126 | 8.3±2.7 | – | – | – | – | 2.1±0.6 | −4.8±2.3 | |
| Rouse and Hutter34 | USA | 4–12 | 721 | – | – | – | – | MEM | 0.3±0.3 | |||
| Jackson and Goss14 | USA | CS | 7.9–15.9 | 244 | – | – | ±2 | 7.8±8.0 | MEM | 0.2±0.2 | 1.9±0.5 | −2.1±1.3 |
| Zeller35 | USA | SS | 18–30 | 100 | – | – | 7.7±5.2 | |||||
| Hennessey37 | USA | SS | 8–14 | 60 | – | – | ±2. | 7.8±8.0 | ||||
| Rouse et al.39 | USA | 10–18 | 40 | – | – | ±2 | 10.3±5.5 | – | – | – | – | |
| Scheiman et al.40 | USA | 8–12 | 542 | – | – | ±2 | 5.0±2.5 | – | – | – | – | |
| Taub and Sallo-Ho41 | USA | 6–13 | PU | 15.4 | – | – | – | – | – | – | ||
| Sterner et al.42 | Sweden | SS | 6–10 | 76 | 15.2±3.8 | ±2 | – | – | ||||
| Gierow et al.43 | Sweden | SS | 8–13 | 42 | PU | 13.5±1.9 | ±2 | 5.5±3.9 | ||||
| Jimenez36 | Spain | SS | 6–12 | 1056 | ±2 | 4.1±2.5 | MEM | 0.3±0.4 | – | – | ||
| McClelland45 | Ireland | 4–15 | 125 | – | – | – | – | Nott | 0.3±0.3 | – | – | |
| Hussaindeen et al.21 | India | SS | 7–17 | 920 | 11±3 | ±2 | 14±5 | 0.4±0.2 | – | – | ||
| Abraham et al.20 | India | 10–18 | 150 | MLB | 9.9±1.7 | – | – | – | – | – | – | |
| Yekta et al.22 | Iran | 18–35 | 382 | PU | 11.1±2.6 | ±2 | 8.8±4.4 | – | – | 2.0±0.3 | −2.9±0.7 | |
Cited in Scheiman and Wick.58 Ad=Adult. OEP=Optometric Extension Programme. Techn=Technique. Blank spaces indicate that information is not available. PU=push up. MLB=minus lens-to-blur. MEM=monocular estimation method.
Range of normal for stereoacuity, accommodative and vergence measures for present study.
| Clinical measures | N | Measurement techniques | Mean, SD | Range of normal (±1SD) to the closest practical number |
|---|---|---|---|---|
| Stereoacuity | 1055 | Randot stereo test | 43.95±25.23 | 17 to 69s arc |
| Vergence measures | ||||
| Near point of convergence (cm) | RAF rule/Push Up | |||
| NPC break | 1056 | 6.88±2.88 | 5 to 10 | |
| NPC recovery | 1056 | 9.48±3.47 | 6 to 13 | |
| Heterophoria (pd) | 1056 | Von Graefe | ||
| Distance | 1056 | |||
| Lateral | 1056 | −0.09±1.71 | 2 eso to 2 exo | |
| Vertical | 1056 | 0.02±0.29 | Ortho to 0.50 exo | |
| Near | 1056 | |||
| Near lateral | 1056 | −1.78±4.24 | 2.5 to 6 exo | |
| Near vertical | 1056 | −0.03±0.36 | Ortho to 0.50 exo | |
| Fusional vergences (pd) | 1056 | Prism bars | ||
| BI break | 1054 | 17.37±5.45 | 12–23 | |
| BI recovery | 1054 | 12.52±4.23 | 8–17 | |
| BO break | 1054 | 25.38±9.16 | 16–35 | |
| BO recovery | 1054 | 17.49±9.16 | 11–24 | |
| Accommodation parameters | ||||
| Amplitude of accommodation (D) | 1056 | Royal Air force rule, with push up | 15.6±3.19 | 12 to 18 |
| Accommodative response (D) | 1051 | Monocular estimation method | 0.55±0 .21 | Plano to 0.75 |
| Negative relative accommodation (DS) | 1055 | Plus lenses on Phoropter | 2.17±0.48 | 1.7 to 2. 5 |
| Positive relative accommodation (DS) | 1055 | Minus lenses on Phoropter | −2.44±0.7 | −2 to −3.0 |
| Binocular accommodative facility (cpm) | 1004 | ±2 flipper lenses | 8.75±3.46 | 5 to 12 |
| AC/A ratio (D) | Calculated | 5.9±0.9 | 5 to 6.80 | |
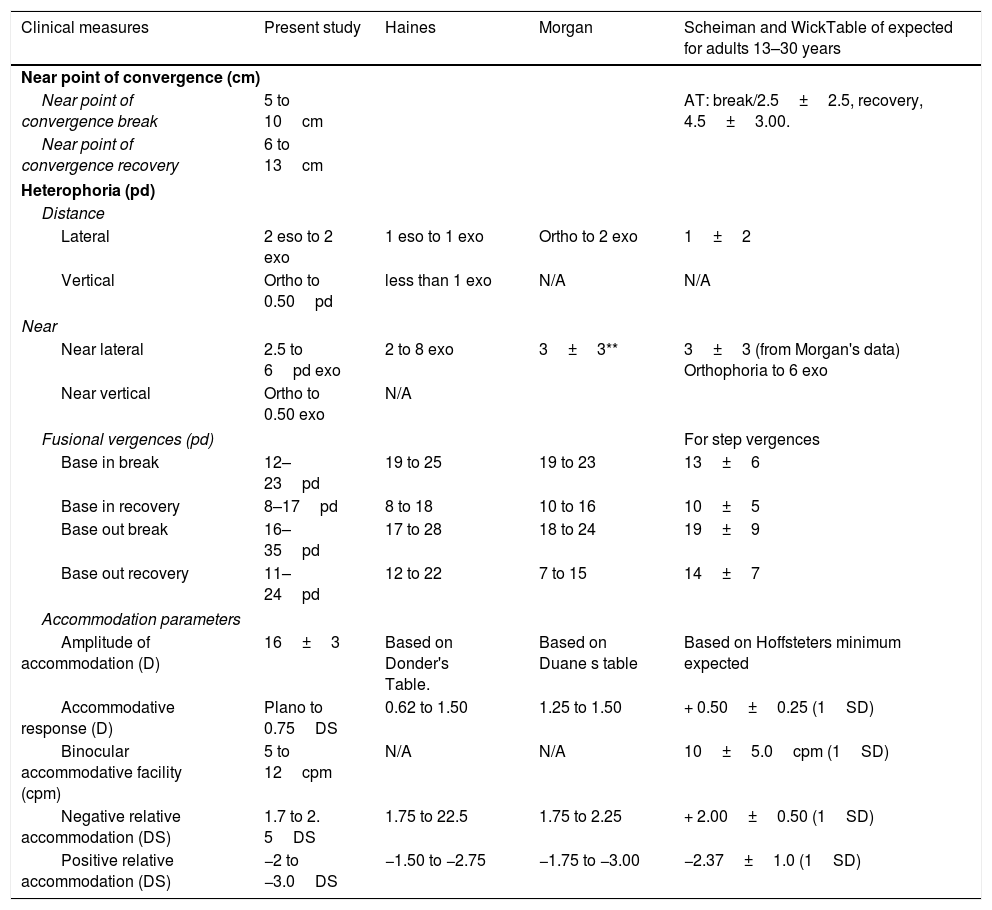
Range of normal for accommodative and vergence measures in present study compared to findings from available studies.
| Clinical measures | Present study | Haines | Morgan | Scheiman and WickTable of expected for adults 13–30 years |
|---|---|---|---|---|
| Near point of convergence (cm) | ||||
| Near point of convergence break | 5 to 10cm | AT: break/2.5±2.5, recovery, 4.5±3.00. | ||
| Near point of convergence recovery | 6 to 13cm | |||
| Heterophoria (pd) | ||||
| Distance | ||||
| Lateral | 2 eso to 2 exo | 1 eso to 1 exo | Ortho to 2 exo | 1±2 |
| Vertical | Ortho to 0.50pd | less than 1 exo | N/A | N/A |
| Near | ||||
| Near lateral | 2.5 to 6pd exo | 2 to 8 exo | 3±3** | 3±3 (from Morgan's data) Orthophoria to 6 exo |
| Near vertical | Ortho to 0.50 exo | N/A | ||
| Fusional vergences (pd) | For step vergences | |||
| Base in break | 12–23pd | 19 to 25 | 19 to 23 | 13±6 |
| Base in recovery | 8–17pd | 8 to 18 | 10 to 16 | 10±5 |
| Base out break | 16–35pd | 17 to 28 | 18 to 24 | 19±9 |
| Base out recovery | 11–24pd | 12 to 22 | 7 to 15 | 14±7 |
| Accommodation parameters | ||||
| Amplitude of accommodation (D) | 16±3 | Based on Donder's Table. | Based on Duane s table | Based on Hoffsteters minimum expected |
| Accommodative response (D) | Plano to 0.75DS | 0.62 to 1.50 | 1.25 to 1.50 | + 0.50±0.25 (1SD) |
| Binocular accommodative facility (cpm) | 5 to 12cpm | N/A | N/A | 10±5.0cpm (1SD) |
| Negative relative accommodation (DS) | 1.7 to 2. 5DS | 1.75 to 22.5 | 1.75 to 2.25 | + 2.00±0.50 (1SD) |
| Positive relative accommodation (DS) | −2 to −3.0DS | −1.50 to −2.75 | −1.75 to −3.00 | −2.37±1.0 (1SD) |
A draw back with using the mean as norms is that the variability within the data set and possibility of present of outliers are not considered. To minimize this, the mean and SD was utilized to obtain the range of normal in the present study. Subsequently, the possibilities of creating syndromes of clinical signs using variables that are correlated were discussed. This approach is the basis of the Interpretive Method of Analysis.58 Furthermore, the mean±1SD as applied in the present study is the most commonly applied in optometric literature. However, Morgan 10 applied the mean±0.50SD in the seminal article and attributed that to the data set to have had … “greater percentage of subjects than is normal”. Another widely-cited normative data is the OEP normative data. These data were described as values below or above the mean values of thousands of patients and were not necessarily normative values based on population statistic.60 Birnbaum60 further noted that the OEP data were estimates of minimum values required if an individual is to withstand the impact of near point stress and maintain satisfactory performance.60 The table of expected in Scheiman and Wick58 were obtained from various studies, including most of the studies cited in this report.
Vergence measuresThe vergence system which include the NPC, phoria and fusional vergences coordinate eye movement and fuses the retinal image, enabling accurate alignment of the eyes to maintain single binocular vision, as well as, to facilitate efficient reading.58 The NPC, phoria and fusional vergence are the main measures used to classify vergence anomalies and measuring NPC several times is often recommended to reveal fatigue.58The NPC is commonly measured using the Push Up techniques with various approaches. (Table 2) The NPC break of 10cm has long been used as a cut-off mark for NPC break. Similarly, a survey of optometrists in the USA found NPC 10cm to be the most applied single criteria to diagnose convergence insufficiency (CI).61 The mean break of 6.89cm in the present study is higher than 4.9cm from another study in South Africa28 which enrolled younger participants and found NPC break of 4.9cm. This result may be considered an expected as NPC break values are likely to become more receded with increasing age.13 For non-African populations, three studies13,20,24 reported results similar to the present study for similar participants age ranges. Contrary to the present study the authors13,20,24 used the Push Up technique with non-accommodative target. Hussaindeen et al., in India21 reported relatively low mean NPC of 3cm for children aged 7–13 years using the accommodative target (AT) and 7cm with penlight and push up (PU) technique.
Although the AT may be inappropriate especially in cases of reduced amplitude of accommodation,62 a limitation with the use of a non-accommodative target is that a light source target is a diffuse low spatial frequency source and may cause accommodative vergence to fluctuate and give inconsistent readings.16,63,64 During NPC testing, the patient's convergence ability is determined using all aspects of convergence which include fusional, proximal, and accommodative-convergence. Hence, as the AT maximizes the accommodative and convergence demand, the NPC will be maximal with an AT.19 The AT gives less variability19 and produces a more accurate measurement of the NPC than the non-accommodative target.16,19,23 However, measuring the NPC with the red lens may reduce the influence of voluntary convergence.16,19,23 In general, because AT gives more accurate readings,19,23 it could be a preferred method in routine NPC measurements. The test could be repeated using the penlight with a red-green filter if findings from the AT are borderline, or in cases where there are other signs or symptoms indicative of CI.19 The minimum limit for the RAF rule is 5cm which may restrict its use. It could also be observed from Table 2 that most studies on the USA populations measured NPC using the Astron accommodative rule in PU technique16–19 and reported relatively low mean break values regardless of the participants’ age range. The NPC was measured without distance refractive compensation and the mean spherical equivalent refraction for this sample is relatively low at −0.05±0.51 and may not have influenced the dynamics of accommodative-vergence disorders in this study.65
Heterophoria is another important vergence measure used to classify accommodative-vergence anomalies. During near task, the resulting near phoria measures the degree to which the eyes over-converge (esophoria) or under-converge (exophoria) in relation to the plane of the target.66 Various techniques are used to measure phoria with resultant varied findings in most cases (Table 3). The von Graefe is a commonly used phoria dissociation technique58,67 which has a good repeatability and reliability. It enables even the smallest amount of phoria to be recorded and the test instructions are easy to understand for high school students. A limitation is that the von Graefe approach may give slightly higher near phoria readings than other techniques.68
Vergence measures vary with race, ethnicity and age.31 The distribution patterns for aspects of heterophoria and near fusional ranges in the present study are somewhat close to a normal distribution and are similar to those by Jackson and Goss.14 Despite the differences in study designs, there appears to be a fairly consistent trend on the phoria results reported across studies (Table 3). Regarding race, the mean for near lateral phoria findings of heterophoria in this study is comparable to those from other studies in South Africa,25,26 regardless of age and technique. For non-African populations, range of normal for near lateral phoria in the present study is comparable to those proposed by Morgan,10 Scheiman and Wick58 and Haines6,7 (Table 7). Regardless of different measurement techniques, studies with younger participants reported lower mean exophoria than those which enrolled older participants with overall mean lateral phoria range between 0.1 and 6pd. It is known that the mean phoria at near seem to remain fairly stable with age, within approximately 2pd for most children. Beyond 6 years of age when the child first begins school, a greater incidence of heterophoria may occur due to changes in the visual system which may be related to beginning school activities.57,60 Birnbaum60 attributed such changes to the development of near exophoria occurring from near point stress and poor adaptation to the anomalies may result in decompensation or suppression.57,60 From age 20 years, humans become progressively more exophoric for near vision and reaching around 5pd at age 50 years.69 Overall, there is no marked difference in findings for near phoria across studies (Table 3).
Heterophoria is not a good predictor of symptoms58,68 and its measures are useful mainly when considered in relation to the fusional vergence ability to compensate for the demand using the Sheard's criteria.58,68 The commonly applied techniques used to measure fusional vergences are the Risley prism on the Phoropter, the Rotary prisms and the Prism bar in free space. Positive fusional vergence tend to decrease with age (Table 4) otherwise there are no marked difference in vergences ranges and the PFV range between 18 and 31pd (Table 4) and 17 and 22pd for NFV for age ranges between 6 and 40 years. The range of normal is comparable to those by Haines6,7 and Morgan10 and Scheiman and wick.5,8 The prism bar technique as used in the present study allows for measurement of fusional vergences in free space, and the examiner is able to observe eye participant's eye movement and take objective readings. However, although the step changes of prism powers and difference in field of view compared with the Risley prism may be a concern. In addition, fusional vergence measurement is influenced by the use of or lack of suppression control. Although suppression was screened for using the Worth-four-dot test in the present study, it is often more appropriate to measure fusional vergences with a suppression control. Assessing fusional reserves without controlling for suppression may result in high break values; when suppression is controlled, the average vergence values may be lower as the test is stopped when the suppression is detected. If suppression is not monitored, the break is not detected until the stimulus is outside the suppression zone and a higher vergence value is obtained.70
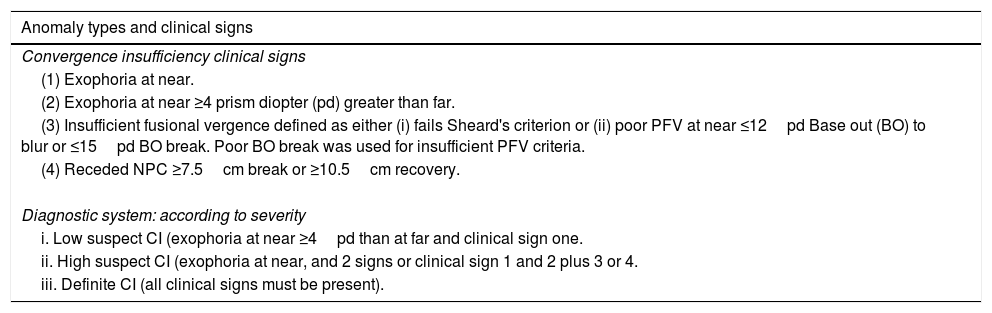
Prior to the advent of the Convergence Insufficiency Reading Study (CIRS) criteria, a survey by the College of Optometrists in Vision Development (COVD) determined the criteria practitioners applied to diagnose CI.61 They found that 93% used single NPC criterion, 80% PFV criteria (60.5% Morgan's data or OEP norms, Sheard's 3.5%, 25% did not respond), 75% used near phoria while 67% used the presence of symptoms. For questions on the number of clinical signs used to diagnose CI, 35% favoured single criteria while 49% preferred the use of multiple criteria to define CI.61 Considering the complexity of the accommodative-vergence system, classifying anomalies based on single clinical signs may be inadequate and the syndrome criteria which uses multiple clinical signs are prefferred.6,7,10 One of such syndrome classification is the CIRS group which standardized the definition of CI.64,66 With this approach, CI is defined based on a number NPC, exophoria and PFV with a subsequent system where CI is classified according to the severity such as low suspect, high suspect and definite CI.64,66 The NPC break cut-off in the CIRS classification criteria were obtained from Scheiman et al.58 whose participants were aged between 22 and 37 years, fusional vergence criteria was derived from Morgan's study10 of prepresbyopes while the exophoria was obtained from the study by Daum71 who reported a retrospective review of charts for patients aged 2–46 years. The CIRS use of data from the above studies10,58,71 suggests that age may not affect these data as adults and childrens’ data do not seem to differ markedly. The range of normal for NPC and fusional vergence from the present study corresponds with the CIRS criteria.
Accommodative measuresOnly the amplitude of accommodation (AA), accommodative facility (AF), accommodative response (AR) and relative accommodation (RA) were considered in this study. With the exception of a few, most studies measured the AA using the Push Up (PU) technique (Table 5). The mean AA findings in the present study (15.6D) is comparable to findings from Ovenseri-Ogbomo in Ghana (16.8D)46 and Ovenseri-Ogbomo in Nigeria (15.8D)47 for participants with comparable age range. Two studies28,48 on South African populations which enrolled younger children reported lower AA. Given that the present study and the other studies28,48 used a similar PU technique with the RAF rule, only one optometrist collected data for the present study while that was not the case in other studies on South African populations.28,48 However, there appears to be a pattern of lower AA in younger participants.21,28,42,43,48 (Table 5) Sterner et al.42 highlighted this trend in their study of Swedish children aged between 6 and 10 years where the AA was found to be “not as good as expected …” The measurement techniques did not appear to influence findings across studies although the Minus-lens-to-blur technique has been reported to underestimate AA compared to Push PU or Push Away techniques.41
Accommodation facility relates to the individual's ability to shift focus quickly and efficiently for varying distances and the process is used extensively in the classroom.58 All the available studies were consistent in the use of the lens flippers to measure AF. However, the AF testing is a subjective test and may be uncomfortable and difficult for younger children to comprehend. Although suppression was screened for using the Worth-four-dot test in the present study, it is often more appropriate to assess AF with a suppression control.58 Compared to findings from two studies in South Africa28,48 there appears to be a consistent pattern as participants with younger age reported lower values for AF (Table 5). For binocular AF, the 8.75cpm found in the present study is higher than findings from two studies in South African studies28,48: Moodley,48 5.6cpm and Metsing and Ferrari, 5.84cpm.28 Findings from present study are comparable to Jackson and Goss14 and Yekta et al.22 although Yekta et al.22 studied much older participants. Hussaindeen et al.21 reported higher AF school for children aged 7–17 years in India while Rouse et al.39 found 10.35cpm for American children aged 10–18 years. The AF measure is relevant to diagnose various accommodation anomalies including accommodative–infacility, insufficiency and excess.58 Invariably, reduced amplitude of accommodation has traditionally been used as the main clinical sign used to diagnose accommodative insufficiency (AI). However, Cacho et al.72 found that failing the −2.00D lens component of the monocular accommodative facility test was the clinical sign most associated with AI. In general, studies in the 1940s6–11 did not include AF testing in their report.
During near vision, the eyes are not usually precisely focussed on the object of regard, but the accommodation lags slightly behind the target.58,73,74 A high lag of accommodation can result in blurred print and asthenopia during reading58,73,74 and an excessive lag of accommodation may indicate latent hyperopia, esophoria, or may be associated with AI, or accommodative spasm.58,73,74 The findings on AR appear to be the most consistent accommodative measures across studies, which may be due to the test being an objective technique. In Haines study,7 the author suggested that the lower limit of the range reported should be applied for younger healthy individuals who usually would have high AA while the upper limit will be appropriate for presbyopes, persons with lowered AA or in cases of over-correction of hyperopia. The relative accommodation tests are indirect measures of the vergence system; NRA measures PFV while PRA measures NFV.58 The relative accommodation tests are influenced by the dynamics of refraction. The NRA values higher than +2.25DS suggest under-correction of plus or overcorrection of minus in distance refraction while lower than that would indicate hyper-tonicity, over-correction of plus, or under-correction of minus at distance.7,44 The PRA values higher than −2.75DS are normal for young healthy persons with high AA and in cases of CI where most of the monocular AA is available.7,44
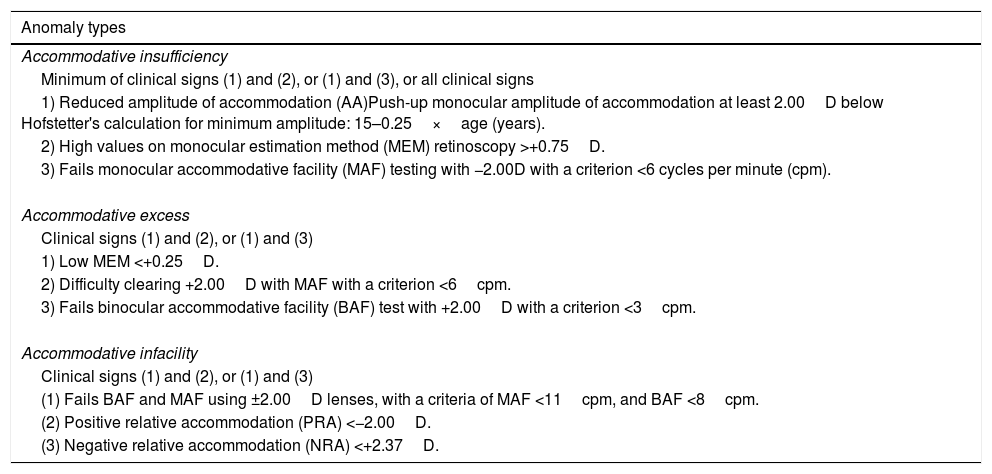
Although accommodative anomalies have often been defined using single or a combination of clinical signs.74 I am not aware of any validated syndrome classification system for accommodative anomalies as was done for CI. However, it is known that the available norms for the single or multiple criteria.74 were derived from various studies and the use of correlated variables such as in Table 8 dates back to the classic studies.6–11 Furthermore, the use of the multiple-signs criteria (Table 9) was traced back to the study by Hokoda75 in 1985 who cited other sources which could not be found. For example, with the single clinical signs criteria, AI may simply defined as reduced AA whereas with the multiple criteria, AI is defined as reduced AA in addition to other clinical signs.74 The same approach applies to other accommodative anomalies when defined using a combination of clinical signs (Table 10).58,74
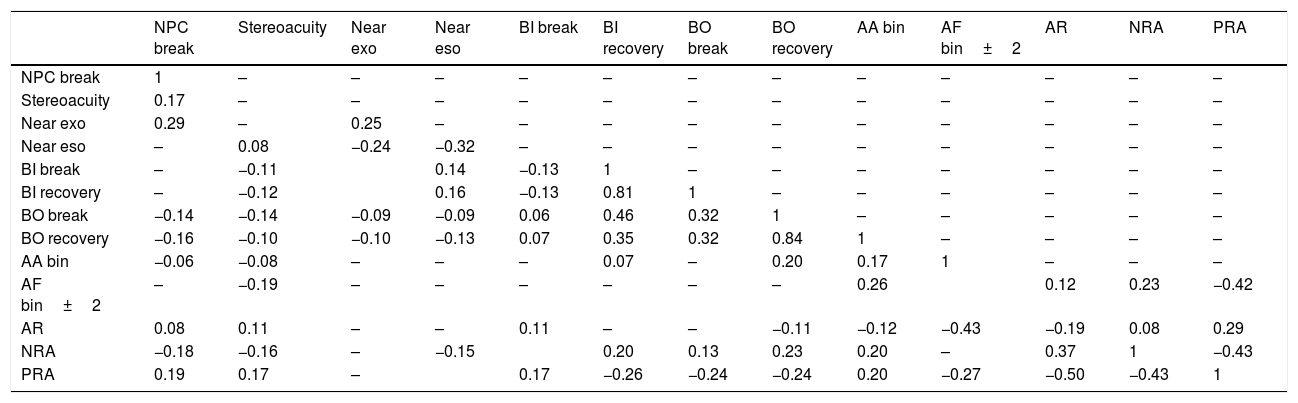
Correlation of accommodative and vergence measures using the Spearman's rank correlations test. Only variables with significant correlations [(r) at p<0.05] are shown on the table and most correlations are weak.
| NPC break | Stereoacuity | Near exo | Near eso | BI break | BI recovery | BO break | BO recovery | AA bin | AF bin±2 | AR | NRA | PRA | |
|---|---|---|---|---|---|---|---|---|---|---|---|---|---|
| NPC break | 1 | – | – | – | – | – | – | – | – | – | – | – | – |
| Stereoacuity | 0.17 | – | – | – | – | – | – | – | – | – | – | – | – |
| Near exo | 0.29 | – | 0.25 | – | – | – | – | – | – | – | – | – | – |
| Near eso | – | 0.08 | −0.24 | −0.32 | – | – | – | – | – | – | – | – | – |
| BI break | – | −0.11 | 0.14 | −0.13 | 1 | – | – | – | – | – | – | – | |
| BI recovery | – | −0.12 | 0.16 | −0.13 | 0.81 | 1 | – | – | – | – | – | – | |
| BO break | −0.14 | −0.14 | −0.09 | −0.09 | 0.06 | 0.46 | 0.32 | 1 | – | – | – | – | – |
| BO recovery | −0.16 | −0.10 | −0.10 | −0.13 | 0.07 | 0.35 | 0.32 | 0.84 | 1 | – | – | – | – |
| AA bin | −0.06 | −0.08 | – | – | – | 0.07 | – | 0.20 | 0.17 | 1 | – | – | – |
| AF bin±2 | – | −0.19 | – | – | – | – | – | – | 0.26 | 0.12 | 0.23 | −0.42 | |
| AR | 0.08 | 0.11 | – | – | 0.11 | – | – | −0.11 | −0.12 | −0.43 | −0.19 | 0.08 | 0.29 |
| NRA | −0.18 | −0.16 | – | −0.15 | 0.20 | 0.13 | 0.23 | 0.20 | – | 0.37 | 1 | −0.43 | |
| PRA | 0.19 | 0.17 | – | 0.17 | −0.26 | −0.24 | −0.24 | 0.20 | −0.27 | −0.50 | −0.43 | 1 |
Exo=exophoria.eso=esophoria, BI=base in, BO=base out. AA bin=binocular amplitude of accommodation. AR=accommodative response. AF bin=binocular accommodative facility. NRA=negative relative vergence, PRA=positive relative vergence.
Convergence Insufficiency and Reading Study (CIRS) group's criteria for convergence insufficiency.
| Anomaly types and clinical signs |
|---|
| Convergence insufficiency clinical signs |
| (1) Exophoria at near. |
| (2) Exophoria at near ≥4 prism diopter (pd) greater than far. |
| (3) Insufficient fusional vergence defined as either (i) fails Sheard's criterion or (ii) poor PFV at near ≤12pd Base out (BO) to blur or ≤15pd BO break. Poor BO break was used for insufficient PFV criteria. |
| (4) Receded NPC ≥7.5cm break or ≥10.5cm recovery. |
| Diagnostic system: according to severity |
| i. Low suspect CI (exophoria at near ≥4pd than at far and clinical sign one. |
| ii. High suspect CI (exophoria at near, and 2 signs or clinical sign 1 and 2 plus 3 or 4. |
| iii. Definite CI (all clinical signs must be present). |
Classification criteria for accommodative anomalies.
| Anomaly types |
|---|
| Accommodative insufficiency |
| Minimum of clinical signs (1) and (2), or (1) and (3), or all clinical signs |
| 1) Reduced amplitude of accommodation (AA)Push-up monocular amplitude of accommodation at least 2.00D below Hofstetter's calculation for minimum amplitude: 15–0.25×age (years). |
| 2) High values on monocular estimation method (MEM) retinoscopy >+0.75D. |
| 3) Fails monocular accommodative facility (MAF) testing with −2.00D with a criterion <6 cycles per minute (cpm). |
| Accommodative excess |
| Clinical signs (1) and (2), or (1) and (3) |
| 1) Low MEM <+0.25D. |
| 2) Difficulty clearing +2.00D with MAF with a criterion <6cpm. |
| 3) Fails binocular accommodative facility (BAF) test with +2.00D with a criterion <3cpm. |
| Accommodative infacility |
| Clinical signs (1) and (2), or (1) and (3) |
| (1) Fails BAF and MAF using ±2.00D lenses, with a criteria of MAF <11cpm, and BAF <8cpm. |
| (2) Positive relative accommodation (PRA) <−2.00D. |
| (3) Negative relative accommodation (NRA) <+2.37D. |
The accommodative-vergence system is very complex and single signs are often inadequate to define them, or make differential diagnosis, therefore a syndrome method of classification which involves correlated clinical signs is appropriate. For accommodative measures, the ranges from the present study agrees with the findings in Table 5 and are comparable to Haines,6,7 Morgan10 and the Scheiman and Wick58 as well as the mean values reported by the OEP.(in Scheiman and Wick)58 as shown in Tables 4–5.
StereoacuityStereoacuity scores in the present study were not normally distributed and mean score is comparable to findings from some previous studies but differ with others (Table 2). Studies have reported significant associations between stereoacuity and vision anomalies,52,55 which suggests that stereo-tests could be useful tools to screen for vision anomalies. An objective of the main study necessitated measuring stereoacuity without refractive corrections. However, the distribution of refractive error is low in this sample as the mean spherical equivalent refraction was −0.05±0.51 therefore, may not have impacted greatly on the stereoacuity results. Besides, anisometropia is the refractive error that is consistently found to affect stereoacuity threshold due to more retinal disparities, associated aniseikonia, and foveal suppression in the defocused eye.49 Establishing norms for stereoacuity could improve its relevance and applications in screening for accommodative and vergence anomalies.
Implications, applications and limitations of study findingsThe major drawback with normative data is difficulty in determining to what extent data from a population mean could be applied to determine individual normative data.11,33 Regardless the limitations, the clinical norms are useful guidelines for clinical practice especially when interpreted with the range of normal and when anomalies are interpreted as syndrome where necessary. Establishing a range of normal for clinical measures basically suggest that measures below or above these values may be on the extreme of limits. In general, the normative data should be applied with caution in clinical decision making and be used with correlated variables, and mainly when the “extreme values” correspond with poor performance or with symptoms.6,10 Furthermore, the normative values and ranges suggested in this study should be interpreted in the context of instrument and techniques and limitations associated with using each technique. Age and Race (being Black) did not appear to distinguish any clinical measure as suggested norms from the present study are comparable for most clinical measures across populations.
The random sampling employed, using many schools, large sample size, and data from several high schools collected by only one examiner and a high response rate, suggests that the findings from this study may be considered representative and could be extrapolated to the entire population of Black school children in the municipality. The findings from this study add to the discourse and with cumulative research it is hoped that the inconsistencies in defining accommodative and vergence measures will be addressed.
RecommendationsMore studies on this topic, using different measurement techniques will be necessary. It is recommended that groups of experts be formed to establish a system for classifying accommodative anomalies- as was done for convergence insufficiency. The proposed classification system will address the concerns with standardizing testing protocols and classification criteria for accommodative anomalies.
ConclusionThis study provides data on ranges of normal on accommodative, vergence and stereoacuity measures for high school students which were not studied extensively. The findings reported will guide the clinicians and researchers to know the expected findings and should be interpreted in the context to the measurement techniques and limitations outlined.
Conflicts of interestThe author has no proprietary interests or conflicts of interest related to this submission.
This submission has not been published anywhere previously and it is not simultaneously being considered by any other publication.
I thank Drs, Rekha Hansraj and Percy Mashige (UKZN, South Africa) for reviewing drafts of the manuscript. I am grateful to Professors, David Goss (Indiana University, Optometry), Dominic Maino (Illinois College of Optometry) and Marc Taub (Southern College of Optometry, Tennessee) for their continued support in various ways.


