

To compare different methods for the assessment of disability glare sensitivity in the elderly, to arrive at an objective assessment of the condition of the eye. To delineate the importance of straylight values in vision.
MethodsThree groups of subjects were studied: 1) Young subjects without any eye disease, 2) elderly subjects without any eye disease and 3) elderly subjects with (early) cataract in at least one eye. All subjects underwent 2 glare tests, 2 straylight tests, ETDRS visual acuity test, Pelli Robson contrast sensitivity test, refraction, LOCS III cataract classification. Straylight was quantified by means of the straylight parameter s.
ResultsRepeatability, discriminative ability, and added value as compared to visual acuity were low for the glare tests and good for the straylight measurements. For young normal subjects, with log(s)=0.9, the standard glare situation with low beams gives a contrast reduction of 1.3, whereas for the healthy 77 year olds this increases to 2. With cataract hardly affecting visual acuity, log(s) can be as high as 1.8, resulting in a contrast reduction of 3.4.
ConclusionStraylight measurement is of relevance for the assessment of the glare-related hindrance during driving, and can be used to objectify complaints and aid in the decision-making regarding cataract surgery.
Comparar diferentes métodos para medir la sensibilidad al deslumbramiento perturbador en sujetos de edades avanzadas, con el fin además de lograr una valoración objetiva de las afecciones oculares. Definir la importancia que tiene la luz dispersa (parásita) sobre la visión.
MétodosSe estudiaron tres grupos de sujetos: 1) Sujetos jóvenes sin ningún tipo de afección ocular, 2) sujetos de edad avanzada sin ningún tipo de afección ocular y 3) sujetos de edad avanzada con cataratas (incipientes) en, al menos, uno de los ojos. A todos los sujetos se les realizaron, entre otras, 2 pruebas de deslumbramiento y 2 pruebas de luz dispersa, se les midió la agudeza visual mediante optotipos ETDRS (siglas en inglés del Estudio sobre el tratamiento temprano de la retinopatía diabética), la sensibilidad al contraste con el test de Pelli-Robson, la refracción, y se clasificó la catarata (para sujetos del tercer grupo) utilizando el Sistema de Clasificación de Opacidades del Cristalino(o sus siglas en inglés, LOCS III). La luz dispersa (parásita) se cuantificó por medio del parámetro de luz dispersa s.
ResultadosLa repetibilidad, la capacidad discriminativa, y el valor añadido, resultaron ser bajos para los tests de deslumbramiento pero buenos para las medidas de la luz dispersa (en comparación con los valores que proporciona la medida de la agudeza visual). Para los sujetos jóvenes sin patologías oculares, con log(s)=0,9, la situación habitual de deslumbramiento con haces bajos causa una reducción del contraste del 1,3, mientras que para los sujetos de alrededor de 77 años, este valor aumenta hasta 2. Mientras que las cataratas apenas afectan a la agudeza visual, log(s) puede aumentar incluso hasta 1,8, lo que causa una disminución del contraste de 3,4.
ConclusionesLa medida de la luz dispersa tiene gran relevancia a la hora de evaluar la molestia que causa el deslumbramiento durante la conducción, y se puede utilizar para objetivar las quejas y para facilitar la toma de decisiones relativas a la cirugía de cataratas.
Glare is considered to be an important hazard for safe driving. Most glare hindrance is due to the optical effect of light scattering, resulting in straylight on the retina. Important sources are windshields and glasses,1 but the present report focuses on light scattering in the eye of the driver itself. Glare hindrance can be subdivided into discomfort and disability glare. Discomfort glare is the general name for the discomfort sensation caused by bright light sources, while disability glare is more specifically associated with reduced vision because of straylight (scattered light) originating from a bright source. We will concentrate on disability glare. The respective visual disability is known to be the effect of retinal contrast reduction due to the veil of retinal straylight. In this context, it has become a CIE standard to evaluate disability glare by means of the assessment of straylight.2 Retinal straylight can be assessed with the so-called straylight meter. The straylight meter is an instrument that relies on a dedicated psychophysical technique for straylight assessment, originally based on the direct-compensation method,3-5 now based on the compensation comparison method,6 and marketed under the name C-Quant instrument (by Oculus GmbH, Wetzlar Germany). Other methods have been devised to assess disability glare by means of the so-called glare testers. In these instruments the effect of a glare source (a bright source in the near periphery of the subject's field of view) on a given visual function (e.g., the visibility of an optotype) is taken to represent the subject's “glare sensitivity”. Over the years, many glare testers have been developed. Most of these measure either visual acuity or contrast sensitivity in the presence of a glare source. None of these tests evolved to a widely accepted standard,7-9 which favoured the straylight meter being coined as the gold standard.10
Currently, glare is a parameter for visual function that is not evaluated prior to obtaining a driver's license. This is often felt to be an important shortcoming, since it may be related to well-known difficulties often encountered during driving.11,12 Examples include the blinding effect of a low sun or the headlights of oncoming cars, especially at low ambient light levels. The effects are enhanced in those scenarios where the driver is meant to see low-contrast objects, such as unilluminated obstacles or pedestrians.13 Since glare is condition-dependent (it only happens when a blinding source is present) people may be relatively unaware of the potential dangers. Some authors14-16 suggested that there is a strong relationship between glare tests and road traffic accidents. On the other hand, a previous study only revealed a weak relationship between glare tests and (self) perceived driving disability.17 This suggested that there is a discrepancy between perceived and true disability; that is, that people may not be aware of their impairment. This fact adds to the importance of glare testing for driver license applications. However, the implementation of glare testing is only possible when an adequate measurement technique is available.
An additional aspect of adding a (glare) test to judge whether or not the candidate is fit to drive, is that this new test should provide information regarding visual function that is not already yielded by other tests such as visual acuity. Advanced cataracts lead to a decrease in visual acuity and contrast sensitivity. However, early cataracts leave visual acuity and contrast sensitivity unaffected.18-21 In such a situation, glare testing may be of particular value. At a population level, measures of visual acuity are highly correlated with contrast sensitivity and glare sensitivity. However, at an individual level, such correlations seem to fail.22
Glare is most often related to the condition of the eye's lens. Indeed, the first vision-related complaints in the elderly population are often related to driving at night and againstthe- light viewing conditions. With the increase of both life expectancy and mobility in higher age groups, the effects of cataracts upon driving may increase rapidly in the years to come.23,24 As an indication for cataract surgery, straylight should be taken into consideration if that aspect of visual function is of importance for the patient. A relatively new source of increased glare sensitivity is refractive surgery. It has been shown that, even after uneventful refractive surgery, glare sensitivity is increased,25-30 although this has also been disputed.31 However, due to the improvement of the surgical techniques, more recent reports seem to indicate a lower incidence of increased straylight levels in refractive surgery.32,33
In the present paper, methodological aspects of straylight/glare assessment for the aging population are discussed. First, the performance of assessment technology will be presented, based on a multicenter study comparing 3 subject groups: young, aged, and cataractous. Part of this study was reported before.34 Second, this paper will discuss how the intimate relationship between glare and straylight can be understood and derived in practice. To translate straylight values into practical glare effects, calculations were made based on data in the literature regarding typical night driving situations, including the typical state of adaptation of the eye and values for the brightness of head lamps.
MethodsThe glare tests used were the Nyktotest (Rodenstock GmbH, Ottobrun, Germany), and the Mesotest (Oculus GmbH, Wetzlar, Germany). They actually test contrast sensitivity, but are designed to simulate driving conditions at night, by having the subjects dark-adapt first for 10 minutes and then measuring the contrast sensitivity at low luminance, both with and without a bright glare source. The Mesotest II35 tests, at a surround luminance of 0.032 cd/m2, the visibility of optotypes at 4 different levels of contrast: (Lsur-Lopt)/Lsur = 0.96, 0.80, 0.63 and 0.50, respectively. The very comparable Nyktotest 30036 tests at 0.1 cd/m2 and has 8 levels of contrast (0.96, 0.80, 0.63, 0.50, 0.40, 0.32, 0.20, 0.12). When glare is added, in both instruments the same contrast values are tested, but at a luminance that is 0.5 log units higher.
The straylight meter measures the amount of straylight on the retina, defined by means of the equivalent-luminance concept.2,37 In short, a ring-shaped straylight source (glare source) is flashed on and off at a frequency of about 8 Hz (i.e., at the peak of our flicker-detection sensitivity). The subject fixates at the centre; i.e., the fovea receives the central test field. In the ‘on’-phase, light will reach the fovea because light from the straylight source will be scattered in the eye and diverted to the fovea. In the ‘off ‘-phase, there is no light to be scattered, so the fovea will only receive light that is truly coming from the central test field. If the centre of the image is black in both phases, the subject will perceive a flickering signal on the fovea due to the scattering of light from the flickering annulus. However, if some (compensation) light is added to the central test field in the ‘off ‘-phase, the flicker will weaken. Flicker will cease to exist if the amount of compensation light equals the amount of straylight, thus enabling a precise quantitative measure of the retinal straylight. The elegance of this method lies in the fact that the retina is used as a null instrument and that the condition of the retina or the imaging ocular optics is relatively unimportant as far as the precision of the measurement is concerned. As long as the retina can detect the 8 Hz flicker, adequate measurements can be performed. In the rare occasion that the 8 Hz flicker sensitivity is depressed, the accuracy of the measurement method will suffer, but no systematic error will be introduced. An important difference between the straylight meter and other glare testers is that the straylight meter measures directly the relevant physical magnitude affecting the eye (retinal straylight). Other glare testers determine a (contrast) sensitivity value, which may also depend on other ocular factors, such as the state of dark adaptation, or the presence of a retinal pathology. Straylight meter 1 was LED-based. A CRT (Cathode Ray Tube)-based straylight meter was then developed, enabling a better control over the areas surrounding the principle stimuli, as explained above. Straylight is quantified by means of the straylight parameter s, usually given in logarithmic units: log(s).
A cross-sectional sample comprised of 112 subjects was drawn from the patients and visitors of the outpatient departments of the participating clinics: the Department of Ophthalmology at the Free University Medical Centre in Amsterdam (The Netherlands), the University Eye Hospital at the University of Tübingen (Germany), and the University Eye Clinic at the Paracelsus Medical Private University in Salzburg (Austria). The subjects belonged to either one of the following groups: (1) Subjects between 20 and 40 years of age, no cataract or other ocular disease, having best-corrected visual acuity equal to or better than logMAR 0.1 in both individual eyes (n=40). These subjects formed the young group without ocular disease. (2) Subjects being 50 years of age and over, with visual acuity in both individual eyes equal to or better than logMAR 0.1, no or only minimal cataract on slitlamp, no other ocular disease (n=37). These subjects formed the elderly group without ocular disease. (3) Subjects with binocular visual acuity equal to or better than logMAR 0.2, clinically relevant cataract in at least one eye, no other eye disease (n=35). These subjects formed the group with cataract. None of the subjects suffered from any eye disease, apart from refractive errors and, for those subjects in group 3, cataract. Refractive errors were limited to a maximum of 6 diopters of myopia, 5 diopters of hyperopia and 1.5 diopters of astigmatism. All subjects underwent the above-mentioned glare and straylight tests, as well as visual acuity, contrast sensitivity, refraction and eye colour measurements and objective assessment of cataract (LOCS III classification). Subjects completed a questionnaire regarding their perceived disability during driving. For about half of the subjects in each group, the measurements of glare and straylight were repeated on a different day, to enable the calculation of the repeatability of the measurement. An overview of this study was reported before.34 The present report focuses on the comparison between the glare and straylight tests.
For the calculation of Relative Risk values and discriminative abilities, definitions of “impaired” are needed. As regards the glare tests, we used the threshold values established in the literature; for the other tests, the threshold values were chosen by the authors. In this context, visual acuity was considered to be “impaired” when it was higher than 0.3 logMAR units. This corresponds to a decimal Snellen acuity level of 0.5 or 20/40. Straylight was considered to be impaired when the value of log(s) was higher than 1.4 (a 3-fold increase compared to the young eye), a threshold which is based on reports of subjects on self-experienced danger. Contrast sensitivity was considered to be impaired when the log(contrast sensitivity) was less than 1.25.38 For the Nyktotest and Nyktotest with glare, the “impaired” level was reached when more than 40% contrast was needed (corresponding to level 536), and for the Mesotest and Mesotest with glare, it was reached when more than 80% contrast was needed, corresponding to level 2 (recommendations for Class-1 drivers).12 Hence, level 5 and level 2 would be the minimum requirements for the Nyktotest and Mesotest, respectively (notably, for Class-2 drivers, it is a level 3, corresponding to 63% contrast needed). Definitions of “impaired” are also referred to as cut-off values.
Repeatability should be considered in relation to the biological differences that are considered to be significant. Therefore, in the analysis that follows, the repeatability of each test will be evaluated in view of the range of measurement values that are being obtained with that particular test. The range is the difference between the maximum and the minimum values that are gathered from the subpopulation (sample) under study. In addition, if individuals with normal scores in the test are well away from the cut-off value, then a low repeatability will be sufficient. If normal scores are close to the cut-off value, then the repeatability has to be higher, in order to avoid normal subjects to be classified as impaired due to the measurement variability. Therefore, repeatability will also be considered in relation to the cut-off value of each particular test.
To evaluate the effect of straylight in night-driving situations, the following basic considerations were made. The process of vision starts with the light being detected by the retina, its sensitivity being set by the state of adaptation. Under static conditions, the state of adaptation is fully determined by the amount of background light the retina receives. In fact, the state of adaptation can then be just defined as the amount of background light the retina receives. Other states of adaptation, such as those under dynamic conditions, could be expressed in those terms, which may be called “equivalent” based on some measure of retinal condition. The retinal visibility threshold is approximately proportional to the background intensity (Weber's law). The background intensity value, in our natural surroundings, can vary a lot, spanning many orders of magnitude. The ratio between the visibility threshold and background is called the Weber fraction. To give an example of a typical night-driving situation: Suppose that the state of adaptation corresponds to 1 cd/m2 and the Weber fraction is 0.10 (10%). Assume further that we need to discern a pedestrian with a clothing luminance of 0.3 cd/m2. That pedestrian would easily be detected. However, if the state of adaptation increases 10-fold because of the headlights of an oncoming car, that same luminance would be invisible. In this sense, the effect of transitory blinding discussed here is known to be caused by the desensitization of the retina due to the scattered light falling on it. This retinal straylight induces sensitivity loss and blinding, depending on the relationship between visual task and glare source. With respect to the visual task, not only the luminance of the task is especially important, but also its contrast, spatial characteristics and location in the visual field. This desensitization is more or less proportional to the amount of background light. Because of that, it is the ratio between scattered light and task luminance that is the magnitude of relevance. So we need to review the luminance of the tasks encountered during night driving and the equivalent background luminance emitted by the lamps of oncoming traffic. The equivalent luminance added by retinal straylight to a scene, can then be calculated by means of equation 1, which takes the straylight parameter s into account, as shown below:
where θis the angle (in degrees) of the glare source with respect to the line of sight, and Ebl is the illuminance on the eye from the glare source (in lux). During an encounter with an oncoming car having its headlights on, neither the term Ebl nor θ2 is constant. When the oncoming car approaches, θincreases at a rate inversely proportional to the distance between the two cars. At the same time, Ebl increases at a rate inversely proportional to the square of this distance. The combined effect is that Ebl/θ2 remains more or less constant, until the car is so close that its beam no longer reaches the eyes of the driver under consideration. The practical presentation time of such a glare source is of the order of seconds, with a corresponding luminance value that remains constant during much of this period. If we chose a duration of 1 second, that would correspond to 28 meters at 100 km/h.Results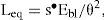
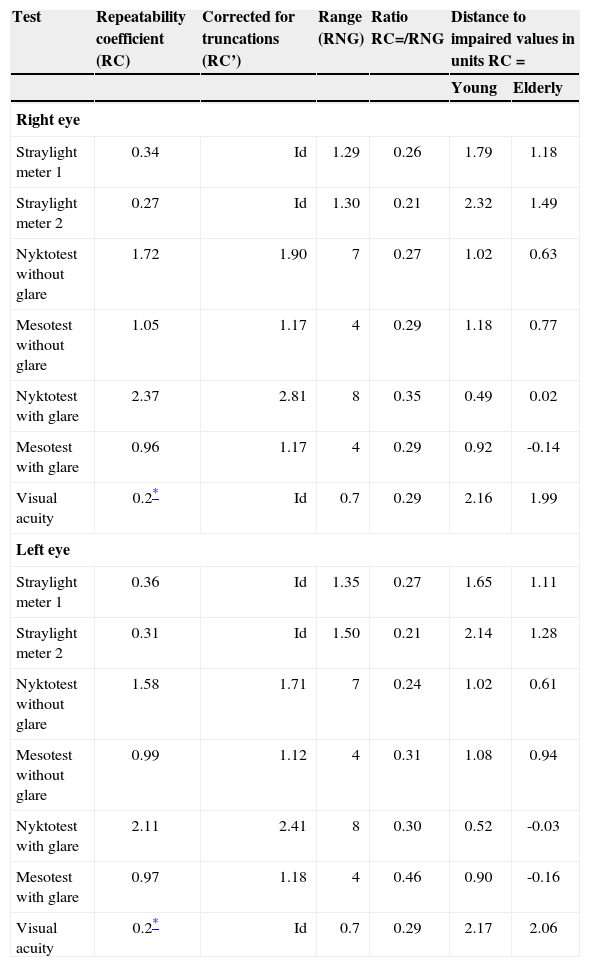
Table 1 shows the Repeatability Coefficients (RC)39 that were calculated from these results, both isolated and in relation to the range of measurement results. In the case of the Mesotest and the Nyktotest, strong flooring and ceiling effects occur, artificially increasing RC. Thus, RC’ was obtained after removing the maximum and minimum scores. For the Mesotest and the Nyktotest the results are in good agreement with the literature (Nyktometer/Mesotest40 and Nyktotest36). The ratio between the Repeatability Coefficient and the Range of data (RNG) hardly varies across the various tests. The distance to impaired scores, expressed in units RC is a measure of the probability that an average normal subject will produce an impaired score, based on measurement variability (false positive score). For young subjects, this distance is largest for straylight meter 2 and visual acuity. Both values are higher than 2, indicating that there is a small chance of getting “impaired” results due only to measurement variability. For elderly subjects, this value is largest for visual acuity. Note that many values, particularly for the Nyktotest and Mesotest, are very low.
Repeatability coefficients (RC) and related parameters of straylight (in log units), Nyktotest and Mesotest (in levels) and visual acuity (inlog units); n=49-55. Negative values in the last column indicate that the average score of the group is worse than the cut-off value
| Test | Repeatability coefficient (RC) | Corrected for truncations (RC’) | Range (RNG) | Ratio RC=/RNG | Distance to impaired values in units RC = | |
| Young | Elderly | |||||
| Right eye | ||||||
| Straylight meter 1 | 0.34 | Id | 1.29 | 0.26 | 1.79 | 1.18 |
| Straylight meter 2 | 0.27 | Id | 1.30 | 0.21 | 2.32 | 1.49 |
| Nyktotest without glare | 1.72 | 1.90 | 7 | 0.27 | 1.02 | 0.63 |
| Mesotest without glare | 1.05 | 1.17 | 4 | 0.29 | 1.18 | 0.77 |
| Nyktotest with glare | 2.37 | 2.81 | 8 | 0.35 | 0.49 | 0.02 |
| Mesotest with glare | 0.96 | 1.17 | 4 | 0.29 | 0.92 | -0.14 |
| Visual acuity | 0.2* | Id | 0.7 | 0.29 | 2.16 | 1.99 |
| Left eye | ||||||
| Straylight meter 1 | 0.36 | Id | 1.35 | 0.27 | 1.65 | 1.11 |
| Straylight meter 2 | 0.31 | Id | 1.50 | 0.21 | 2.14 | 1.28 |
| Nyktotest without glare | 1.58 | 1.71 | 7 | 0.24 | 1.02 | 0.61 |
| Mesotest without glare | 0.99 | 1.12 | 4 | 0.31 | 1.08 | 0.94 |
| Nyktotest with glare | 2.11 | 2.41 | 8 | 0.30 | 0.52 | -0.03 |
| Mesotest with glare | 0.97 | 1.18 | 4 | 0.46 | 0.90 | -0.16 |
| Visual acuity | 0.2* | Id | 0.7 | 0.29 | 2.17 | 2.06 |
The fact that the Mesotest and Nyktotest actually determine contrast sensitivity might have confounded this result. However, their design makes it possible to assess glare sensitivity as a separate magnitude, because contrast sensitivity is measured both with and without glare. The difference between the two results should provide an estimate, in an isolated fashion, of glare sensitivity (apart from a constant factor due to the difference in luminance levels). Moreover, since this procedure would involve paired comparisons, maybe (much) better accuracy could be obtained. The difference in log(contrast sensitivity) between the two scenarios (with and without glare) was (average ± standard deviation) 0.00±0.20, 0.08±0.15, and 0.19±0.16 for the young, elderly and cataract group respectively, to be compared to 0.89±0.15, 1.07±0.14, and 1.42±0.26, respectively, for the log(straylight) parameter for the same groups as above.
Translation of Straylight into Practical Glare EffectsDuring night driving, the adaptation condition of our eyes, as a general rule, is dominated by the road area directly in front of us, illuminated by the lamps of our own car. Recommended values for road light levels range from 0.5 to 2 cd/m2, and actual values found under dry conditions do indeed fall around 1 cd/m2.41,42 In the United States of America, levels between 0.3 and 1.2 cd/m2 are recommended. 43-45 However, actual roadway luminance values ranged from 0.74 to 0.013 cd/m2.46 These values represent road averages. Recommended maximum limits to local variation (Lmax/Lmin) are of the order of 5-10.41-45 The recommended values for the road luminance to be obtained from the head lamps of the driver's own car are around the same value of 1 cd/m2.46 However, the actual values can be as low as 0.1 cd/m2 under wet conditions,41 and if the more general surrounding is considered, background luminance can be even lower. After prolonged staring in the dark, e.g. to discern a weak distant object to the side of the road, retinal adaptation may decrease, and sensitivity may improve. However, such a situation will not be explored in the present paper; in this paper, a level of 1 or maybe 0.5 cd/m2 will be considered to be the typical static adaptation level during night-time driving.
The most demanding visual tasks in the present context are the timely detection of objects such as crossing pedestrians, or to resolve traffic signs. The most problematic objects are those that are only illuminated by background light and, maybe, a little bit by the low beam lamps of the driver's car.47,48 Relevant object luminance as low as 0.01 cd/m2 can be found during night-time driving.41,42 However, at illuminated roads, the situation may be much better,49 with the recommended illuminance levels of 6-20 lux, and actual values lying in the 3-13 lux range,49 which leads to object luminance similar to that of the road itself; i.e., 0.5 cd/m2.50 As corresponds to general awareness, these night driving tasks are already challenging under normal non-glare conditions, when our retinas are adapted to a level of around 0.5–1 cd/m2. The question now is, how much can this adaptation level be raised by glare sources, in particular from oncoming cars? This is considered for static circumstances, but the dynamic way in which true-life glare presents itself may magnify its effect considerably.51,52
Low-beam intensities are recommended to be less than 500 cd in the glare direction of approximately 3.4 degrees at a distance of 50 m. Actual values produce a median of 850 cd.53 This value corresponds to 0.34 lux on the driver's eye. By applying Equation 1, we obtain Leq=0.029s. With values of log(s) ranging from 0.8 to 1.8 and higher among the European driver population,54 this yields Leq = 0.19 to 1.9 cd/m2. That is, eyes with straylight values that fall in the lower part of the interval do not suffer a large effect on their state of adaptation. On the contrary, for those individuals with higher values of log(s), retinal desensitization becomes an important issue. At log(s) = 1.4, Leq = 0.7 cd/m2, and the retina is desensitized by a factor of about 2. We also need to consider abnormally elevated beam intensities. Indeed, in another study using values of 4 degrees for the glare-source distance, 1 cd/m2 pre-adaptation, and between 0.87 and 5.28 lux for Lbl, it was found that the visibility thresholds for a pedestrian silhouette strongly correlated with Lbl for normal subjects in a laboratory situation.55
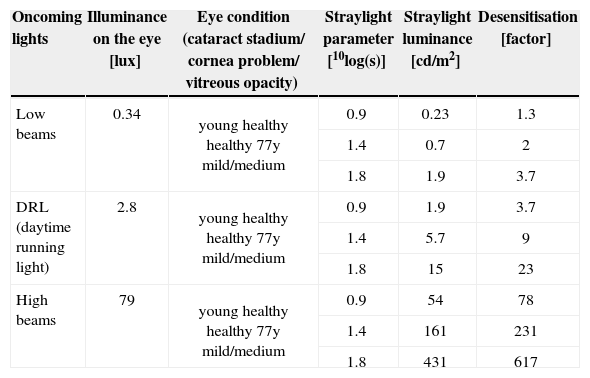
Table 2 gives an overview of numerical estimates for several conditions, based on the “typical” glare situation most often considered in literature, which is the two-lane rural road, assumed to correspond to a glare source located at 3.4 degrees, and a retinal adaptation condition equivalent to 0.7 cd/m2. The last column gives the calculated “desensitization” factors. In conditions of normal static viewing, this can be compared to contrast loss. For day-time running lights (DRL) an estimate was made assuming a typical value of 7000 cd for those lamps,56 and for undimmed headlights, a value for Lbl = 79 lux was assumed.51
Results of the calculations relating straylight to contrast reduction in the two-lane road night-driving situation, for 3 different eye conditions and for 3 different headlight conditions: normal dimmed headlights, proposed daytime running lights and normal high beams
| Oncoming lights | Illuminance on the eye [lux] | Eye condition (cataract stadium/ cornea problem/ vitreous opacity) | Straylight parameter [10log(s)] | Straylight luminance [cd/m2] | Desensitisation [factor] |
| Low beams | 0.34 | young healthy healthy 77y mild/medium | 0.9 | 0.23 | 1.3 |
| 1.4 | 0.7 | 2 | |||
| 1.8 | 1.9 | 3.7 | |||
| DRL (daytime running light) | 2.8 | young healthy healthy 77y mild/medium | 0.9 | 1.9 | 3.7 |
| 1.4 | 5.7 | 9 | |||
| 1.8 | 15 | 23 | |||
| High beams | 79 | young healthy healthy 77y mild/medium | 0.9 | 54 | 78 |
| 1.4 | 161 | 231 | |||
| 1.8 | 431 | 617 |
The results reported here on assessment methodology made it clear that glare testing of the classical kind suffers from significant inaccuracies. The repeatability coefficient revealed an unacceptable variation, compared to the size of the effects to be detected. The paired comparison between glare/no-glare contrast sensitivity did not resolve this, as it showed a large overlap between the different groups. In fact, the overlap between the subject groups was even larger than for the contrast sensitivity values alone. The straylight meters performed clearly better. The earlier paper34 reported on related issues. In short: regarding discriminative ability, i.e. the ability of each test to discriminate between the three groups (young/elderly/cataract) the straylight meters performed better with respect to false positives (elderly and young subjects who failed the tests): For 1 out of 154 tests, a subject (an elderly one) failed. Regarding the glare testers, 7/154 (all elderly) failed without glare, and 28/74 elderly and even 4/80 young subjects failed with glare. Furthermore, the tests’ added value was studied: i.e., whether or not the tests provide extra information about group assignment (young/elderly/cataract), surpassing the information provided by the visual acuity and contrast sensitivity tests. Again, the added value was found to be largest for the straylight meter. Conversely, visual acuity provided the least extra information in the presence of straylight meter results, even less than in presence of the results of the remaining glare tests, indicating that the straylight meter provided the best information about group assignment of the subjects.
From these results we may conclude that straylight testing is the best option. Why the glare testing concept fails is somewhat a matter of speculation. One might guess that the fact that it is sensitivities that are tested (contrast or visual acuity) confounds the results, because those can be influenced by multiple errors during the test, and are relatively inaccurate. Straylight measurement is based on establishing an identity, a task the human eye is very good at, and a task that cannot be easily influenced by errors. The next step is that a cut-off criterion of the test, in relation to driving performance, must be chosen. We used 1.4 as limit value for log(s) based on reports of subjects on self-experienced danger. The impact of a test on the driving population, as well as the cost-effectiveness of the test, is determined by the prevalence of “impaired” test outcomes among the driving population (apart from the relation with unsafe driving behaviour). This aspect was not investigated in the current study, but such knowledge must also be accumulated.
With respect to the translation of straylight to glare effects, table 2 shows that only for the best conditions (young eyes, low beams) does glare have a limited impact. For healthy older eyes, the problem is already significant with dimmed beams. One can imagine that this hindrance from lowbeam headlights is a serious nuisance and a danger, and that people suffering from it stop driving at night. It is remarkable to see how strong the effect of the proposed DRLs can be. It is quite clear that those lamps give very high values of desensitization when they are not timely switched off at night. In the corresponding study on DRLs, desensitization values were found to range from a factor of 5 for young individuals to a factor of 11 for 75–year olds without cataract formation.56 With undimmed headlights desensitization is very strong. Moreover, it may take several seconds to recuperate from such blinding.51 At 100 km/hour the distance travelled in one second is 28 meters, which highlights the danger such blinding entails.
A few remarks on the desensitization model used above to quantify the blinding effects of oncoming cars. First, desensitization was set to be equal to the factor by which the retinal adapting luminance is increased. Think of the normal situation in our visual world. During the day, overall luminance changes by a factor of 1000. Yet our visual world appears constant. In other words; e.g., a pedestrian may differ in brightness by that same factor of 1000, yet his/her visibility during the day remains unchanged. The explanation is that the retina desensitizes in the same proportion, so that the retina signals the pedestrian with the same strength, according to the above mentioned Weber law. However, this law does not always hold precisely true. Actual desensitization values may be a bit lower than the 1000 factor mentioned above. The difference varies, depending on the particular visual task. Tasks may be as different as detecting a pedestrian against a cluttered background, a color-discrimination task with, for example, a colored traffic sign, or a resolution task that involves reading text on direction signs. However, the sensitivity for each of the possible visual tasks is controlled by the adapting luminance. So, even if, quantitatively, the amount of desensitization is not precisely equal to the luminance increase, that same value is the controlling factor, and by approximation quantitatively the accurate factor. The unattractive alternative would be to specify desensitization for every single task one could encounter.
In conclusion, we believe that with the introduction of the straylight measurement on the basis of the compensation technique, glare sensitivity assessment for the aging population has become of age. Being a basic function of the eye, straylight is a solid means to quantify vision loss effects, such as the blinding that may occur during night driving. Straylight assessment can serve as an objective indication for cataract extraction, to alleviate the elderly person from this condition.
Financial disclosure: Financial support was obtained from the European Committee, grant number I-TREN E3 200/7/S12.282826. The Royal Academy holds a patent licensed to Oculus GmbH for the C-Quant straylight meter.


