


A novel type of acuity measurement, which we refer to as ‘differential acuity’, requires the observer to identify one unique target among three others which are identical. This is a proof of concept study aimed to determine if differential acuity is equivalent to standard measures of recognition acuity.
MethodsTo create a range of visual acuity, vision was optically blurred in sixteen adults with normal visual acuity. Visual acuity was then measured with the differential acuity targets in both crowded and uncrowded format, and compared with standard ETDRS acuity or with singly presented letters and uncrowded letters were analysed separately.
ResultsThe visual acuity results for crowded and uncrowded letters were analysed separately. Repeated measures analysis of variance showed that when a crowded Sloan C had to be differentiated from three crowded Os (CvsO), the results were not significantly different from ETDRS acuity or from naming one of four letters presented centrally (Name4) (p<0.05). Similar results were found for uncrowded letters – the C versus O and Name4 gave similar visual acuity. The 95% limits of agreement between the naming and C versus O differential acuity measures were between 0.17 and 0.27 logMAR.
ConclusionFrom this proof of concept study we conclude that differential acuity gives similar results to the ETDRS chart in adults. We infer that the comparable but cognitively simpler differential visual acuity task could be applied in clinical settings for young children or patients with developmental delay who cannot respond by naming or matching.
Un nuevo tipo de medición de la agudeza, al que denominaremos ‘agudeza diferencial, requiere que el observador identifique un único objetivo entre tres otros objetivos idénticos. Se trata de una prueba de estudio de concepto, que trata de determinar si la agudeza diferencial es equivalente a las mediciones estándar de agudeza de reconocimiento.
MétodosPara crear un rango de agudeza visual, se degradó ópticamente la visión en dieciséis adultos con agudeza visual normal. A continuación se midió la agudeza visual con los objetivos de agudeza diferencial, tanto en formato aglomerado como no aglomerado, y comparándose con la agudeza ETDRS estándar, o con letras presentadas de manera única, analizándose las letras no aglomeradas separadamente. Los análisis de mediciones repetidas de varianza reflejaron que cuando una C Sloan aglomerada debía diferenciarse de tres O aglomeradas (CvsO), los resultados no eran significativamente diferentes de la agudeza ETDRS, o de nombrar una de las cuatro letras presentadas centralmente (Nombrar4) (p<0,05). Se encontraron resultados similares para las letras no aglomeradas – C versus O – y Nombre4 arrojó una agudeza visual similar. Los límites de acuerdo del 95% de las mediciones de agudeza diferencial, entre nombrar y C versus O, se situaron entre 0,17 y 0,27 logMAR.
ConclusiónA partir de este estudio de prueba de concepto concluimos que la agudeza diferencial arroja resultados similares al cuadro ETDRS en adultos. Podemos inferir que podría aplicarse la tarea de agudeza visual diferencial, comparable pero cognitivamente más simple, al entorno clínico para jóvenes o pacientes con retraso del desarrollo cognitivo, y que no pueden responder mediante denominación o emparejamiento.
Visual acuity testing is an important component of a complete oculovisual assessment and is important in the detection of amblyopia, refractive error and ocular disease. Snellen letter acuity is the accepted method for patients able to name letters, and among letter tests the Early Treatment Diabetic Retinopathy Study (ETDRS) and Bailey–Lovie charts are recognised as gold standards.1,2 This type of visual acuity is known as recognition acuity as the patient is required to recognise and identify the symbols or optotypes presented.3,4 Letter naming charts have obvious limitations with particular populations, such as young children, or individuals with developmental delay. Before a child is able to name letters, various matching tests are used. Modern versions of these have been formatted with a logMAR scale similar to the ETDRS or Bailey–Lovie charts. The child is required to match (or name) the symbol or letter shown, on a matching card in their hand. It requires a level of cognitive maturity and children with normal development can typically comply with this task from about 2.5–3 years upwards.5,6 Another approach for young children is the use of Landolt C's and tumbling E's which require the observer to identify the orientation of a letter. While these eliminate the need for learned symbol identification, they still require the patient's subjective response and an understanding of directional orientation so that the observer can express to the examiner in some way the location of the letter's gap. So this too is not ideal for preschool age children, or adults with developmental delay.
The Cardiff Acuity Cards4,7 or the Teller Acuity Cards8 are used for children who are too young to comply with matching or naming. These both utilise a preferential looking format, and as such, can be used with children as young as approximately 1 year in the case of the Cardiff Acuity Cards, and with neonates in the case of Teller Acuity Cards. However, these tests measure resolution rather than recognition acuity.3,4 They require that the visual detail (gratings in the case of Teller Acuity Cards) be detected or optically resolved, but do not require recognition, that is they have to detect that there is something there, but not what is there. Resolution acuity is not directly comparable to the recognition acuity and is only moderately correlated.9 Resolution acuity tends to give better acuity values compared with recognition acuity,9–11 is less sensitive for detecting amblyopia,9,11 optical blur7,12 and other foveal causes of reduced visual acuity.10 Resolution acuity also may be less relevant to everyday tasks, which usually require recognition and not just detection. Visual evoked potential is an objective method for measuring visual acuity patients who cannot respond subjectively,13 but this also measures resolution acuity, and is not readily available in most clinical settings.
If the task of demonstrating recognition of a letter or symbol could be made simpler and less cognitively demanding, recognition acuity could be measured at a younger age. Earlier detection and accurate monitoring of amblyopia in young infants would be beneficial as amblyopia is a common cause of monocular vision loss and is best treated as early as possible.
In this proof of concept study, we aimed to examine whether or not a novel paradigm of acuity measurement, which we refer to as ‘differential acuity’, has the potential to be used as an alternative method to acquire visual acuity measurements in these patients. By differential acuity we mean the ability to detect the “odd one out” of a display of several other identical acuity symbols, and to respond by either naming the position of, pointing to or looking at the non-identical target. As such, an observer's response is still required, but the need for symbol identification is removed. This may be a cognitively easier task for a person to perform than naming, matching or indicating the orientation of an E or C. Early studies have suggested this type of approach using a two-alternative forced choice (AFC) discrimination task between O's and Landolt C's in young children.14–16 We have investigated the potential of detecting a C among three O's. A 4ACF task decreases the guessing rate compared to 2AFC and changes the task to one in which the child has to detect the odd-one-out. This is potentially cognitively simpler – infants as young as 12 months can be trained to detect a unique target among others,17,18 and without training all typically developing children as young as 2.5 years could point to a differently coloured spot amongst grey ones.19 This new paradigm for testing VA is novel and aims to reduce the cognitive demand for testing recognition acuity, compared to other tests of recognition VA for young children which require matching, naming or detecting one particular stimulus compared to one other. The targets used would be the same as those for recognition acuity, and since the observer must recognise differences between them, the visual acuity measured may be equivalent to recognition acuity.
The differential acuity approach may offer opportunity to assess recognition-type acuity with younger children, or individuals with developmental delay, for whom standard identification acuity measures are too challenging. Alternatively, it is possible that the task is both cognitively and visually easier, resulting in lack of equivalence.
For the purposes of clarity in this paper, recognition acuity assessed with naming or matching will be referred to as ‘identification acuity’, so as not to be confused with differential acuity. The research question is whether the cognitively simpler differential acuity task would give equivalent visual acuity compared with the standard identification acuity task. This cannot be studied in young children as there is no test of recognition acuity in children too young to match shapes or read letters against which the results can be validated. Therefore, we used a sample of adult observers without cognitive impairment or ocular disease to investigate how differential recognition acuity measurements compare to the clinical gold standard, an EDTRS letter chart.1 Our hypothesis is that there will be no clinically significant difference between; (1) visual acuity measured by the standard ETDRS chart, crowded ETDRS letters and the new differential crowded acuity; or (2) between uncrowded differential acuity and uncrowded ETDRS letters.
Material and methodsParticipantsThis study received clearance through a University of Waterloo Research Ethics Committee and adhered to the principles of the Declaration of Helsinki. All participants gave informed consent.
Sixteen individuals participated in this study (average age 27 years, range 19–49 years, 12 female). A sample size calculation for detecting a difference of 0.15logMAR between VA tests and using the median standard deviation of differences (0.12logMAR) from Rosser et al.,20 for alpha=0.05 and power=80% gave a sample size of 14. This sample size calculation is similar to that of Anstice et al.21 The inclusion criteria were as follows: corrected visual acuity 6/6 or better, physically capable of wearing a trial frame, no cognitive impairment, no hard contact lens wear, no ocular disease that could compromise visual acuity (for example cataracts, dry eye), and no eye movement disorders or use of medications which would affect eye movements. The inclusion criterion of normal visual acuity was used so that variability in the results was only due to optical blur, and not a combination of blur and disease, which would generate greater variability in the data, i.e. disease affects VA differently than optical blur.
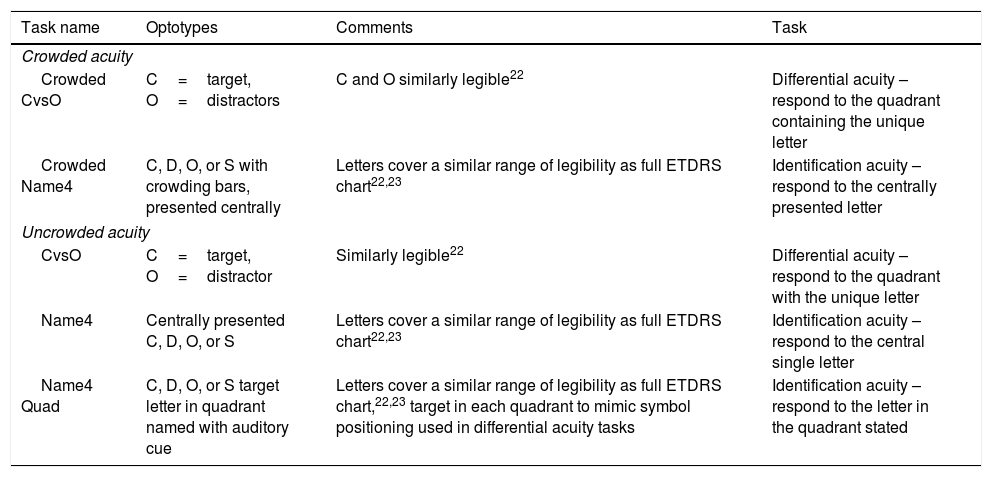
TargetsThe differential acuity task involved locating a computer-generated C amongst three Os (CvsO) either in a crowded or uncrowded format (Fig. 1). The main comparison for the crowded CvsO was VA measured on the ETDRS chart (see Procedure section). However since the guessing rate is different (10 letters versus 4 locations), a second comparison was included which was identifying one of 4 crowded Sloan ETDRS letters presented centrally (Crowded Name4 – Table 1). The Sloan letters used were the C, O, S and D, which are more similar to each other than the letters without curved components.22,23

Configuration of differential acuity targets. A and B show the spacing as the uncrowded letters decreased in size. C and D show the spacing as crowded letters decreased in size. *Separation remained constant at 2× largest uncrowded letter height/width. ** 1 letter height/width. ***0.5 letter height/width.
Crowded and uncrowded acuity targets.
| Task name | Optotypes | Comments | Task |
|---|---|---|---|
| Crowded acuity | |||
| Crowded CvsO | C=target, O=distractors | C and O similarly legible22 | Differential acuity – respond to the quadrant containing the unique letter |
| Crowded Name4 | C, D, O, or S with crowding bars, presented centrally | Letters cover a similar range of legibility as full ETDRS chart22,23 | Identification acuity – respond to the centrally presented letter |
| Uncrowded acuity | |||
| CvsO | C=target, O=distractor | Similarly legible22 | Differential acuity – respond to the quadrant with the unique letter |
| Name4 | Centrally presented C, D, O, or S | Letters cover a similar range of legibility as full ETDRS chart22,23 | Identification acuity – respond to the central single letter |
| Name4 Quad | C, D, O, or S target letter in quadrant named with auditory cue | Letters cover a similar range of legibility as full ETDRS chart,22,23 target in each quadrant to mimic symbol positioning used in differential acuity tasks | Identification acuity – respond to the letter in the quadrant stated |
The uncrowded CvsO was compared with the same 4 Sloan letters presented uncrowded and centrally (Name4). To consider the possibility that eye movements towards a quadrant would influence visual acuity in the differential acuity task, a second comparison was included. In this task (Name4Quad), the uncrowded ETDRS letters were presented in one of the four quadrants where the C or Os were be presented, and the participant's task was to identify the letter in a named quadrant.
Computer-generated letter targets: The letter design was based on the Sloan letters which are used in the ETDRS chart and have equal height and width. There were 12 target sizes, which were scaled in 0.1logMAR steps (0.1logMAR is equivalent to one line on an ETDRS or similar logMAR chart). For the crowded letters, the width of the crowding bars was equal to the letter stroke width (width of the lines making up the letter), and the height of the bars matched the letter height and width proportionally. The crowding bars were separated from the letter by 0.5 letter width.
Letter spacing: For the differential acuity tasks, one letter was displayed in each of the four quadrants. The spacing between the letters was twice the height/width of the largest target size; that is the closest distance between any 2 letters was 2 letter widths to avoid crowding effects (see Fig. 1A and B).24 This was also true for the spacing between the edge of the letters to the edge of the display area. As the letters decreased in overall size, the spacing between the targets (between the proximal or inner edge of each letter) remained constant throughout each experiment, while the distance to the display edge increased. This was done to avoid the perception that the letter target and distracters were moving inwards or outwards, to maintain the targets in the same eccentricity and to keep the size of eye movements constant.
For consistency in the crowded CvsOs, the spacing between the targets remained the same as for the non-crowded presentations (Fig. 1C and D) as measured from the outermost edge of the crowding bar belonging to a letter. This meant that that the target edges were unavoidably closer to the edge of the display area. Therefore, there was crowding involved from the display edges, but this decreased as the experiment progressed and the targets became smaller and the majority of the crowding would be caused by the crowding bars themselves.
All the letters were generated in Adobe Illustrator and then imported into the Experiment Builder software by SR Research™, version 1.5.201, Kanata, Canada. Thus all computer generated experimental displays and protocols were controlled using the Experiment Builder. Targets were displayed on a ViewSonic monitor which had a DPI of 1280×1024 pixels. The screen had a luminance of 153cd/m2 and the Weber contrast was 99%. The illumination was 73lux.
Acuity tasksDifferential acuity task: The differential recognition tasks required the participant to give a keyboard response indicating in which quadrant (top left, top right, bottom left, bottom right) of the screen the letter C was located. The keys “T”, “U”, “V”, and “N” respectively represented the top left, top right, bottom left, and bottom right positions on the screen, as they are located in these relative positions on a standard keyboard. The position of the C was varied randomly.
Identification acuity tasks: The identification tasks required the participant to recognise the letter presented at the centre of the screen and identify it by pressing the corresponding keyboard key. The participant had a letter choice from the subset of four letters (C, D, O, S) of which the participant was aware, thus creating a task with the similar chance level as the differential acuity task (1 out of 4, or 25%). The letters were varied randomly and for Name4Quad, the quadrant where the letter had to be named was randomly selected.
Sequence of display: The sequence and timing of display screens was: (1) a fixation cross was displayed for 1.5s to direct the participant's attention to the centre of the screen (the cross was not present during the subsequent presentation of letters), (2) the task screen with letters was shown which was terminated with a key press by the participant or terminated automatically after a maximum of 10s, (3) a blank grey screen displayed for 1s to allow time for blinking. This sequence was repeated throughout the acuity testing.
ProcedureParticipants were optically blurred to vary visual acuity between participants, so that correlations and limits of agreement could be determined in order to compare the measures of acuity. For any given participant the spherical dioptric blur was constant for all of the types of acuity measures. Thus the blur was purposefully different between individuals but the same within individuals. The amount of blur ranged from 2.00D to 3.75D between individuals. The session was completed monocularly with the right eye viewing, except for one participant who had high astigmatism in the right eye, and so the left eye was used. The other eye was occluded. For convenience, the blur was achieved in one of three ways: by removing the participant's habitual correction (in the case of myopes without astigmatism), by placing the desired amount of blur into a trial frame (in the case of emmetropes or soft contact lens wearers), or by fastening a full aperture trial lens in front of the participant's habitual correction. Removing a myope's spectacle correction gives blur similar to adding positive trial lenses over the full distance correction.
Each session began with an assessment of the participant's habitual corrected ETDRS monocular visual acuity followed by ETDRS acuity with optical blur. Both measurements were calculated using by-letter scoring (each letter worth 0.02 logMAR).2 The participant was periodically reminded not to squint (narrow their palpebral fissure). These two measurements were obtained using different versions of an ETDRS chart (Lighthouse™ 2nd edition) to minimise learning. The ETDRS letter charts had a luminance of 82cd/m2. The viewing distance was either 4m or 2m depending on the level of blur, but remained constant for each participant. The visual acuity value obtained with the induced blur was used for comparison with the results obtained from the other components of the experimental session.
The same five computer generated psychophysics tasks (described above) were completed by each participant in random order. These tasks were viewed at a testing distance of 2m, with the exception of those with the highest amounts of induced blur and these participants were seated at 1.6m away from the screen.
Each of the five tasks consisted of three sequential parts:
Demonstration: The demonstration phase was used to familiarise the participant with the task and the required responses for the given experiment. Most participants keyed in their own responses, but in some cases they verbalised their responses and the investigator entered them.
Estimation: Beginning with the largest target size, three presentations at each target size were shown and the estimation phase ended when the participant made an error, or failed to respond to a presentation within the 10s time limit.
Threshold: The threshold sequence began with targets two sizes (0.2logMAR) larger than the size at which the participant made the first error during the estimation phase. In the threshold sequence, there were 12 presentations per level. After each set of twelve presentations, if six or more responses were correct then the experiment would proceed to the next smallest target size. The experiment would only terminate once the participant made >50% errors to allow the participant's percent correct response rate to approach the guessing rate of 25% correct. A 62.5% correct response rate was used for all experiments as the threshold (half way between the 25% guessing rate and 100% for the four alternative forced choice presentations).
Statistical analysisStatistical analysis was undertaken in Excel and Systat. A p value of <0.05 was used for significance. Thresholds for each stimulus configuration were calculated by linear regression of the percent correct (after correction for guessing) against logMAR and by interpolation to give 62.5% correct. When there was more than one target size resulting in 100% correct (a plateau), the most proximal result only was included in the regression. Since there are expected differences between crowded and uncrowded acuity, the crowded acuity measures were compared amongst each other (ETDRS, Crowded Name4 and Crowded CvsO – Table 1) and similarly, the uncrowded measures were compared (Name4, Name4Quad and CvsO – Table 1). Repeated measures ANOVA was undertaken to determine any significant differences between visual acuity measures. Regression analysis (correlation) was undertaken between acuity measures and the 95% confidence intervals for the slopes were calculated to determine whether they differed from unity. Limits of agreement25 were calculated between the thresholds for each stimulus configuration. Bonferroni correction was used for multiple comparisons.
ResultsThe range of the blurred VA was 0.5–1.1, 0.45–1.13 and 0.64–1.05 logMAR for the ETDRS, Crowded Name4 and Crowded CvsO respectively. Repeated measures ANOVA (3×acuity measures) for the crowded targets (ETDRS, Crowded Name4 and Crowded CvsO) showed that there was no significant difference between the crowded acuity measures (p=0.63). The range of the blurred VA was 0.34–1.02, 0.45–0.95, 0.48–0.94 logMAR for the Name4, Name4Quad and CvsO respectively. Similar to the crowded targets, repeated measures ANOVA (3×acuity measures) for the uncrowded targets (Name4, Name4Quad and CvsO) showed that there was no significant difference between the uncrowded acuity measures (p=0.44).
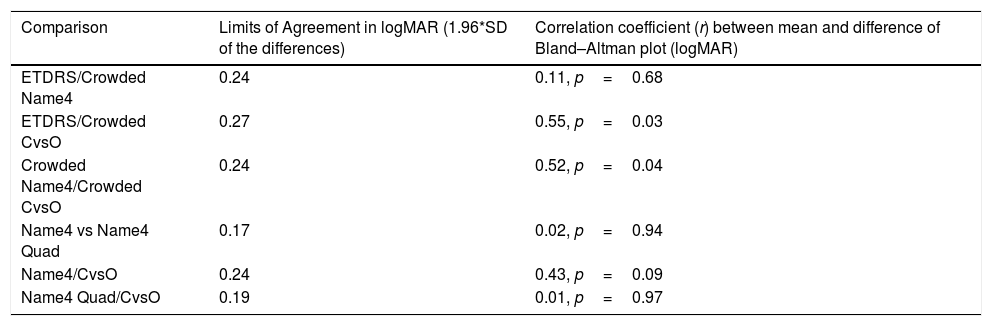
There was a significant correlation between all the tests (p<0.05 in all cases) with r ranging from 0.62 to 086. Bland and Altman plots are shown in Figs. 2 and 3 for the crowded and uncrowded acuity measures respectively. In most cases there was no significant trend – no significant correlation between the differences and the means (p>0.05) (Table 2). There were two exceptions to this: the ETDRS compared to Crowded CvsO, and Crowded Name4 compared to Crowded CvsO, which both showed a significant correlation (r=0.55, p=0.03, and r=0.52, p=0.04 respectively). As visual acuity becomes poorer, ETDRS tends to give a higher logMAR value (poorer acuity) than the Crowded CvsO (Fig. 2B) and Crowded Name4 tends to give a higher logMAR value (poorer) visual acuity than Crowded CvsO. However, when a Bonferroni correction is applied for multiple comparisons (p=0.05/3=0.0167), these are no longer significant. There were no significant trends for the uncrowded tests. The 95% limits of agreement (1.96×SD of the differences) are shown in Table 2.


Bland–Altman analysis. Limits of agreement and correlations between the means and differences of each pair of tests.
| Comparison | Limits of Agreement in logMAR (1.96*SD of the differences) | Correlation coefficient (r) between mean and difference of Bland–Altman plot (logMAR) |
|---|---|---|
| ETDRS/Crowded Name4 | 0.24 | 0.11, p=0.68 |
| ETDRS/Crowded CvsO | 0.27 | 0.55, p=0.03 |
| Crowded Name4/Crowded CvsO | 0.24 | 0.52, p=0.04 |
| Name4 vs Name4 Quad | 0.17 | 0.02, p=0.94 |
| Name4/CvsO | 0.24 | 0.43, p=0.09 |
| Name4 Quad/CvsO | 0.19 | 0.01, p=0.97 |
Our research question was whether the cognitively simpler differential acuity task would give equivalent visual acuity compared with the standard identification acuity task. Although such a task would be most beneficial for young children this question cannot be studied in children who are too young to match a shape as there is no test of recognition acuity against which the results can be validated. Therefore, this proof of concept study necessarily used adult observers. The results showed that differential acuity using CvsO either in crowded or uncrowded format gives a similar overall level of visual acuity compared to identification with similar crowding or lack thereof. This was shown by the ANOVA results and can be seen in Figs. 2 and 3. Crowded CvsO was not significantly different from the Crowded Name4 or the full ETDRS chart and the uncrowded version of CvsO was not significantly different from the uncrowded Name4 or Name4Quad. It is noteworthy that Name4Quad (which required eye movements) gave similar results to Name4 (in which the letters were presented in the centre of the screen), indicating that the need for eye movements does not unduly influence the results of forced choice presentations.
The limits of agreement (Table 2) are perhaps larger than anticipated (ranging between 0.17 and 0.27 logMAR), but it must be borne in mind that these values are for optically blurred vision, and compare different charts and response tasks. The test–retest repeatability for logMAR charts is approximately 0.1logMAR or one line.26 However, when comparing the limits of agreement between different visual acuity charts, the values are higher. Anstice et al. found the 95% limits of agreement to range between 0.13 and 0.18 for adults when comparing results on the ETDRS, HOTV, Lea symbols and Kay Pictures test21 while Mercer et al. found limits of 0.2 and 0.11 comparing Sloan letters with Lea and Patti Pics symbols respectively.27 Shah et al. found limits of agreement of 0.19 and 0.21 between the ETDRS and two versions of the Kay pictures test.28 These studies all used adult participants with corrected to normal visual acuity. It is worth noting that the test–retest repeatability or limits of agreement may be higher in people with reduced visual acuity, as was the case for our experiments where optical blur was induced. Rosser et al. found test–retest repeatability of 0.18 for the ETDRS chart in observers with cataract, pseudophakia and glaucoma20 and Hardgrave et al. showed a 95% limits of agreement of 0.17 between the ETDRS and the Lea Numbers Low Vision Book and 0.26 between the ETDRS and the Feinbloom chart for observers with low vision.29 These values indicate that when comparing different charts or procedures when vision is reduced, as in the current study, repeatability is typically poorer and our results are not inconsistent with the few previous similar studies which have considered this.
We used a C versus an O for the differential task as these have similar legibility.22,23 There has been discussion of whether Landolt C acuity is a form of resolution, rather than recognition acuity.3 Recently, it has been demonstrated that Landolt C acuity is more representative of recognition, than resolution acuity.3 Studies have shown that Landolt C acuity is poorer than ETDRS (Sloan) letter acuity, although more similar to British standard letters used in the Bailey–Lovie chart.22 However, clinical versions of resolution acuity (Teller Acuity Cards, and Cardiff Acuity Cards) tend to overestimate recognition acuity.9–11 Thus, if Landolt C acuity performs like a resolution acuity test, better, not poorer than ETDRS acuity, would be expected. This difference is especially pronounced in the presence of disease, including amblyopia.30 Thus we would anticipate that Landolt C acuity would be superior for detecting and monitoring amblyopia, which is one of the chief concerns for the paediatric population. Finally, most previous studies of Landolt C acuity have used the typical task, wherein the observer is asked to determine the position of the gap, which is different from the differential acuity task of the present study.
Limitations of the studyOne limitation of this study is that only spherical optical blur was used to decrease visual acuity. Astigmatic blur may produce different results that would be axis dependent, resulting in different amounts of blur for different letters, especially if letters with vertical, horizontal and/or oblique components had been included. This would require further study. A second limitation is that we have not included participants with reduced visual acuity due to ocular disorders which may give somewhat different results. In particular, those with central scotomas and amblyopia should be studied, as individuals with these conditions may perform differently. This would be an important aspect to include in future investigations.
ConclusionThe cognitively simpler task of identifying the unique or different target from among a group of other identical targets gives comparable results to the gold standard, ETDRS chart, in adults. This means that there is potential for it to be applied in clinical settings for young children or patients with developmental delay allowing measurement of recognition acuity to be obtained on a greater percentage of these patients.
FundingThis study was supported by Natural Sciences and Engineering Research Council Undergraduate Student Research Award (NSERC USRA) to CYS; NSERC Discover to ELI #203699; Canada Research Chair Program (CRC) to ELI #905-202761.
Conflicts of interestThe authors have no conflicts of interest to declare.
We thank Linda Lillakas for help with the figures.


