


The aim of this study was to explore associations among clinical measures of accommodation and vergences with symptoms, which could facilitate the validation of the Convergence Insufficiency Symptoms Survey to screen for deficient clinical measures.
MethodsUsing a multi-stage random cluster sampling, 1211 high school students (481 males and 730 females) between 13 and 18 years of age were selected and examined. Visual acuity, stereoacuity and suppression, refractive errors, near point of convergence, heterophoria and fusional vergences, as well as, amplitude of accommodation, accommodative response, facility and relative accommodation were evaluated. The validity of the Convergence Insufficiency Symptoms Survey to distinguish between children with and those without anomalies in the clinical measures were characterized using the Receiver Operation Curve, sensitivity and specificity of the tests.
ResultsThe overall mean and standard deviation for symptoms score was 27.38 ± 11.04. Deficient accommodative measures revealed worse symptoms scores than did deficient vergence measures and children with deficient clinical measures had significantly higher mean symptoms scores. (p = 0.001) However, the correlations between defective clinical measures and symptoms were significant but relatively weak. The Receiver Operation Curve showed that the clinical measures with the highest sensitivities using the CISS (≥16) were: reduced amplitude of accommodation 0.63, 95% Confidence interval, 0.59−0.68%) accommodative facility 0.62 (95% Confidence interval, 0.58−0.67) and near point of convergence 0.60 (95% Confidence interval, 0.53−0.67).
ConclusionDeficient clinical measures and symptoms of asthenopia are prevalent and correlated in the sample of school children studied. Overall, findings suggest that high school children with deficient clinical measures may be symptomatic when they perform intense near task compared to those without deficiencies. In addition, although validated for convergence insufficiency, the Convergence Insufficiency Symptoms Survey could barely distinguish between children with and without defective clinical measures. Findings highlight the need for and provide baseline data towards possible validation of a fast and reliable screening tool for vision anomalies. Further studies on similar populations are needed to confirm these findings and add to knowledge base.
Deficiencies of the clinical measures of accommodation and convergence are used to classify syndromes of functional accommodative anomalies [(accommodative insufficiency (AI), accommodative excess (AE) and accommodative infacility (AIF)) and vergence (convergence insufficiency (CI), convergence excess (CE) and fusional vergence dysfunction (FVD)] anomalies.
However, there are inconsistencies in the criteria applied to define these anomalies. Hence, some clinicians rely on some single clinical measures to define anomalies in their studies or in practice. Due to the concerns for these inconsistencies in definitions, in 1997, Rouse et al.3 and the College of Optometrists in Vision Development (COVD) investigated which single clinical measure that optometrist applied to diagnose CI.3 They found that 93% used single near point of convergence (NPC) criterion, 80% positive fusional vergence (PFV) criteria (60.5% Morgan’s data or OEP norms) and 75% used near phoria as the main criteria.
Anomalies of the clinical measures of accommodation and vergence may result in symptoms which include blurred vision at near, diplopia, eye strain, tearing, eyes tiring, and headaches.1,2 The symptoms are primarily aggravated by prolonged visually demanding, near-centered tasks such as reading, writing, or computer-based work.1,2 They create discomfort, impair efficient near tasks and may negatively impact on a child’s academic performance.1,2 However, in some cases, younger children are unable to adequately classify the symptoms they experience. This situation become even more concerning given that some accommodative or vergence anomalies present with similar symptoms and some anomalies may not present with symptoms even though the classical signs of such anomalies are identified.1,2 Furthermore, in rural settings and for underprivileged children who may not be opportune to afford an individual optometrist, their problems remain untreated. Thus, school vision screening becomes very relevant to identify children with defects (deficiencies) in clinical measures who will require referral for comprehensive eye examination. Despite its relevance, access to school children for vision screenings is limited by school authorities. The difficulty of access to schools will warrant the need for simple screening tools and protocols which will enhance faster and reliable screenings with easy referral criteria.
Given the clinical relevance of identifying vision anomalies in school settings, some studies have reported on various aspects of clinical measures and associations with symptoms.4–36 The goals of these studies4–36 were to extend knowledge base on how visual performance among school children can be maximized. A study in Israel by Cohen et al.6 found moderate correlations between near point of convergence (NPC) and symptoms in 66 school children aged between 8 and 10. Similarly, Momeni-Moghadam et al.7 found significant association between NPC and symptoms among University students in Iran. Furthermore, two studies4,5 on primary school children in the United States of America reported on clinical measures and symptoms. Borsting et al.4 found a significant correlations between NPC and negative fusional vergence (NFV) and symptoms scores among primary school children while Bade et al.5 found no correlations between clinical signs and symptoms in a study of symptomatic school children with CI aged between 9 and 17 years.
A unique contribution of the present study is that participants from the screening were high school children aged 13–18 years who were selected from rural schools, and had limited access to eye care due to their low socio-economic background. Maples15 found binocular anomalies to contribute to low academic achievement in children from low economic background.15 Therefore, the aim of the present study was to explore associations between clinical measures of accommodation and vergences and symptoms and highlight their relevance to vision screening for near vision anomalies. The hypothesis proposed was that significant association between clinical measures and symptoms will suggest that children with defective clinical measures are likely to be symptomatic and should be referred for comprehensive eye examination.
MethodsStudy designThis cross sectional study was designed to quantify refractive errors, and accommodative and vergence anomalies and investigate their associations with symptoms in order to develop strategies on how to identify and treat them. Therefore, the focus of this report is on near vision variables. The study protocol was approved by the Biomedical Research Ethics Committee (ethical clearance reference number BE 177/12) of the University of KwaZulu-Natal, South Africa. Written informed consents for access to the schools were obtained from the KwaZulu-Natal’s Department of Education and the school principals.
SamplingThe target population was Black high school students in the uMhlathuze Municipality of northern Kwazulu-Natal Province, South Africa. The study participants comprised 1211 children (481 males and 730 females) with age ranges of between 13−18 years who were selected from 13 out of a sample frame of 60 high schools in the municipality. The sampling method has been described in detail in report 1. The conduct of which complied with the Declaration of Helsinki regarding research on human subjects. For the entire study, students were excluded if they had suppression on the Worth-4-dot, strabismus, ocular diseases, nystagmus, motility problems, any systemic conditions or were on any systemic medication that might affect near vision function.
Study settings, materials and procedureThe school principals provided rooms at the school venues where the vision examinations were conducted. The purpose and procedure for every technique were carefully explained to each participant before starting the eye examination procedures. Validated optometric instruments were used and techniques were applied as described. As much as possible, the same conditions including test distances and standard room illumination were applied for all sessions and at all testing sites. All vision testing was performed between 08h30 and 13h30 over a period of one year and eye examinations were not performed when students were preparing for examinations or during examination days. The survey questionnaires and full data collection procedures and techniques have been described in report 1.
Data collection proceduresPreliminary testsAs an approach to avoid bias, the research assistant in station one worked independently of the optometrist who collected data in station two. The tests in the second station were performed by one certified optometrist who was experienced in performing the techniques therefore addressing the concern of inter-examiner variability. The techniques performed in the second station included the preliminary and the main tests. The preliminary tests were performed with participants wearing no optical correction and included ocular health status evaluation using the direct ophthalmoscope, suppression was evaluated at near using the Worth-4-dot test. (Bernell Corporation, Mishawaka Inc, USA)37–39 Other tests performed include:
Refractive errors was measured objectively using an autorefractor (MRK/3100; Huvitz, Seoul, South Korea) and subjectively.37,38 Stereoacuity was assessed using the Randot stereo test (Vision Assessment Corporation USA).40
Vergence tests were: near point of convergence (NPC) was measured using Royal Air Force (RAF) rule with a vertical line target, heterophoria assessed using cover test and the Von Graefe technique and fusional vergences with prism bars (gulden b-16 horizontal prism bars-Gulden Ophthalmics, Elkins Park, PA).
Accommodation tests included amplitude of accommodation (AA) was assessed using the Donder’s push-up method with the RAF near point rule, accommodation response (AR) was measured using the monocular estimated method (MEM) dynamic retinoscopy technique. Accommodative facility (AF) was assessed using the plus/minus 2.00 D flipper lens and relative accommodation tests were performed using minus and plus lenses for positive and negative relative accommodation respectively.
Data analysisAll data were entered on Microsoft Excel, checked by the author and analyzed by a statistician using the Statistical Package for Social Sciences. (SPSS for Windows, Version 21.0, IBM-SPSS, Chicago IL, USA) Descriptive statistics were presented as means, standard deviation and median. The Kolmogorov–Smirnov (K–S) was used to test for normality of data and given that most data were borderline between normal and non-normal distribution, both parametric and non-parametric statistical tests were applied to analyze most data. Specifically, both the Mann–Whitney test, Kruskal–Wallis and the t-tests were used to compare means and medians of defective and normal clinical measures for and symptoms. The Pearson correlation tests were used to compare the correlations between clinical measures and symptoms while Spearman’s rho test was used to examine correlations between clinical measures and symptoms. A p value of less than or equal to 0.05 (p ≤ 0.05) was considered statistically significant and the descriptive statistics for all variables are presented in tables.
A simple, fast and valid screening tool is required to minimize over referrals and validation of screening tools are achieved through sensitivity and specificity analysis. The accuracy of the test tool to distinguish between children with and without defects in the present study was characterized using the sensitivity and specificity of the tests. The sensitivity of the test is calculated as the percentage of children with defects in clinical measures who were correctly identified by the test tool. To be considered useful to identify vision defects, a high sensitivity (or low rate of false-negative results) is required while a high specificity (or low rate of false-positive results) is necessary to conclude that the test is a useful tool for confirming deficiencies in clinical measures.39 The criteria for the clinical measures were derived from a previous publication on the same sample using mean ± on standard deviation.
Sheard’s criterionSheard’s criterion (SC) proposes that for an individual to be comfortable (without experiencing symptoms), the fusional reserve opposing the heterophoria (the demand) should be at least twice the size of the heterophoria.22 Thus, the positive fusional reserve (BO) should be at least twice the amount of the exophoria and the negative fusional reserve (BI) should be at least twice the amount of an esophoria. Sheard’s criterion is especially useful with exo-deviations.22
ResultsSample characteristicsA total of 1211 returned their consent and assent forms but 10 students were excluded, (seven had amblyopia, one was diabetic, another was diagnosed with glaucoma and the other had corneal scars due to trauma) leaving 1201. A further 145 children aged 19 and older were excluded from this report as it is intended to report only on participants of official high school age range of 13−18 years in South Africa. Thus, data was analyzed for 1056 participants (a response rate of 87%) with mean age 15.8 ± 1.58 years and a median age of 16 years. There were 403 (38%) males and 653 (62%) females. The sample comprised 781 (73.9%) students from grades 8–10 (lower grade level) and 275 (26.0%) from grades 11–12 (higher grade level).There was a high correlation between left and right eyes spherical equivalent refractions. (r = 0.645, p = 0.01), therefore, only data for right eye are reported. The prevalence of refractive errors in this sample was: myopia: 6%, astigmatism 2.3%, anisometropia 1.3% and hyperopia 6.8%. The detailed descriptive statistics for refractive, accommodative and vergence measures are presented in report 1. All results reported are for near accommodative and vergence measures. The mean symptoms core was 27.38 ± 11.04.
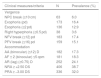
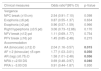
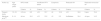
Prevalence of defective clinical measures and symptomsThe accommodative lag and relative accommodation had the highest prevalence for defective clinical measures (Table 1). Gender did not influence clinical measures while the older participants had more reduced NPC than the younger ones. (χ2 = 4.41, p = 0.036).
Failure rates for clinical tests of accommodation and vergence.
| Clinical measures/criteria | N | Prevalence (%) |
|---|---|---|
| Vergence | ||
| NPC break (≥10 cm) | 63 | 6.0 |
| Exophoria (pd) | 173 | 16.4 |
| Esophoria (≥2 pd) | 136 | 12.9 |
| Right hyperphoria (≥0.5 pd) | 38 | 3.6 |
| NFV break (≤12) pd | 183 | 17.4 |
| PFV break (≤16) pd | 159 | 15.1 |
| Accommodation | ||
| AA (binocular) (≤12) D | 182 | 17.3 |
| AF ± 2 (binocular) ≤5 cpm | 181 | 18.3 |
| AR (lag) (≥0.75) D | 252 | 24.1 |
| NRA ≥ +2.50 DS | 406 | 38.7 |
| PRA ≥ −3.00 DS | 336 | 32.0 |
NPC = near point of convergence, NFV = near fusional vergence, PFV = positive fusional vergence, AA = amplitude of accommodation, AF = accommodative facility, AR = accommodative response, NRA = negative relative accommodation, PRA = positive relative accommodation.
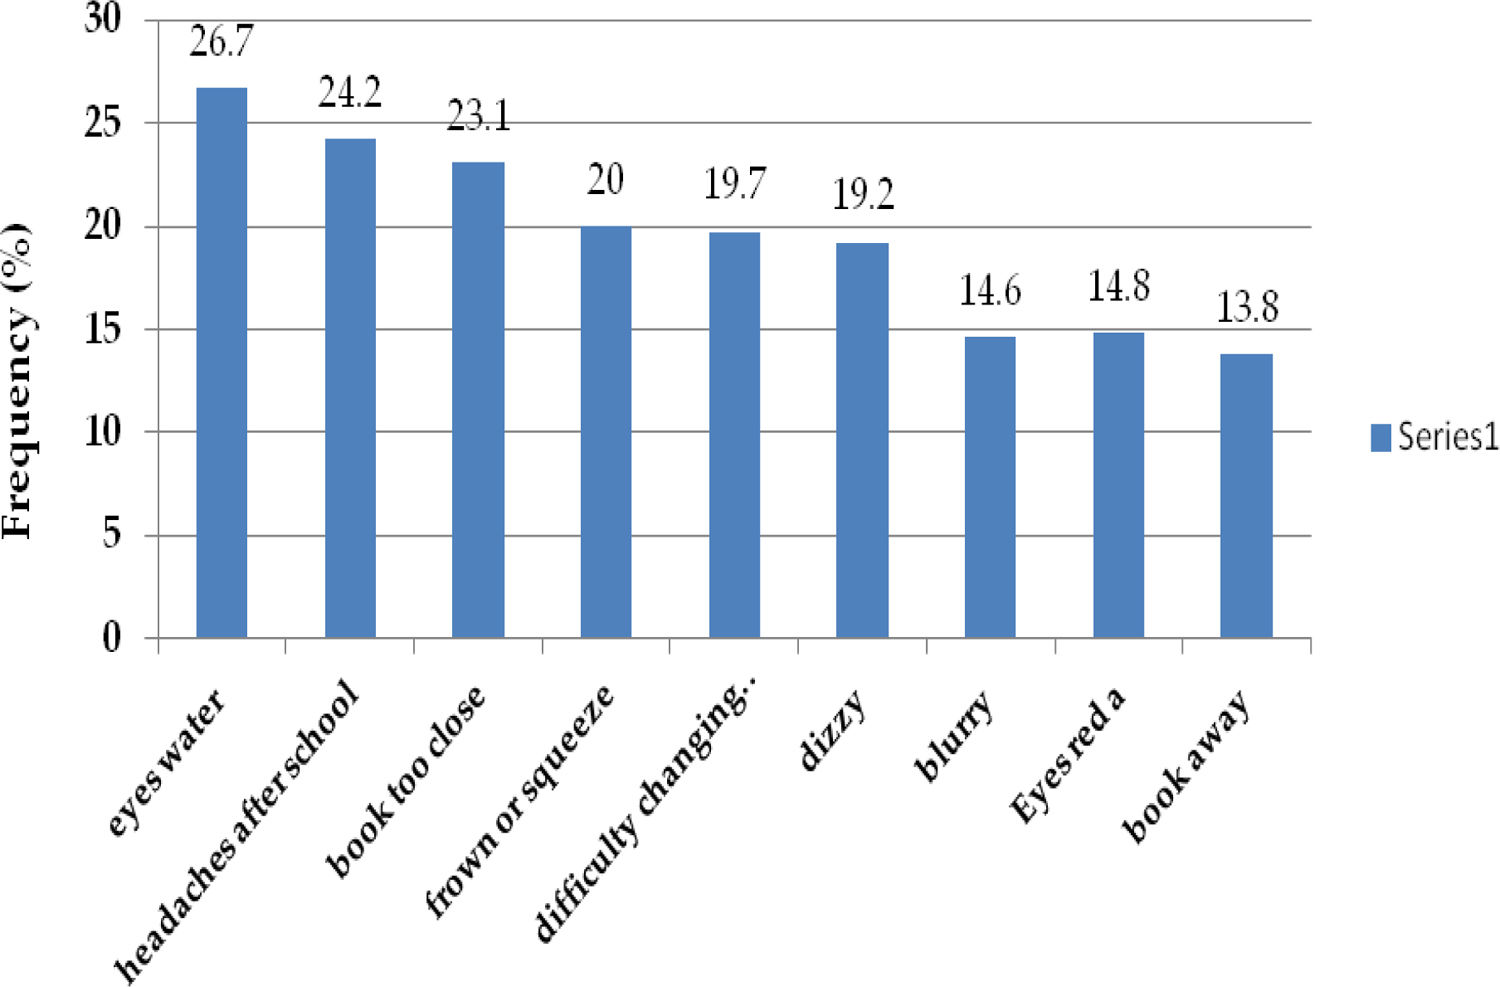
For part 1 (CISS) questionnaire, a high percentage 903 (86%) of participants were symptomatic (defined as ≥16) [41.29% were mildly symptomatic, 32% moderately and 27% severely symptomatic while compared to 149 (14%) who were asymptomatic. For part two (compiled list of symptoms), 562 (53%) were symptomatic whereas 490 (47%) were asymptomatic although the survey was validated only for part 1 survey. The most frequent symptoms for the CISS survey was re-read (Fig 1) while the symptom, eyes water was the most frequent for the non-CISS symptoms survey (Fig 2).
Association between clinical measures and symptoms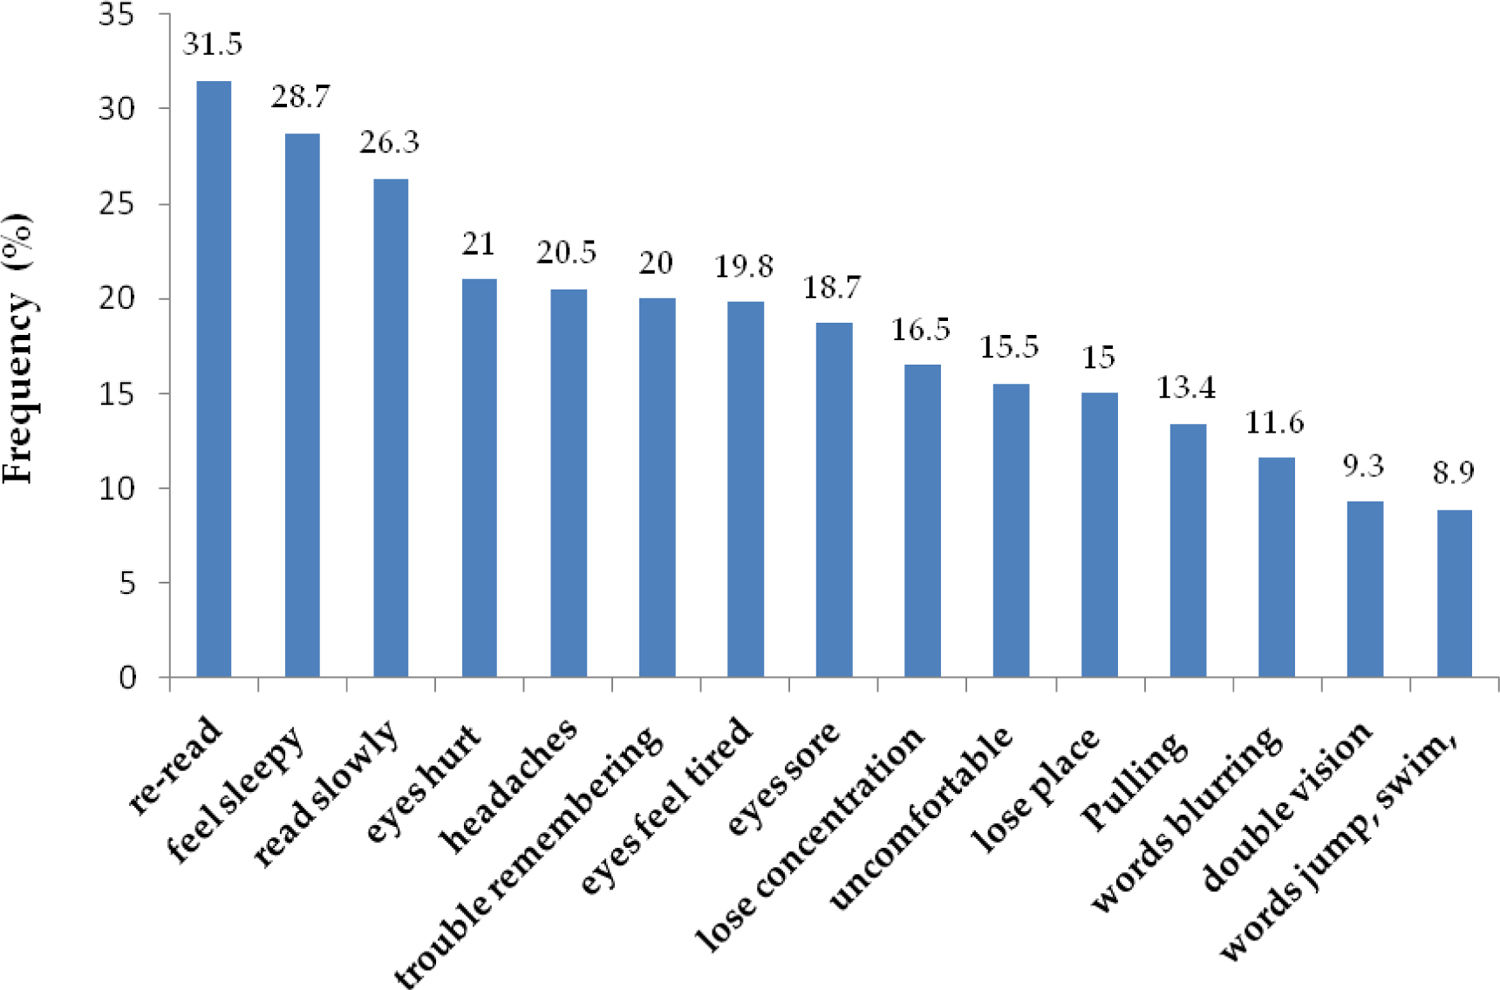
Various approaches were applied to relate clinical measures to symptoms.
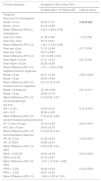
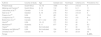
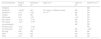
▪The participants were grouped as symptomatic or asymptomatic using the CISS ≥ 16 symptoms scores criteria and their means were compared between normal and defective clinical measures (Table 2).
Table 2.Distribution of symptoms scores (Survey Part 1) in clinical measures.
Clinical measures Symptoms CISS scores Part 1 Symptomatic (≥16) Means/SD t-test (p-value) Vergence Near point of convergence Break ≥10 cm 32.39 ± 7.97 2.06 (0.04)* Break <10 cm 30.16 ± 8.86 Mean Difference (95%CI) 2.23 (−0.09 to 4.56) Heterophoria Near Exo ≥6 pd 31.48 ± 8.86 1.74 (0.08) Near Exo <6 pd 30.10 ± 8.81 Mean Difference (95% CI) 1.38 (−0.18 to 2.95) Near eso ≥2 pd 31.91 ± 8.68 2.07 (0.04)* Near eso <2 pd 30.10 ± 8.83 Mean Difference (95% CI) 1.81 (0.095−3.54) Near Hyper ≥0.5 pd 31.31 ± 8.53 0.67 (0.50) Near Hyper <0.5 pd 30.29 ± 8.85 Mean Difference (95% CI) 1.01 (−1.94 to 3.96) Negative fusional vergences Break ≤12 pd 32.21 ± 9.28 2.96 (0.003)* Break >12 pd 29.94 ± 8.68 Mean Difference (95% CI) 2.27 (0.76−3.78) Positive fusional vergences Break ≤16 break pd 32. 08 ± 8.80 2.61 (0.01)* Break >16 pd 29.99 ± 8.79 Mean Difference (95% CI) 2.10 (0.52−3.67) Accommodation(D) AA (bin) AA ≤ 12 (D) 33.36 ± 8.16 5.10 (0.001)* AA > 12 D 29.56 ± 8.80 Mean Difference (95% CI) 3.79 (2.34−5.26) Accommodative facility (binocular) AF ± 2 (bin) ≤5 cpm 33.18 ± 8.49 4.93 (0.001)* AF± (bin) >5 cpm 29.45 ± 8.75 Mean Difference (95% CI) 3.73 (2.25−5.22) Accommodative response AR ≥0.75 DS 31.96 ± 8.29 3.39 (0.001)* AR <0.75DS 29.68 ± 8.91 Mean Difference (95% CI) 2.28 (0.96−3.61) NRA NRA ≥ +2.50 DS 29.03 ± 8.59 3.33 (0.001)* NRA <2.50 DS 31.03 ± 8.87 Mean Difference (95% CI) −2.01 (−3.19 to (−0.82) PRA PRA ≥ −3 DS 30.24 ± 8.84 0.58 (0.564) PRA < −3.DS 30.91 ± 8.42 Mean Difference (95% CI) −0.68 (−2.99 to 1.63)
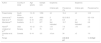
▪The mean symptoms scores were compared between those with normal versus defective clinical measures (Table 2) and the correlations were also determined (Table 3).
Table 3.Correlations between clinical measures and symptoms.
Clinical measures Symptoms scores Part 1 Part 2 r r2 p r r2 p Refractive errors Right eye sphere −0.04 −0.08 0.96 −0.04 −0.08 0.184 Right eye cylinder −0.05 −0.10 0.062 −0.07 −0.14 0.02* Vergence NPC break 0.41 0.82 0.001* 0.24 0.48 0.004* Exophoria −0.03 −0.06 −0.727 −0.01 −0.02 0.607 Esophoria 0.10 0.20 0.545 0.07 0.14 0.014* Vertical 0.03 0.06 0.235 0.04 0.08 0.153 NFV break −0.23 −0.46 −0.001* −0.10 −0.2 0.001* PFV break −0.07 −0.14 0.060 −0.04 −0.08 0.200 Accommodation AA (binocular) −0.47 −0.94 0.001* −0.14 −0.28 0.001* AF± 2 (binocular) −0.47 −0.94 0.001* −0.55 −1.1 0.001* AR (lag) 0.08 0.16 0.001* 0.10 0.20 0.001* NRA −0.16 −0.32 0.001* −0.15 −0.3 0.001* PRA 0.12 0.24 0.001* 0.12 0.24 0.001* Figures in bold letters describe significant association.
▪The association among the clinical measures with specific symptoms was also explored using means (Appendix A).
In general, the associations (Table 2) and correlations (Table 3) among clinical signs and symptoms were weak (low r values).The defective clinical measures with significant associations with specific symptoms (only) using the Kruskal–Wallis test (Appendix A), and the test values (Appendix B). The defective accommodative measures were associated with most symptoms than the vergence.
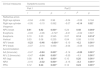
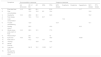
Distribution of symptoms scoresTable 4 shows the distribution of symptoms scores among participants who had deficient clinical measures. Part A shows the overall frequency of symptoms among those who had deficient clinical measures. The PRA had the highest frequency of symptoms scores. Part B shows the distribution of symptoms scores for those with deficient clinical measures within each category of deficient clinical measures.
Association between clinical measures and symptoms.
| Clinical measures | Part A: overall symptomatic for failed clinical measures | Part B: frequency of symptomatic for failed clinical measures within groups | ||
|---|---|---|---|---|
| (n/%) | n/% | n/% | n/% | |
| Vergence | symptomatic | symptomatic | asymptomatic | All |
| NPC break (≥10 cm) | 63 (6.56) | 59 (93.65) | 4 (6.35) | 63 (100) |
| Exophoria (≥6 pd) | 173 (16.19) | 146 (84.39) | 27 (15.61) | 173 (100) |
| Esophoria (≥2 pd) | 136 (12.90) | 116 (85.29) | 20 (14.71) | 136 (100) |
| Hyperphoria (≥0.5 pd) | 38(4.0) | 36 (94.74) | 2 (5.26) | 38 (100) |
| NFV break ≤12 | 183 (17.7) | 159 (86.89) | 24 (13.11) | 183 (100) |
| PFV break ≤16 break | 159 (15.7) | 142 (89.31) | 17 (10.69) | 159 (100) |
| Accommodation | ||||
| AA (binocular) ≤12 | 182 (18.6) | 167 (91.76) | 15 (8.24) | 182 (100) |
| AF ± 2 (binocular) ≤ 5 | 181 (19.4) | 164 (90.61) | 17 (9.39) | 181 (100) |
| AR ≥ 0.75 | 252(25.20) | 226 (89.68) | 26 (10.32) | 252 (100) |
| NRA ≥ +2.50 | 406 (37.44 | 337 (83.0) | 69 (17.0) | 406 (100) |
| PRA ≥ −3 | 336(31.44) | 283 (84.43) | 53 (15.77) | 336 (100) |
About 15% of the participants failed the Sheard’s criterion and the mean symptoms scores for participants that failed the SC was higher (31.52 ± 8.91) than for those that passed (30.12 ± 8.80) although the difference was not significant (t = 1.67, p = 0.096). There was no significant difference in proportion failed SC between symptomatic (14.1%) and asymptomatic (15.4%).
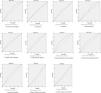
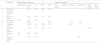
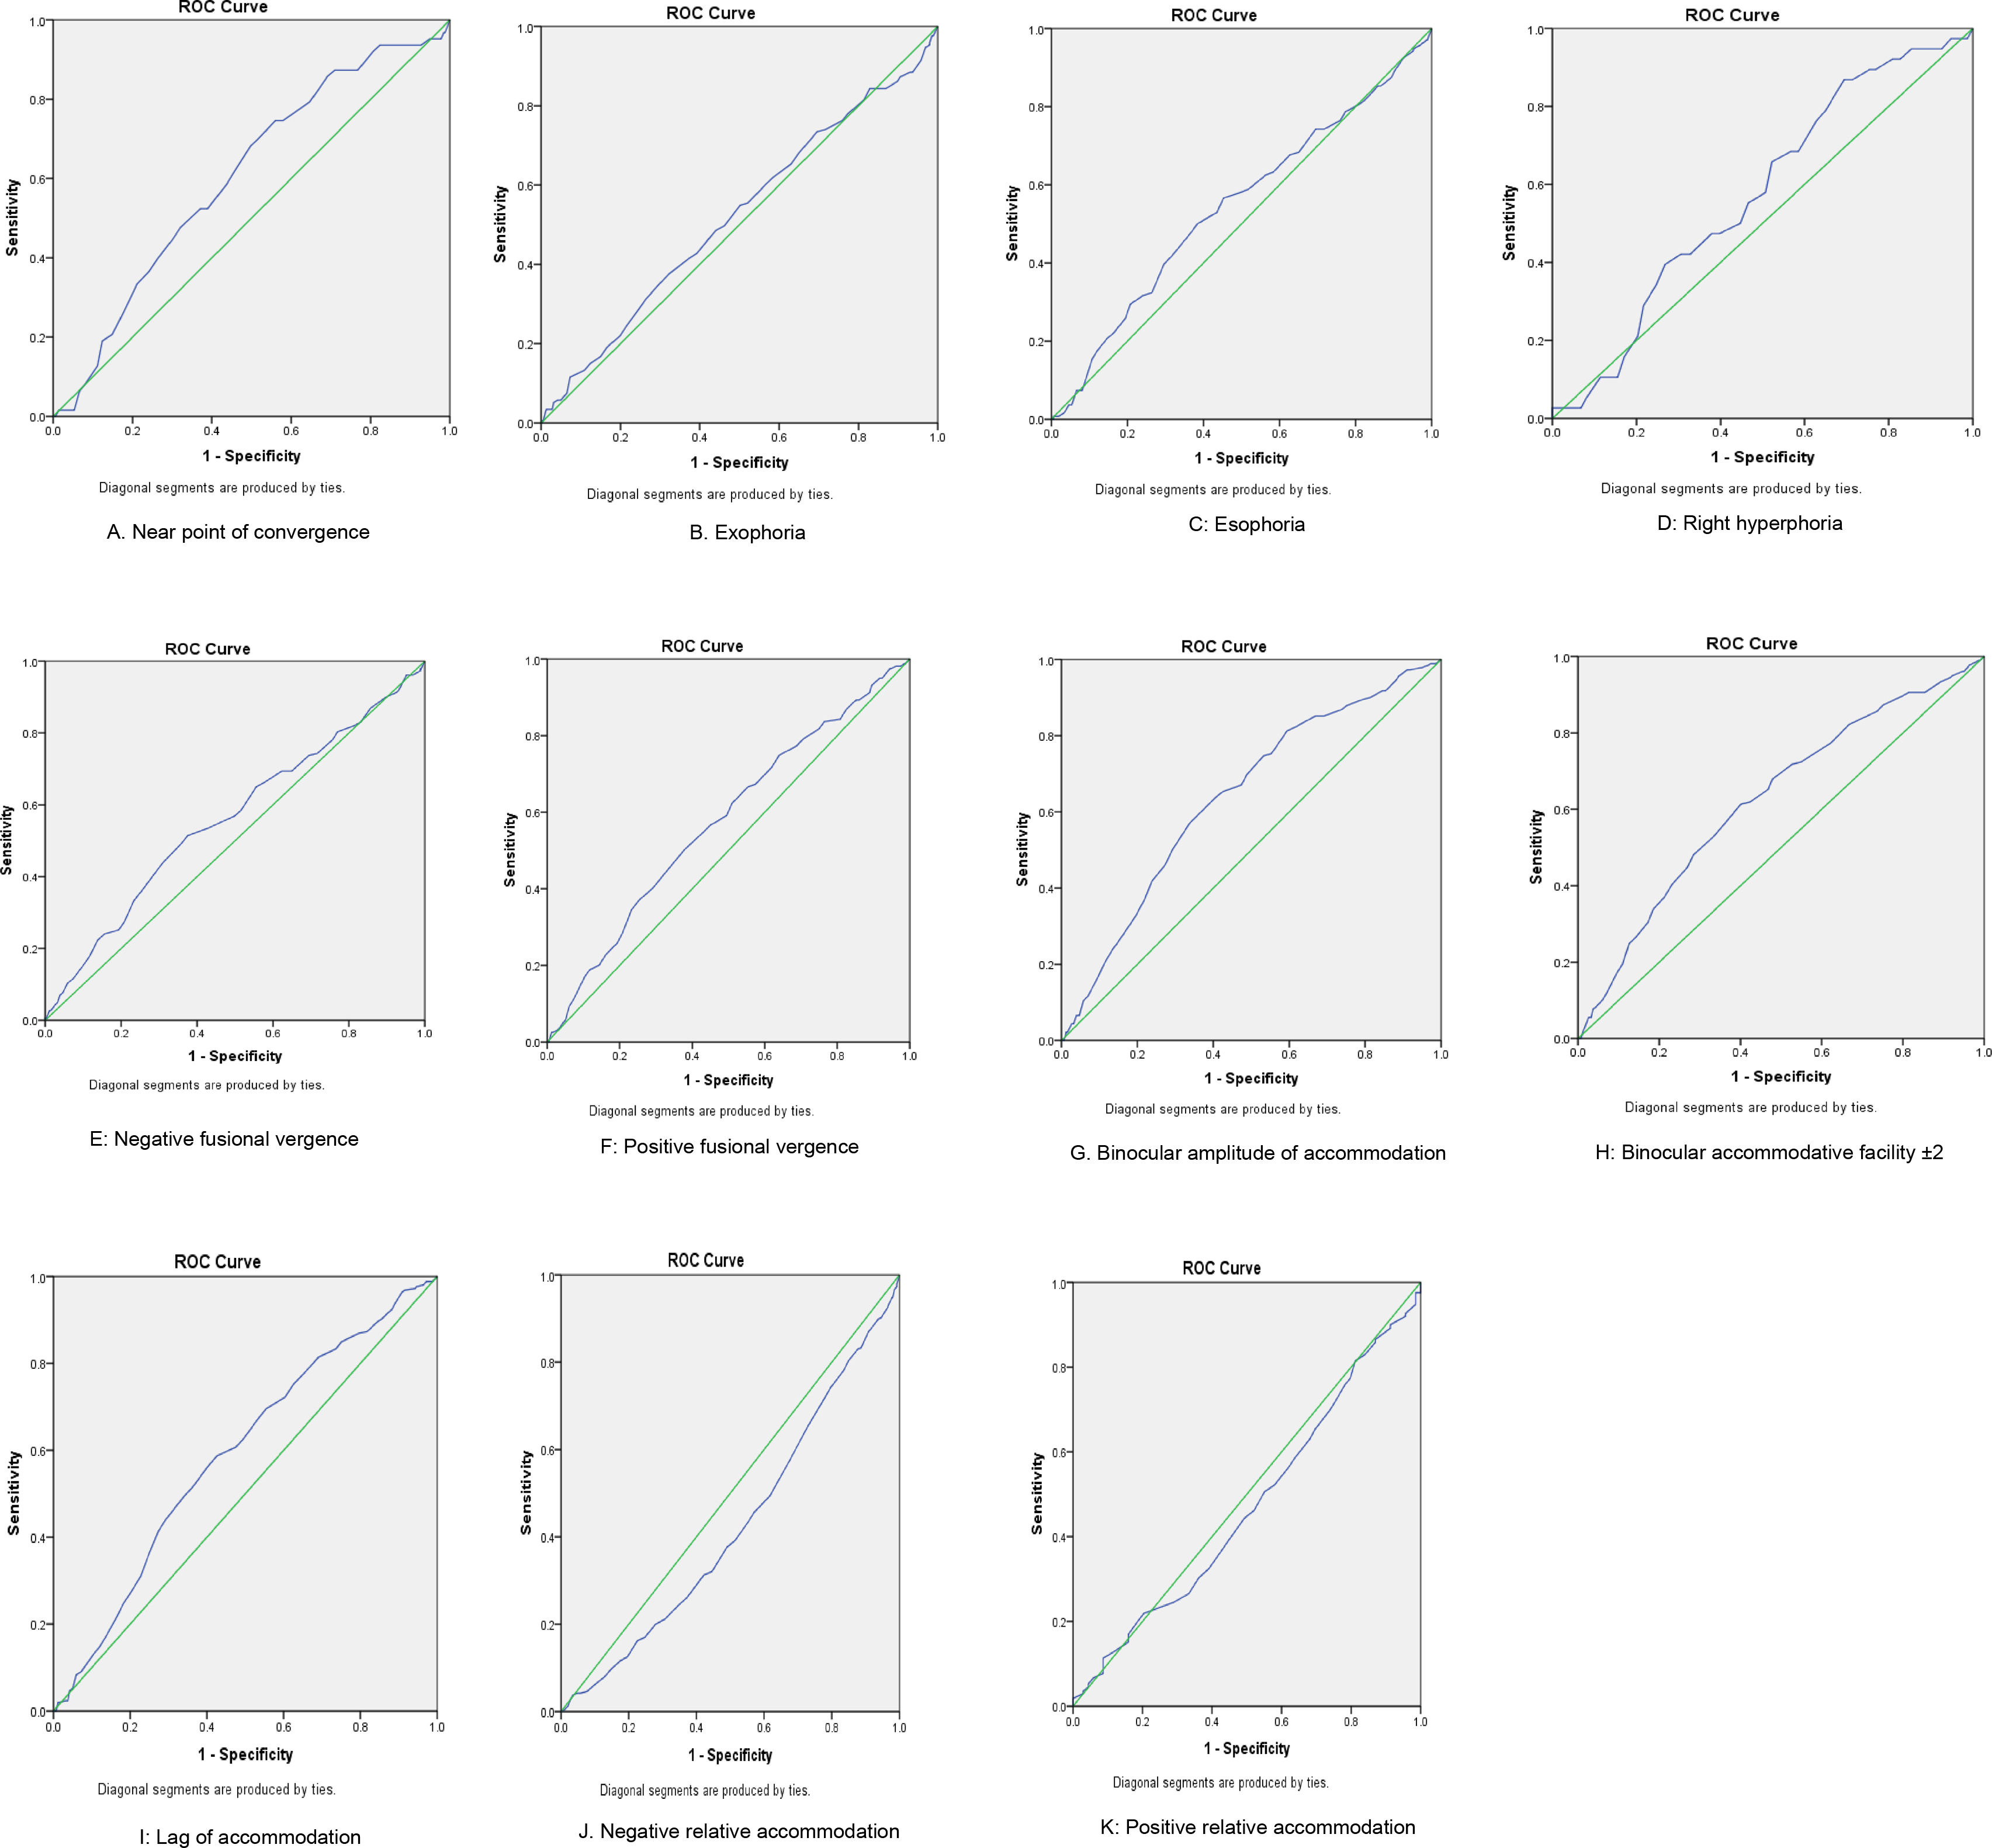
To determine the level accuracy of the CISS (≥16) to distinguish between normal and defective clinical measures, the Sensitivity and specificity estimates (Table 5) as well as the ROC curves characteristics (Fig. 3A–K) and odds ratios (Table 6) were analyzed.
Sensitivity, Specificity, positive predictive value (PPV) and negative predictive value (NPV) of diagnosis of defects in accommodative and vergence measures and symptoms.
| Clinical measures | Area the curve (%) | Lower limit(%) | Upper limit(%) | Sensitivity (%) | Specificity (%) | PPV (%) | NPV (%) |
|---|---|---|---|---|---|---|---|
| Vergence | |||||||
| NPC break (≥10 cm) | 0.60 | 0.53 | 0.67 | 93.65 | 14.71 | 6.5 | 97.32 |
| Exophoria (≥6 pd) | 0.52 | 0.47 | 0.56 | 84.39 | 13.88 | 16.17 | 81.88 |
| Esophoria (≥2 pd) | 0.54 | 0.49 | 0.59 | 85.29 | 14.14 | 12.90 | 86.58 |
| Right hyperphoria (≥0.5 pd) | 0.57 | 0.48 | 0.65 | 94.74 | 14.54 | 4.0 | 98.66 |
| NFV break (≤12) | 0.55 | 0.51 | 0.60 | 86.89 | 14.34 | 17.67 | 83.78 |
| PFV break (≤16) | 0.57 | 0.52 | 0.62 | 89.31 | 14.78 | 15.73 | 88.59 |
| Accommodation | |||||||
| AA (binocular) (≤12) | 0.63 | 0.59 | 0.68 | 91.76 | 15.47 | 18.58 | 89.93 |
| AF ± 2 (binocular) ≤ 5 | 0.62 | 0.58 | 0.67 | 90.61 | 15.47 | 19.36 | 88.03 |
| AR (lag) (≥0.75) | 0.59 | 0.55 | 0.62 | 89.68 | 15.40 | 25.22 | 82.43 |
| NRA ≥ +2.50 | 0.42 | 0.39 | 0.46 | 83.0 | 12.31 | 37.44 | 53.38 |
| PRA ≥ −3.00 | 0.47 | 0.40 | 0.54 | 85.80 | 13.30 | 93.33 | 6.08 |
NPC = near point of convergence, NFV = near fusional vergence, PFV = positive fusional vergence, AA = amplitude of accommodation, AF = accommodative facility, AR = accommodative response, NRA = negative relative accommodation, PRA = positive relative accommodation. PPV = positive predictive value, NPV = negative predictive value, Symptomatic (CISS) score ≥16.
Relationship between failure of clinical tests and the CISS scores.
| Clinical measures | Odds ratioa(95% CI) | p-Value |
|---|---|---|
| Vergence | ||
| NPC break (≥10 cm) | 2.54 (0.91−7.10) | 0.098 |
| Exophoria (≥6 pd) | 0.87 (0.55−1.37) | 0.634 |
| Esophoria (≥2 pd) | 0.96 (0.57−1.59) | 0.966 |
| Right hyperphoria (≥0.5 pd) | 3.06 (0.73−12.86) | 0.170 |
| NFV break (≤12) pd | 1.11 (0.69−1.77) | 0.754 |
| PFV break (≤16) pd | 1.45 (0.85−2.48) | 0.215 |
| Accommodation | ||
| AA (binocular) (≤12) D | 2.04 (1.16−3.57) | 0.015 |
| AF ± 2 (binocular) ≤5 cpm | 1.77 (1.03−3.01) | 0.050 |
| AR (lag) (≥0.75) D | 1.58 (1.01−2.48) | 0.056 |
| NRA ≥ +2.50 DS | 0.69 (0.48−0.97) | 0.040 |
| PRA ≥ −3.00 DS | 0.91 (0.44−1.87) | 0.930 |
Tests if increase (or decrease) in CISS score is associated with increase (or decrease) in odds of failing the clinical test. Bold fonts = significant association. NPC = near point of convergence, NFV = near fusional vergence, PFV = positive fusional vergence, AA = amplitude of accommodation, AF = accommodative facility, AR = accommodative response, NRA = negative relative accommodation, PRA = positive relative accommodation, Symptomatic (CISS) score ≥16.
The Receiver Operation Curve characteristic values to determine the accuracy of the CISS (≥16) scores to distinguish between children with or without defective clinical measures is shown in Fig. 3(A–K) A CISS scores (≥16) was more likely to be accompanied by reduced NPC break, PFV, reduced AA, AF and lag of accommodation.
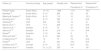
Comparisons with previous studiesFindings from this study were compared with previous studies (Tables 7–12). The prevalence reported varied considerably due to differences in study design especially the criteria/definition of anomalies.
Near point of convergence.
| Authors | Country of study | Age | Sample size | Technique | Criteria (cm) | Prevalence (%) |
|---|---|---|---|---|---|---|
| Present study | South Africa | 13−18 | 1056 | PU | ≥10 cm | 6 |
| Metsing and Ferreira13 | South Africa | 8−13 | 112 | PU | 9−11 | 11 |
| Letourneau et al.28 | Canada | 7−14 | 735 | PU | ≥10 cm | 8.3 |
| Abdi et al.16 | Sweden | 6−16 | 216 | PU | ≥10 cm | 6 |
| Power et al.25 | USA | 15 | 461 | PU | ≥9 | 15.4 |
| Lindqvist et al.24 | Norway | 14 | 75 | PU | ≥10 | 8 |
| Badovinac et al.27 | Canada | 21.1 ± 2.2 | 259 | PU | >6 | 11.0 |
| Harris29 | USA | 10−12 | 171 | PU | ≥8 | 6 |
| Macfarlene30 | Australia | 6−11 | 877 | PU | ≥6 | 6.5 |
| Hayes31 | USA | Not indicated | P | ≤6 | 15 | |
| Gallaway and Mitchell39 | USA | Not indicated | 154 | PU | ≥6 cm | 13%) |
| Christian et al.26 | Canada | 6−14 | 121 | PU | ≥5 cm | 35 |
| Range | 3−35% |
Heterophoria.
| Author | Country of study | Age (years) | Sample size | Exophoria | Esophoria | ||
|---|---|---|---|---|---|---|---|
| Criteria (pd) | Prevalence (%) | Criteria (pd) | Prevalence(%) | ||||
| Present study | South Africa | 13−18 | 1056 | ≥6 | 16.4 | ≥2 | 12.9 |
| Leone et al.9 | Australia | 6−9 | 4093 | 2 | 52.2−58.3 | 9.2–10.4 | |
| Abdi et al.16 | Sweden | 6−16 | 216 | ≥6 | 8.8 | ≥4 | 1.4 |
| Marcfelene30 | Australia | 6−11 | 877 | Not indicated | 18.7 | Not indicated | 6.8 |
| Harris29 | USA | 10−12 | 171 | >10 | 7.6 | >10 | 2.3 |
| Lindqvist et al.24 | Norway | 14 | 75 | 0−8 | 47 | ||
| Christian et al. 26 | Canada | 6−14 | 121 | >5 cm | 34 | >5 | 1% |
| Range | 2.6–52.2 pd | 1–12.9 pd |
Deficient accommodation measures.
| Author (s) | Country of study | Age (years) | Sample size | Reduced AA | Reduced AF |
|---|---|---|---|---|---|
| Prevalence % | Prevalence % | ||||
| Present study | South Africa | 13−18 | 1056 | 17.3 | 18.3 |
| Moodley12 | South Africa | 6−13 | 264 | 24 | 30 |
| Metsing & Ferreira13 | South Africa | 8−13 | 112 | 10 | 12.3 |
| Borsting et al.4 | USA | 8−15 | 392 | 17 | N/A |
| Gallaway39 | USA | N/A | 154 | 12 | 21 |
| Marran et al.14 | USA | 11.5 | 299 | 4.7 | N/A |
| Sterner et al.11 | Sweden | 6−10 | 76 | 34 | N/A |
| Abdi et al.16 | Sweden | 6−16 | 216 | 11.1 | N/A |
| Dwyer23 | Australia | 7−18 | 144 | 8 | 5 |
| Wick and Hall17 | USA | 6−12 | 200 | 25 | 53 |
| Lindqvist et al.24 | Norway | 14 | 75 | 3% | N/A |
| Power25 | USA | 15 | 461 | 24.4 | N/A |
| Christian et al.26 | Canada | 6−14 | 121 | N/A | 9% |
| Badovinac et al.27 | Canada | 21.1 ± 2.2 | 259 | 1.4 | 18.7 |
NA = not available.
The prevalence of symptoms among children with deficient measures.
| Author (s) | Age range years | NPC break | Insufficient PFV break | Esophoria | Reduced AA | Reduced monocular AF | |||||
|---|---|---|---|---|---|---|---|---|---|---|---|
| Criteria | % | Criteria | % | Criteria | % | Criteria | Criteria | % | |||
| Present study | 13−18 | ≥10 cm | 6.5 | ≤16 | 15.7 | ≥2 | 12.9 | ≤12 | 18.6 | 5 cpm | 19.4 |
| Menjever et al.35 | 9−14 | ≥6 cm | 24.1 | ≤15 | 13.2 | ≥3 | 5.0 | Hoffsteters | 18.4 | <6 cpm | 14.3 |
Comparisons of findings for clinical measures and symptoms.
| Authors | Clinical measure | Endpoints of significant associations with symptoms |
|---|---|---|
| Present study | NPC | ≥10 |
| Momeni-Moghadam et al.7 | NPC | 9.5 cm |
| Rouse et al.33 | NPC | 6 and 10 cm |
| Hayes31 | NPC | 6 and 10 cm |
| Maple15 | NPC | ≥5 cm |
| Cohen et al.6 | NPC | ≥7 cm |
| Menjiva et al.35 | NPC | 6 cm and 7.5 cm |
| Hennessy et al.20 | AF | 6−11 cpm binocular |
| Menjiva et al.35 | AA | 10 D |
Correlation coefficients for clinical measures and symptoms scores.
| Clinical measures | Present study | Borsting et al.4 | Bade et al.5 | Cohen e t al.6 | Iribarren et al.18 |
|---|---|---|---|---|---|
| Vergence | NR | ||||
| Exophoria | −0.036* | NR | All r values = 0.094all p values p = 0.17 | NR | NR |
| Esophoria | 0.10* | 0.05* | NR | NR | |
| Vertical | 0.03* | NR | NR | NR | |
| NPC break | 0.41 | 0.22 | −0.4 | NR | |
| NFV break | −0.23 | −0.16 | NR | NR | |
| PFV break | −0.07 * | −0.07* | NR | NR | |
| Accommodation | NR | NR | |||
| AA (binocular) | −0.47 | −0.24 | NR | ||
| AF (binocular) | −0.47 | −0.47 | NR | −0.28 | |
| AR (lag) | 0.08 | NR | NR | NR | |
| NRA | −0.16 | NR | NR | NR | |
| PRA | 0.12 | NR | NR | NR |
NR = not reported.
This study explored associations between clinical measures and symptoms and found that defective clinical measures are prevalent in this cohort of school children. In addition, the participants with defective clinical measures had significantly worse symptoms scores than those with normal ranges. The significant association between defective clinical measures and symptoms suggest that children with defective clinical measures are more likely to manifest symptoms than those with normal ranges. However, the weak correlation between CISS scores and clinical measures suggest that the CISS can barely identify deficient clinical measures of accommodation and vergence.
Defects in clinical measures: prevalence and associations with symptomsAs expected, the prevalence of defective clinical measures reported across studies varied and may be due to differences in the study designs which include the techniques and criteria applied to define them (Tables 7–9). For studies on South African populations, the prevalence of poor amplitude of accommodation and reduced accommodative facility were lower than Moodley12 but higher than Metsing and Ferreira13 (Table 9). The differences may be related to age differences as Moodley12 studied younger children who may experience some difficulty with the subjective techniques of both accommodative amplitude, and facility tests. Another perspective is that the amplitude of accommodation of young children may not be as good as expected as revealed in the study by Sterner et al.41 Leone et al.9 typifies the influence of criteria on prevalence estimates. Remarkably, they9 applied a low cut-off to define heterophoria and found a much higher prevalence of exophoria (Table 8). This highlights the need for standardized uniform criteria for clinical measures which will enhance comparing findings across studies.
Frequency of symptomsAnalysis of patients’ symptoms are important for decisions regarding diagnoses, and clinicians consider presentation of symptoms when deciding on treatment as most patients consult the optometrist because symptoms bother them. In this study, a high percentage (86%) of participants were symptomatic [mild: 41.29%, moderate: 32% and severe: 27%] which is higher than 47.5% reported by Ponsonby et al.42 Given that CISS questionnaire was administered appropriately as described, several factors could be proposed for the high prevalence of symptomatic participants in this study. The prevalence of symptoms among children with defective measures (Table 4) compared to Menjivar et al.35 (Table 10).
The differences in findings may be due to differences in study designs especially criteria for the clinical measure. Another source of differences is that the validation of the CISS in only the English language has been identified as a major factor in the administration and interpretation of the CISS.43 Secondly students may exaggerate symptoms in order to be given spectacles. In addition, due to aspects of the design of the present study, children with refractive errors were not excluded whereas refractive cases were excluded in some major studies.4,14,35 which reported lower frequencies of symptoms. Furthermore, it is possible that the high frequency of symptoms may be peculiar with this population and this hypothesis requires further investigation.
An earlier study found accommodative anomalies are more symptomatic than vergence anomalies37 agrees with present study and others which reported significant association between deficient accommodative measures and symptoms.,10,11,16–20 Chase et al.10 found a strong and positive correlation between accommodative lag and visual discomfort symptoms during near work conditions among University students while in Sterner et al.,11 only the AA and NRA were significantly associated with symptoms: Hennessy et al.20 derived the normative range using the mean ± 1 SD as in this study and found significant associations between AF and symptoms as in the present study. Accommodative facility had the most consistent correlations with symptoms.16–20 Furthermore, AF is also considered the clinical measure most likely to predict symptoms20 which according to Garzia and Nicolson,21 may be because AF test is a dynamic test, more interactive, and forces the accommodative-vergence to respond to frequent changes in the stimulus, therefore may yield more realistic results.21
Several studies found significant correlations between NPC and symptoms using different cut -offs7,31–33 (Table 7). However, Bade et al.5 found a non-significant associations between three severities (mild, moderate and severe) of vergence measures and symptoms in symptomatic participants with CI whereas there was only normal and defective category in this study. The difference in findings on clinical measures and symptoms remained even when only the symptomatic participants in this study are compared with findings by Bade et al.5 For NPC, the traditional cut off range of 8−10 cm appears to be ideal although this depends on the population studied. The test instrument and techniques influence the findings from studies and the push-up technique was generally used to measure NPC. For example, the RAF rule is used with a slight inclination while the Aston Accommodative Rule may be applied otherwise. Significant associations may also be influenced by the nature of the symptoms survey used. The CISS and the COVD-QOL are validated surveys and may yield more valid outcomes than other non-validated surveys whereas some studies used non-validated questionnaires.
Heterophoria is considered a poor predictor of symptoms22 although esophoria was associated with symptoms but not exophoria. The NFV was significantly correlated with symptoms both esophoria and NFV are useful to classify convergence excess which has been found to be associated with symptoms. Significant associations between NFV and symptoms which were also reported in Borsting et al.4 and Sedaghat & Abrishami34 suggest a power of compensation of larger amounts of base-in prisms.34 As in the present study, Borsting et al.4 applied the mean ± one standard deviation to derive normative values for prism bar fusional vergences. Furthermore, the association between heterophoria and fusional vergences are more meaningful when assessed based on Sheard’s criterion.22 Approximately 14% of the symptomatic group failed the SC in the present study and there was no significant association. A similar finding (13.8%) was reported by Hussaindeen et al.36 for Indian children aged between 7 and 17 years and there was no significant association between SC and symptoms. In contrast, Sheedy and Saladin22 found significant association between SC and symptoms among university students and concluded that failing the SC is a good predictor of symptoms.22 The participants in their study were university students who may have more near task demands and more likely to manifest symptoms.
Clinically, most accommodative and vergence anomalies present with similar symptoms which necessitates differential diagnosis which could enhance efficient diagnosis and treatments. This study investigated such associations (Appendix A) and found AF to have more specific symptoms. However, correlations between clinical measures and symptoms scores are generally weak (Table 12). These findings may mean that the participants did not have underlying accommodative or vergence anomalies of magnitude or intensity that could trigger symptoms. Alternatively, it may mean that they have not performed near task which is intense and prolonged enough to trigger the anomalies and symptoms.
In general, individuals may manifest symptoms where there is a breakdown in the accommodative-vergence synergy resulting from sustained near point stress.44 Therefore, the frequency and strengths of associations of such functional anomalies would be related to the timing, duration or intensity of near task that the individual performs. The intensities of near point activities which may cause symptoms of asthenopia could vary from day-to-day among persons and snapshot records of symptoms45 may not show such associations as most testing during vision screenings are performed within minutes while inferences are intended for prolonged period of reading. However findings from such snap shot screenings give baseline information on the prevalence of accommodative and vergence anomalies which will guide further studies.
The defining cut-off points influences the sensitivities and specificities of a diagnostic and only one available study investigated the validity of the CISS to screen for other visual anomalies.46 Similar to the present findings, Mitchell and Gallaway46 found that a CISS score (≥16) had a sensitivity of 62% and specificity of 61% in predicting failure of two or more visual skills tests (beside convergence insufficiency) which included reduced NPC break and binocular accommodative facility were more likely to be accompanied by CISS score ≥16 (symptomatic).
Implications, applications, strengths and limitations of the studyIn general, given the functional nature of accommodation and vergence anomalies, the weak correlations among outcome variables imply that more significant associations could occur if prolonged and intense near task is performed. However, the findings on clinical measures and CISS scores suggest that the CISS can barely distinguish between children with and without deficient clinical measures. Defects in clinical measures of accommodative and vergence predisposes the student to develop symptoms as near point visual demands increases. Findings from this study provide baseline data for subsequent studies towards validation of the CISS for vision screening for accommodative vergence defects.
The limitations and strength of this study has been detailed in report one. The lack of cycloplegia is a limitation of this study and could not be performed due to parental objections. The use of cycloplegia may not always be necessary47 as it could disrupt the near vision function if applied.
The Modfied Thorighton technique would have been a better technique to measures heterophoria.
The firm research design which includes the random sampling employed, using many schools with large sample size, data collected by only one examiner improves the external validity of this study; therefore, the findings can be extrapolated to the entire population of high school children.
ConclusionEvidence from this study shows that:
▪Defective clinical measures and symptoms of asthenopia are prevalent in the sample of school children and deficient accommodative measures present symptoms more than vergence measures.
▪Participants with defective clinical measures are more likely to be symptomatic than those without. The CISS could barely serve as a tool to identify students with defects in clinical measures of accommodation and vergence who will need referral for compressive eye examination.
The findings from reports 1 and 2 highlight the need-- as well as provide baseline data towards validation of a simple and fast tool for screenings and referral of children with defective accommodation and vergence measures. Further studies to confirm these findings and evaluate association between clinical measures and symptoms when near task are performed for a prolonged period of time will be required.
Conflicts of interestThe author has no conflicts of interest to declare.
I am grateful to Prof Mark Rosenfield (SUNY College of Optometry New York, USA) and Dr Rekha Hansraj (University of KwaZulu –Natal South Africa) for reviewing some drafts of this manuscript. I also thank Prof Rosenfield for supplying me copies of the classic articles referenced.
| Symptoms | Accommodation measures | Vergence measures | ||||||||||
|---|---|---|---|---|---|---|---|---|---|---|---|---|
| AA (binocular) | AF ± 2 Bin | AR | NRA | PRA | NPC (break) | Exophoria | Esophoria | Hyperphoria | NFV (break) | PFV break) | ||
| 1. | Eyes feel tired | 11.2 | 26.5 | 22.1 | 21.9 | 11.7 | ||||||
| 2. | Feel uncomfortable | 13.2 | 15.2 | 9.5 | 12.4 | 10.9 | ||||||
| 3. | Headache | 12.6 | 49.8 | 30.1 | 34.6 | 19.2 | ||||||
| 4. | Feel sleepy | 12.4 | 11.6 | 20.7 | ||||||||
| 5. | Lose concentration | 13.4 | ||||||||||
| 6. | Trouble remembering | 12.6 | 12.9 | 13.1 | ||||||||
| 7. | Double vision? | 23.5 | 10.0 | 10.2 | ||||||||
| 8. | Words move, jump, swim or float | 14.5 | 28.3 | 12.1 | 17.5 | |||||||
| 9. | Read slowly? | 23.1 | 10 | |||||||||
| 10. | Eyes hurt | 14.6 | 40.1 | 11.6 | 18.9 | 19.63 | ||||||
| 11. | Feel sore w | 41.2 | 15.7 | |||||||||
| 12. | “Pulling” | 10.6 | 13.9 | |||||||||
| 13. | Words blurring | |||||||||||
| 14. | Lose your place | 24.15 | 10.1 | 10.25 | 14.7 | |||||||
| 15 | Re-read the same line of word | |||||||||||
Blank spaces imply no significant association with symptoms. Accommodative facility is associated with most symptoms.
| Symptoms | Accommodation measures | Vergence measures | ||||||||||
|---|---|---|---|---|---|---|---|---|---|---|---|---|
| AA(binocular) | AF ± 2 Bin | AR | NRA | PRA | NPC (break) | Exophoria | Esophoria | Hyperphoria | NFV (break) | PFV (break) | ||
| 1. | Hold book too close | 24.8 | 16.2 | 16.2 | 18.4 | 11.71 | ||||||
| 2. | Hold book away | |||||||||||
| 3. | Blurry (not clear) | 12.2 | 12.9 | 15.2 | 9.0 | |||||||
| 4. | Feel dizzy | 15.38 | 31.8 | 16.9 | 9.7 | |||||||
| 5. | Eyes water | 22.9 | 12.6 | 11.7 | 11.46 | |||||||
| 6. | Chalkboard & back | 50.63 | 21.8 | 12.09 | 27.0 | 13.69 | ||||||
| 7. | Headaches after school? | 52.0 | 15.2 | 12.01 | 12.0 | 15.96 | ||||||
| 8. | Eye turn red | 16.6 | 35.2 | 13.9 | ||||||||
| 9. | Frown or “squeeze” face | 16.7 | 10.4 | 9.9 | ||||||||
Blank spaces imply no significant association with symptoms. Accommodative facility is associated with most symptoms.


