

To study the correlation between Stratus optical coherence tomography (OCT) and scanning laser polarimetry (GDx VCC) in measuring retinal nerve fiber layer (RNFL) thickness in eyes with early glaucoma (EG), ocular hypertension (OH), and glaucoma suspect (GS) in a Taiwan Chinese population.
MethodsOne eye each of 170 subjects (50 eyes with EG, 32 eyes with OH, 38 eyes with GS and 50 healthy eyes) was included. The RNFL thickness was measured by both technologies and three parameters (average, superior and inferior thickness) were correlated using the Pearson's correlation coefficient (r) in each group. Diagnostic capability of two instruments was evaluated in EG, OH and GS eyes based on the area under the receive operator characteristic (AROC) curve.
ResultsIn healthy and EG eyes, three RNFL parameters were significantly correlated. In OH eye, there was no significant correlation in three parameters. In GS eye, there was significant correlation in inferior thickness only. For healthy vs EG eye, the best parameter with largest AROC was nerve fiber indicator (0.798) for GDx VCC and average thickness (0.787) for OCT. The diagnostic capability of two techniques is poor in OH (AROC, 0.510–0.645) and GS eyes (AROC, 0.510–0.689).
ConclusionThe RNFL thickness measured by OCT and GDx VCC was well correlated in EG and healthy eyes but poorly correlated in OH and GS eyes. When managing the case with OH or GS eye, we should be cautious in interpreting different imaging data.
Estudiar la correlación entre la tomografía de coherencia óptica (OCT) Stratus y la polarimetría láser de barrido (GDx VCC) en la medición del espesor de la capa de fibras nerviosas de la retina (CFNR) en ojos con glaucoma temprano (GT), hipertensión ocular (HO) y sospecha de glaucoma (SG) en una población de chinos taiwaneses.
MétodosSe incluyeron 170 sujetos, un ojo de cada uno de ellos (50 ojos con GT, 32 ojos con HO, 38 ojos con SG y 50 ojos sanos). Se midió el espesor de la CFNR con ambas técnicas y se correlacionaron tres parámetros (espesor medio, superior e inferior) utilizando el coeficiente de correlación de Pearson (r) en cada grupo. Se evaluó la capacidad de diagnóstico de ambos instrumentos en ojos con GT, HO y SG basándose en el área bajo la curva de la característica operativa del receptor (AROC).
ResultadosEn ojos sanos y con GT, se correlacionaron de manera significativa tres parámetros de CFNR. En los ojos con HO, no hubo correlación significativa en tres parámetros. En ojos con SG, hubo correlación significativa únicamente en el espesor inferior. Para ojos sanos frente a GT, el mejor parámetro con la mayor AROC fue el indicador de fibras nerviosas (0,798) en GDx VCC y el espesor medio (0,787) en OCT. La capacidad de diagnóstico de ambas técnicas es baja para ojos con HO (AROC: 0,510–0,645) y SG (AROC: 0,510–0,689).
ConclusiónEl espesor de la CFNR medido por OCT y GDx VCC presentó una buena correlación en ojos con GT y sanos, pero muy baja en ojos con HO y SG. A la hora de tratar casos de ojos con HO o SG, deberemos ser prudentes al interpretar los diferentes datos de exploraciones por imagen.
Glaucoma is an ocular disease which causes progressive optic nerve fiber damage and leads to visual field loss1; therefore, early glaucoma detection is very important for early treatment.1–4 It has been demonstrated that structural damage to the optic nerve head (ONH) and peripapillary retinal nerve fiber layer (RNFL) might occur before any detectable functional visual loss.2–4 Therefore, detection of ONH and RNFL damage is crucial for early diagnosis of glaucoma.5–7 With the advancement of optical imaging technology, Stratus OCT (Carl Zeiss Meditec, Inc., Dublin, CA) and GDx VCC are very popular instruments in helping clinicians to understand the RNFL thickness in glaucoma management. However, different instrument designs have many limitations as far as we know; and the diagnostic capability in different stage of glaucoma disease and in different ethnic group varies among the studies.8–11 Furthermore, there are still few studies which aim to compare the RNFL thickness differences between OCT and GDx in early glaucoma (EG), ocular hypertensive (OH) or glaucoma suspect (GS) eyes to date.12–15 Therefore, in the current study, we aimed to compare the relationship between Stratus OCT and GDx VCC in RNFL thickness measurement in EG, OH and GS eyes in a Chinese population. In addition, the diagnostic ability of the two instruments in each group will be evaluated.
Subjects and methodsOne eye each of 170 subjects (50 eyes with EG, 32 eyes with OH and 38 eyes with GS and 50 healthy eyes) was included in the prospective cross-sectional study. All recruited cases were examined in the glaucoma service, department of Ophthalmology, China Medical University Hospital since January 2007 to December 2008. Informed consent was obtained from all participants, and the study was approved by the Institutional Review Board of the China Medical University Hospital. This research follows the tenets of the Declaration of Helsinki.
Subjects with a best-corrected visual acuity of less than 20/40, a spherical equivalent outside ±5.0 diopters, and a cylinder correction >3.0 diopters were excluded. All subjects underwent a complete ophthalmic examination, including slit lamp biomicroscopy, measurement of intraocular pressure, stereoscopic fundus examination and standard full threshold automated perimetry (30-2 mode, Humphrey Field Analyzer, Humphrey Instrument, Dublin, CA).
Inclusion criteria for healthy eye included no history of eye disease, no family history of glaucoma, intraocular pressure lower than 21mmHg when measured by Goldmann applanation tonometry, open angle on gonioscopy, and normal optic disk appearance based on clinical stereoscopic examination. A normal result on the glaucoma hemifield test and corrected pattern standard deviation (HFA, program 30-2) within normal limits were required. Subjects with healthy eyes were volunteers from the staff or their family members at the China Medical University Hospital.
Patients in the glaucoma group met the following criteria: at least one of their optic disks was glaucomatous in appearance with notching or thinning of the neuroretinal rim16; a corresponding nerve fiber bundle visual field defect, as described by Keltner et al.,17 with standard automated perimetry; gonioscopy revealed open angles. We defined EG eyes as having a mean deviation (MD) that was not as severe as −6dB on Humphrey Field Analyzer according to the criteria of Hodapp–Parrish–Anderson.18 GS eyes were defined as the presence of an abnormal disk consistent with glaucoma as determined by the same experienced glaucoma specialist along with a normal visual field. OH eyes were defined as subjects with intraocular pressure higher than 22mmHg, an open angle along with normal visual field.
Visual field testingAchromatic automated perimetry was performed by a Humphrey Field Analyzer (HFA; Humphrey-Zeiss Instruments) with a central full threshold visual field testing program 30-2. Visual field reliability criteria included fixation losses and false-positive and false-negative rates of less than 20%. The evaluation of glaucomatous visual field defects was made based on the following criteria: two or more contiguous points with a pattern deviation sensitivity loss of P<0.01, or three or more contiguous points with sensitivity loss of P<0.05 in the superior or inferior arcuate areas, or a 10-dB difference across the nasal horizontal midline at two or more adjacent locations and an abnormal result on the glaucoma hemifield test.19 Glaucoma stages were defined according to the criteria of Hodapp–Parrish–Anderson.18
Stratus OCT imagingThe Stratus OCT consisted of an infrared-sensitive video camera to provide a view of the scanning probe beam on the fundus, a low-coherence interferometer for light, a video monitor, a computer and an image analysis system. The OCT protocol in our study included regular 3.4mm circular scan to determine RNFL thickness. All scans were completed in a single session by a trained operator. The results were obtained from the mean of three scans. Quality assessment of Stratus OCT scans was determined by an experienced examiner masked to the subject's identity and the results of the other tests. Good quality scans had to have focused images from the ocular fundus, adequate signal-to-noise ratio and the presence of a centered circular ring around the optic disk. Patients with unacceptable Stratus OCT scans were excluded from further analysis.
SLP measurementsSLP measurements were obtained by the same trained and experienced technician. The images were analyzed with software version 5.5.0. And the software provided an image quality check score (1–10) to ensure accurate corneal measurement. In our study, the images had to be of high quality, i.e., a well focused, even, centered optic disk without any motion artifact. Besides, a score of 7 was the minimum standard for imaging quality.
Each subject received GDx VCC and Stratus OCT measurements on the same day. The perimetry and imaging examinations were all performed within a maximum period of 2 weeks.
Statistical analysesStatistical analyses were performed on a personal computer using SPSS (Ver.11.0; SPSS, Chicago, IL). Differences in age, refraction, mean deviation (MD), pattern standard deviation (PSD) and RNFL thickness parameters among groups were evaluated by ANOVA test. Tukey test was used to conduct for pairwise comparisons. The RNFL thickness measured by both technologies (average, superior and inferior thickness) was correlated using the Pearson's correlation coefficient (r) in each group. P-value less than 0.05 was considered to be statistically significant.
The area under the receiver operating characteristic (AROC) curve was used to assess the ability of each parameter to differentiate healthy from EG, OH, and GS eyes (MedCal software, version 9.2).
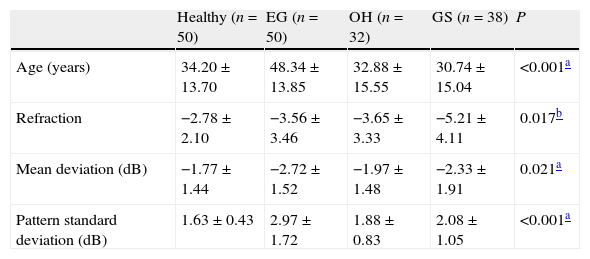
ResultsDemographic dataThe study population characteristics are summarized in Table 1. There was a statistically significant difference in age, refraction status, MD and PSD among groups.
Demography of the study population.
| Healthy (n=50) | EG (n=50) | OH (n=32) | GS (n=38) | P | |
| Age (years) | 34.20±13.70 | 48.34±13.85 | 32.88±15.55 | 30.74±15.04 | <0.001a |
| Refraction | −2.78±2.10 | −3.56±3.46 | −3.65±3.33 | −5.21±4.11 | 0.017b |
| Mean deviation (dB) | −1.77±1.44 | −2.72±1.52 | −1.97±1.48 | −2.33±1.91 | 0.021a |
| Pattern standard deviation (dB) | 1.63±0.43 | 2.97±1.72 | 1.88±0.83 | 2.08±1.05 | <0.001a |
EG: early glaucoma; OH: ocular hypertension; GS: glaucoma suspect.
Tukey test was used to conduct for pairwise comparisons.
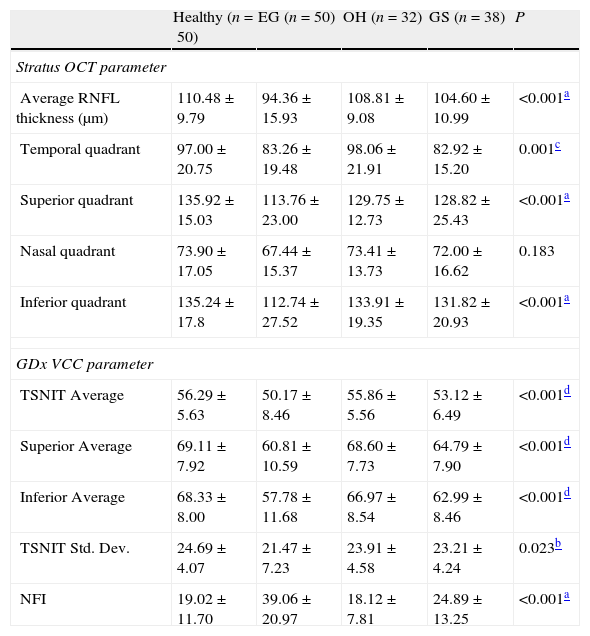
Table 2 shows the RNFL thickness parameters measured by Stratus OCT parameters and GDx VCC in each group. For Stratus OCT measurement, there were significant differences among groups in average, temporal quadrant, superior quadrant, and inferior quadrant thickness. For GDx VCC measurement, there was significant difference among groups in TSNIT (temporal–superior–nasal–inferior–temporal) average thickness, superior quadrant thickness, inferior quadrant thickness and NFI (nerve fiber indicator).
Measured RNFL thickness using Stratus OCT and GDx VCC in each group.
| Healthy (n=50) | EG (n=50) | OH (n=32) | GS (n=38) | P | |
| Stratus OCT parameter | |||||
| Average RNFL thickness (μm) | 110.48±9.79 | 94.36±15.93 | 108.81±9.08 | 104.60±10.99 | <0.001a |
| Temporal quadrant | 97.00±20.75 | 83.26±19.48 | 98.06±21.91 | 82.92±15.20 | 0.001c |
| Superior quadrant | 135.92±15.03 | 113.76±23.00 | 129.75±12.73 | 128.82±25.43 | <0.001a |
| Nasal quadrant | 73.90±17.05 | 67.44±15.37 | 73.41±13.73 | 72.00±16.62 | 0.183 |
| Inferior quadrant | 135.24±17.8 | 112.74±27.52 | 133.91±19.35 | 131.82±20.93 | <0.001a |
| GDx VCC parameter | |||||
| TSNIT Average | 56.29±5.63 | 50.17±8.46 | 55.86±5.56 | 53.12±6.49 | <0.001d |
| Superior Average | 69.11±7.92 | 60.81±10.59 | 68.60±7.73 | 64.79±7.90 | <0.001d |
| Inferior Average | 68.33±8.00 | 57.78±11.68 | 66.97±8.54 | 62.99±8.46 | <0.001d |
| TSNIT Std. Dev. | 24.69±4.07 | 21.47±7.23 | 23.91±4.58 | 23.21±4.24 | 0.023b |
| NFI | 19.02±11.70 | 39.06±20.97 | 18.12±7.81 | 24.89±13.25 | <0.001a |
Tukey test was used to conduct for pairwise comparisons.
TSNIT: temporal–superior–nasal–inferior–temporal; NFI: nerve fiber indicator.
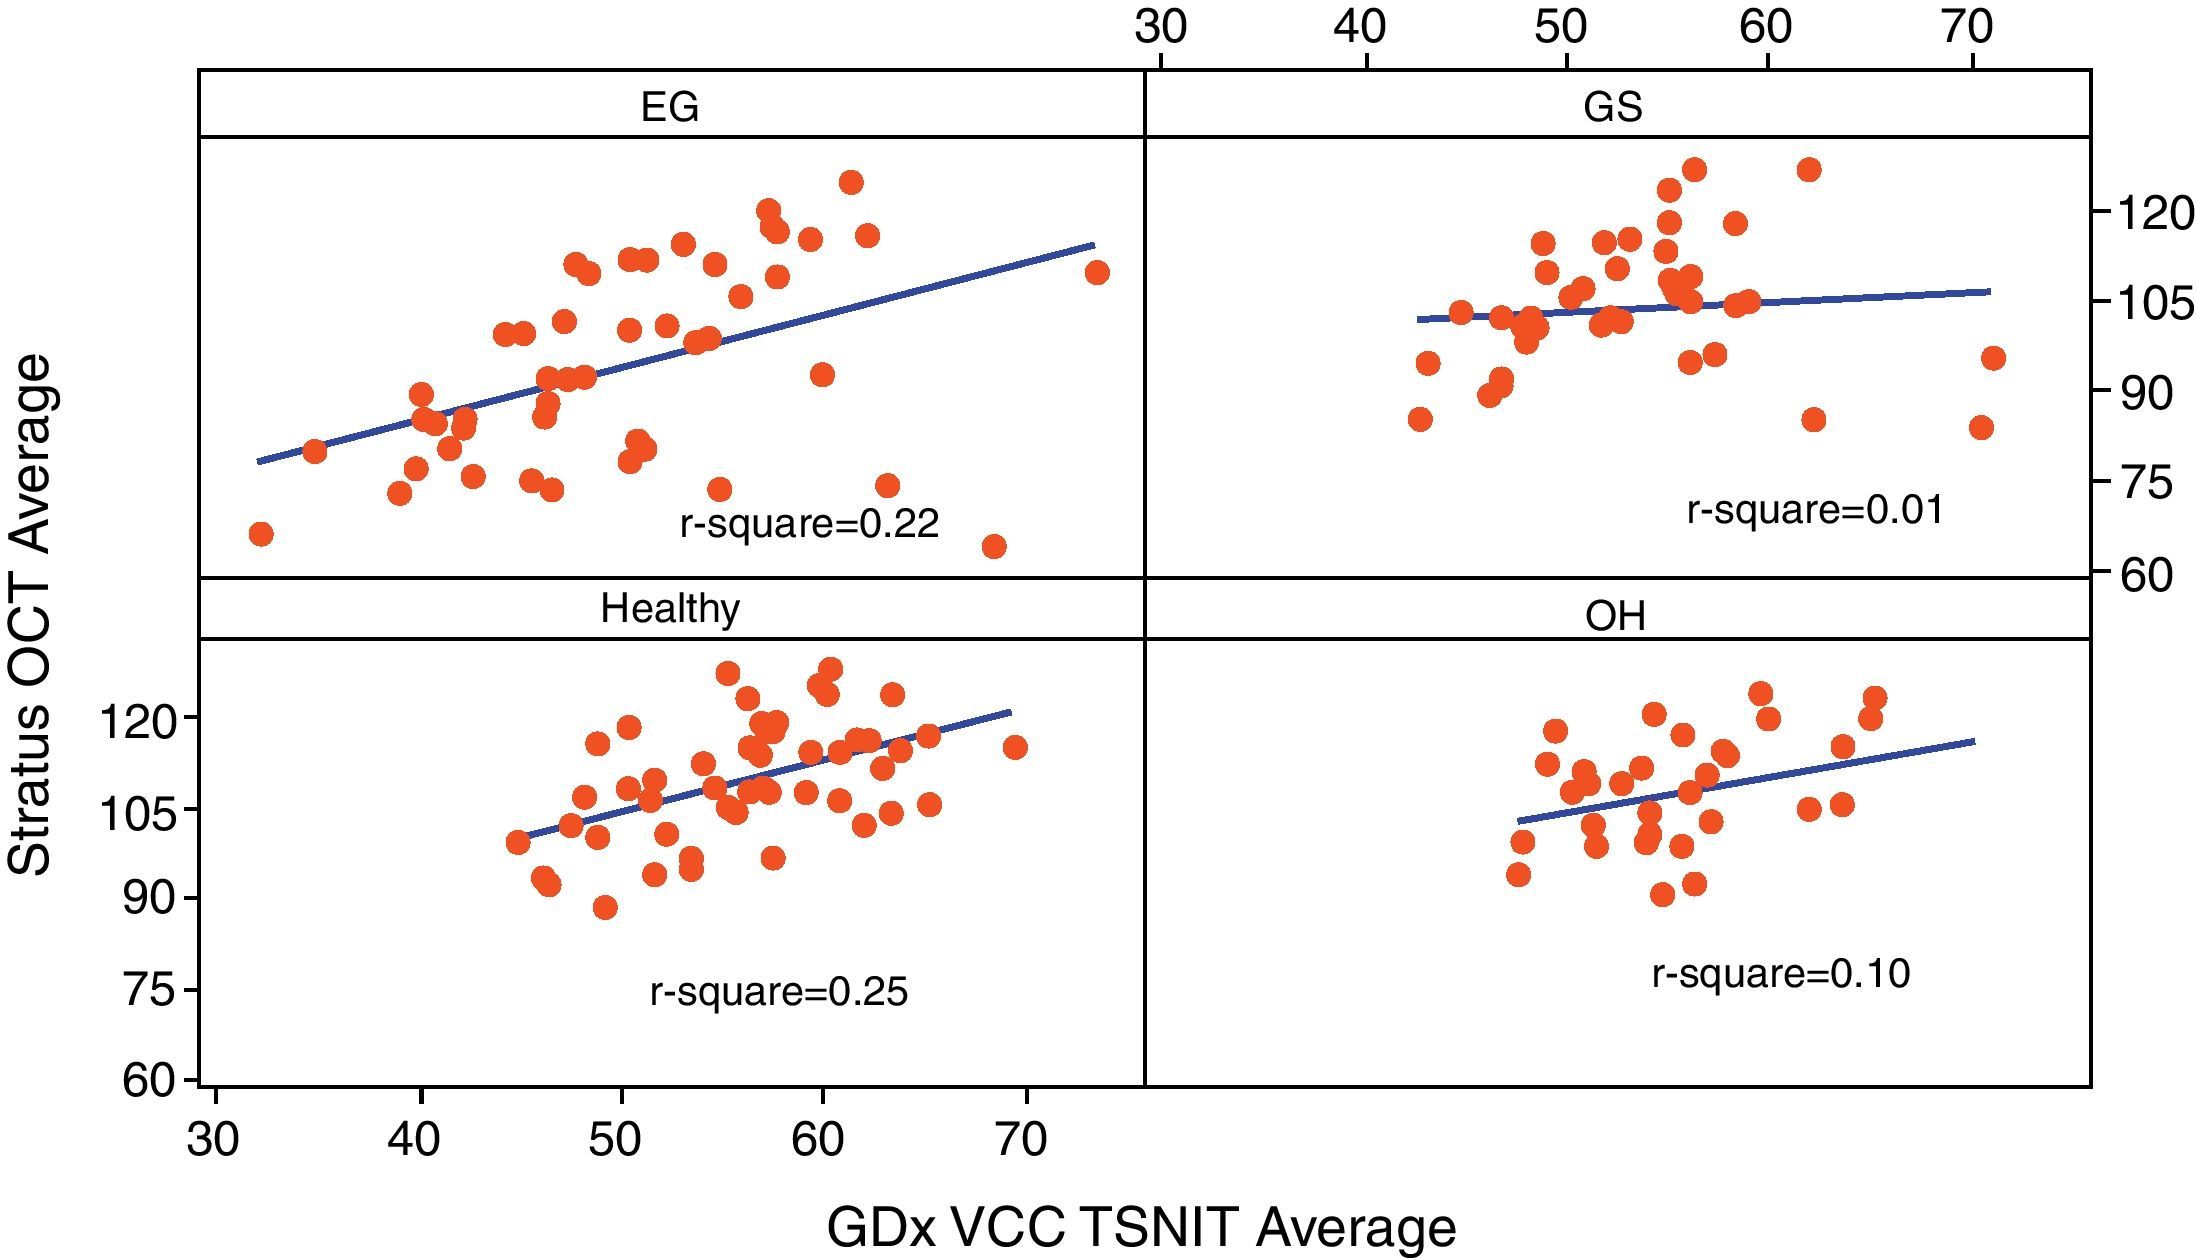
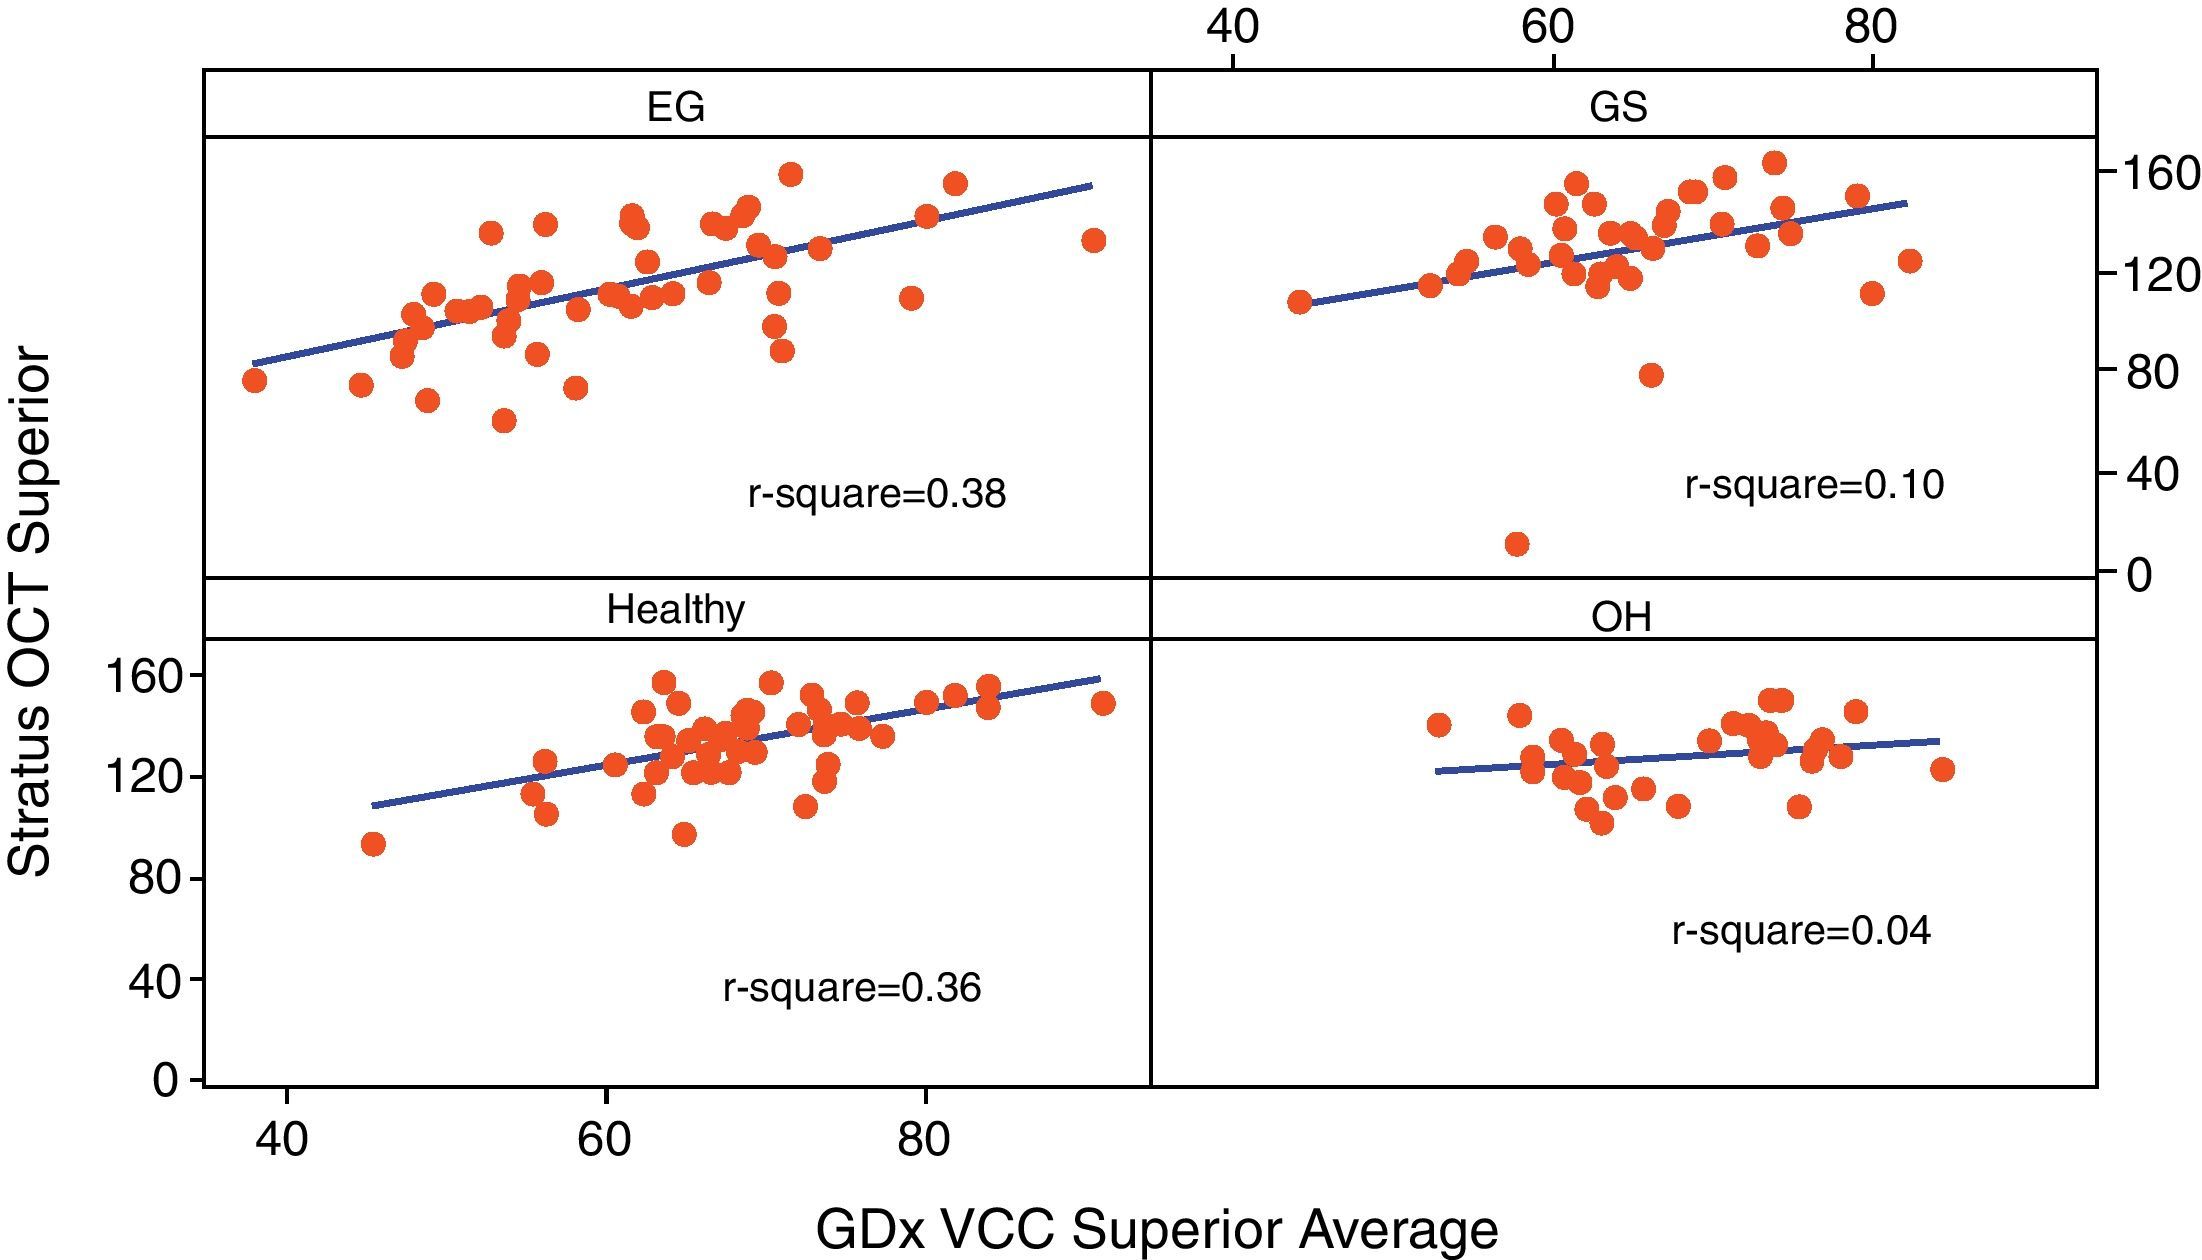
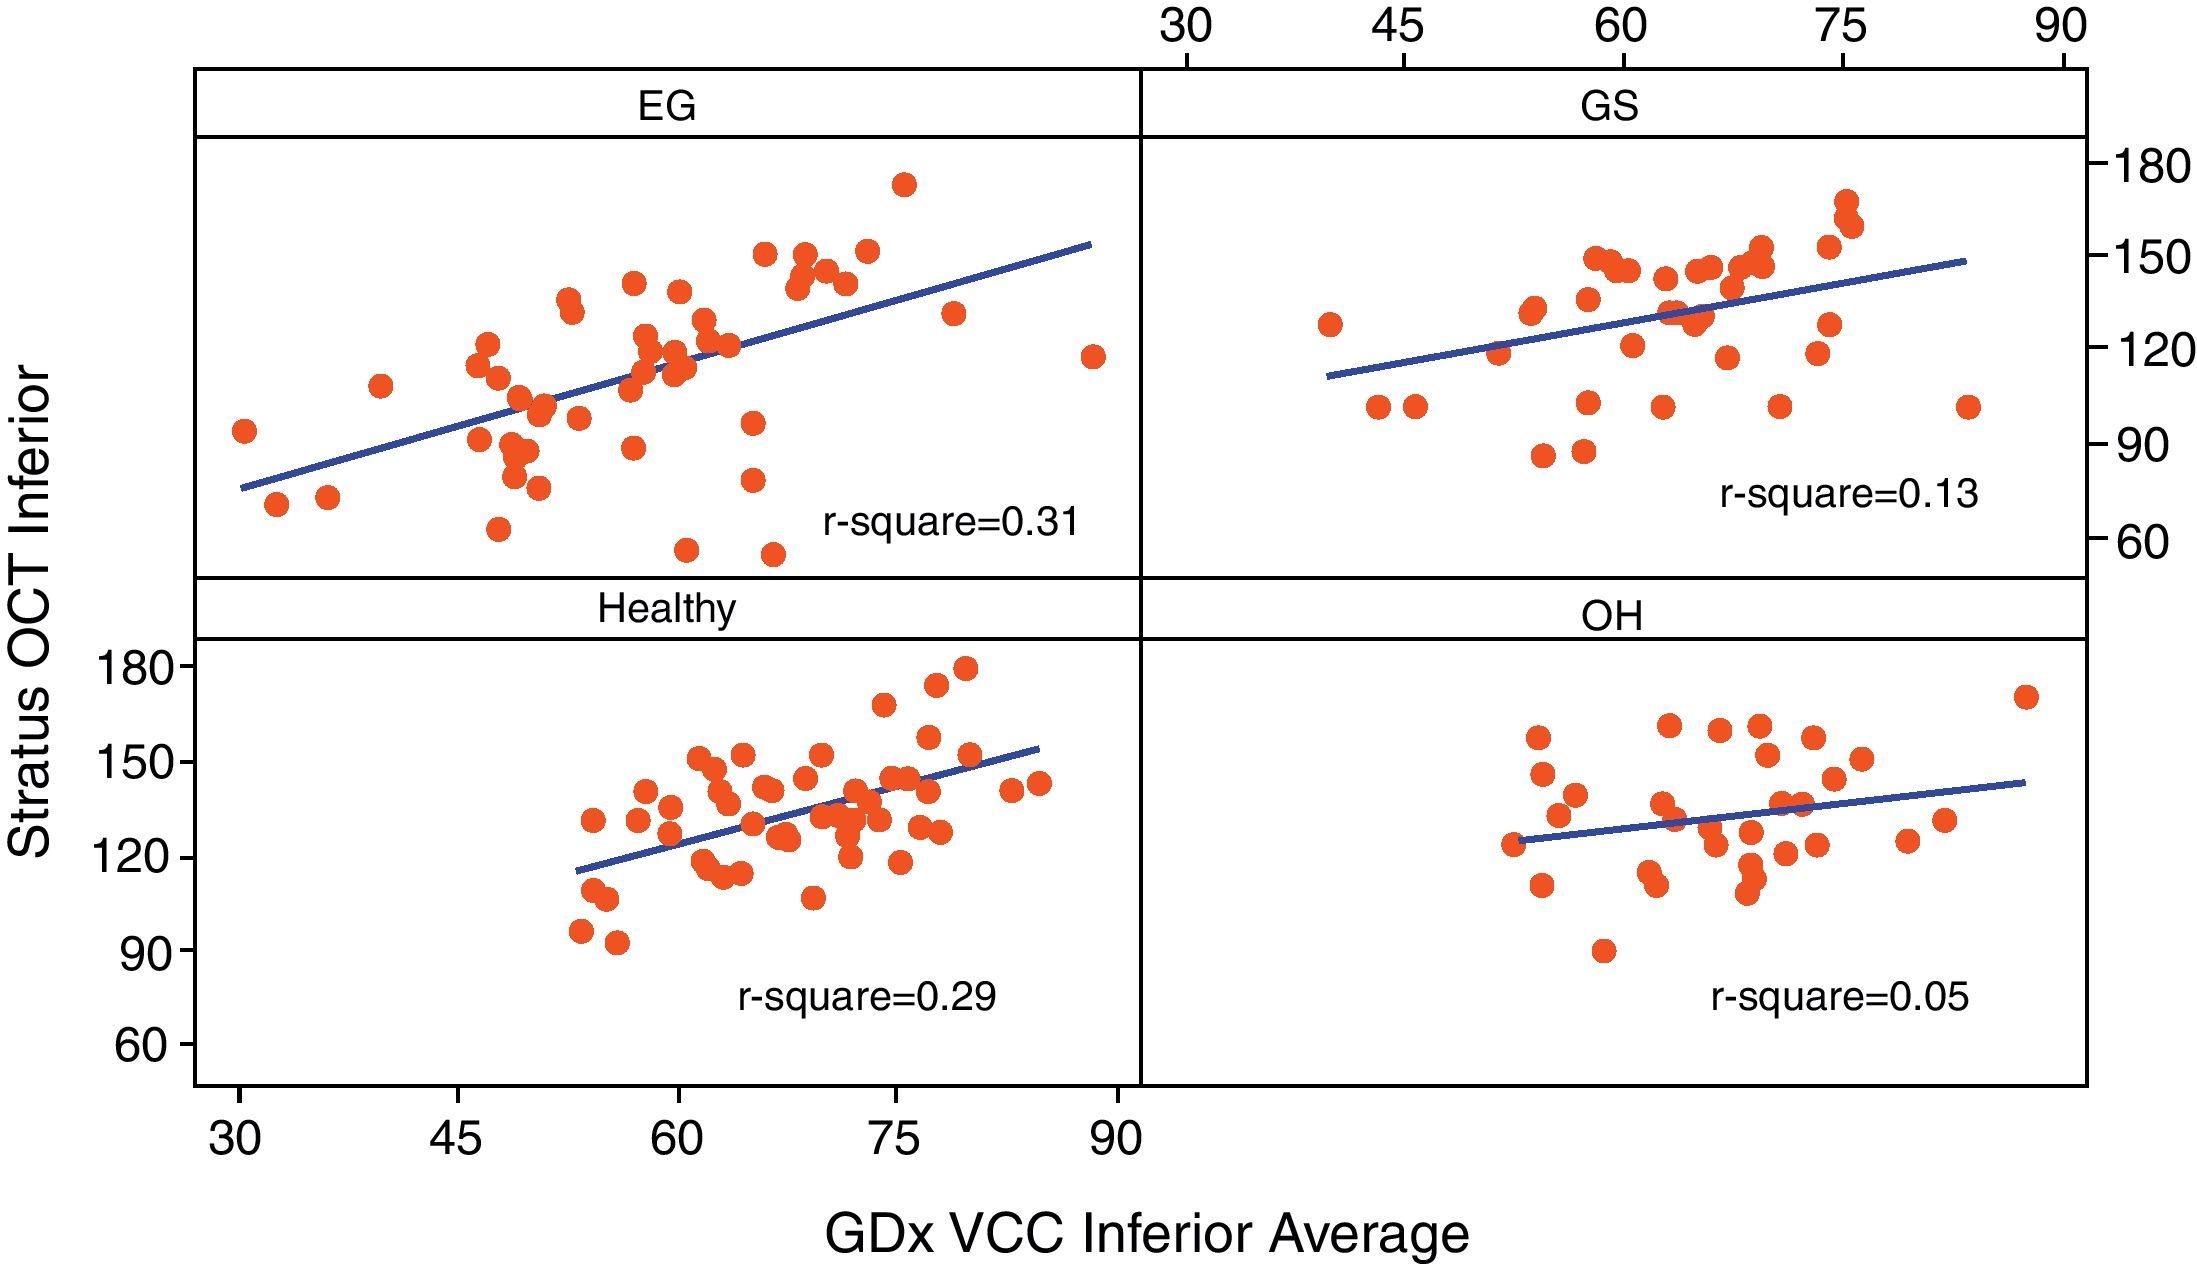
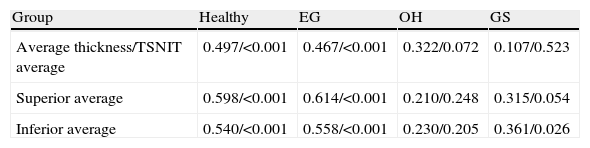
Table 3 reports the correlation of three RNFL thickness parameters between the two machines in each group. In healthy group, three parameters were found to be significantly correlated (Stratus average thickness/GDx VCC-TSNIT-average, r=0.497; Stratus OCT-superior quadrant/GDx VCC-superior average, r=0.598; and Stratus OCT-inferior quadrant/GDx VCC-inferior average, r=0.540). In EG group, three parameters were found to be significantly correlated (P<0.005) (Stratus average thickness/GDx VCC-TSNIT-average, r=0.467; Stratus OCT-superior quadrant/GDx VCC-superior average, r=0.614; and Stratus OCT-inferior quadrant/GDx VCC-inferior average, r=0.558). In OH group, there was no significant correlation in the three parameters. In GS group, there was significant correlation only in GDx VCC-inferior average/Stratus OCT-inferior quadrant (r=0.361). Scatterplot of Stratus OCT thickness vs GDx VCC thickness is shown as Figs. 1 (average thickness), 2 (superior thickness) and 3 (inferior thickness).
Relationship of Stratus OCT/GDx VCC of three RNFL thickness parameters in each group.
| Group | Healthy | EG | OH | GS |
| Average thickness/TSNIT average | 0.497/<0.001 | 0.467/<0.001 | 0.322/0.072 | 0.107/0.523 |
| Superior average | 0.598/<0.001 | 0.614/<0.001 | 0.210/0.248 | 0.315/0.054 |
| Inferior average | 0.540/<0.001 | 0.558/<0.001 | 0.230/0.205 | 0.361/0.026 |
Note: Values are r/P-value.
r: Pearson's correlation coefficient.
 average thickness.")


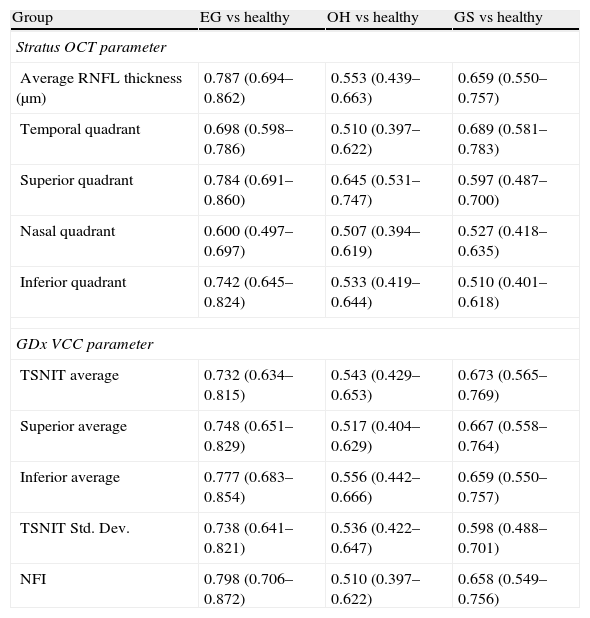
Table 4 shows the diagnostic performance of two machines in each group. For healthy vs EG, the best parameter with largest AROC was NFI (AROC, 0.798) for GDx VCC and average thickness (AROC, 0.787) for OCT. The diagnostic capability of two techniques is poor in OH and GS group (OH vs healthy, AROC, 0.510–0.645; GS vs healthy, AROC, 0.510–0.689).
AROC of some RNFL parameters of Stratus OCT and GDx VCC in differentiating EG, OH, and GS from normal group respectively.
| Group | EG vs healthy | OH vs healthy | GS vs healthy |
| Stratus OCT parameter | |||
| Average RNFL thickness (μm) | 0.787 (0.694–0.862) | 0.553 (0.439–0.663) | 0.659 (0.550–0.757) |
| Temporal quadrant | 0.698 (0.598–0.786) | 0.510 (0.397–0.622) | 0.689 (0.581–0.783) |
| Superior quadrant | 0.784 (0.691–0.860) | 0.645 (0.531–0.747) | 0.597 (0.487–0.700) |
| Nasal quadrant | 0.600 (0.497–0.697) | 0.507 (0.394–0.619) | 0.527 (0.418–0.635) |
| Inferior quadrant | 0.742 (0.645–0.824) | 0.533 (0.419–0.644) | 0.510 (0.401–0.618) |
| GDx VCC parameter | |||
| TSNIT average | 0.732 (0.634–0.815) | 0.543 (0.429–0.653) | 0.673 (0.565–0.769) |
| Superior average | 0.748 (0.651–0.829) | 0.517 (0.404–0.629) | 0.667 (0.558–0.764) |
| Inferior average | 0.777 (0.683–0.854) | 0.556 (0.442–0.666) | 0.659 (0.550–0.757) |
| TSNIT Std. Dev. | 0.738 (0.641–0.821) | 0.536 (0.422–0.647) | 0.598 (0.488–0.701) |
| NFI | 0.798 (0.706–0.872) | 0.510 (0.397–0.622) | 0.658 (0.549–0.756) |
AROC: area under the receiver operating characteristics curve.
Previous studies reported good diagnostic accuracy in glaucoma detection with different imaging machines.8,9,11,20–22 Some studies evaluated and compared the diagnostic power between Stratus OCT and GDx VCC in different stages of glaucoma.12–15 In one recent study by Zarei et al., they reported that many GDx VCC parameters were significantly correlated with those of the OCT in patients with juvenile glaucoma23 (r: 0.80 for average thickness; 0.86 for superior thickness; 0.75 for inferior thickness). In their study, the glaucomatous eyes had VF loss of −6.04±2.76dB (MD) and 5.59±3.17dB (PSD).23 In another study by Leung et al.,24 they reported that significant correlations were observed between Stratus OCT and GDx VCC RNFL measurements (average RNFL thickness, r: 0.852). In their glaucoma and glaucoma suspect group, the visual field severity is around −7.80±7.86dB. Compared to other studies, our result shows that GS group and OH group were not well correlated in RNFL thickness measured by the Stratus OCT and GDx VCC, and the diagnostic capability was quite poor in differentiating healthy from OH or GS eyes. Possible reasons might come from different scanning technique from the design of two machines themselves,25 different study population and with very mild visual field severity in our OH and GS groups.
The role of OCT and GDx in early stage glaucoma diagnosis has been well reported.1,5,13,26 Here we again report that the best parameter with largest AROC was nerve fiber indicator (AROC, 0.798) for GDx VCC and average thickness (AROC, 0.787) for OCT in differentiating healthy from EG group. Similar reports also agree that Stratus OCT and GDx VCC has moderate sensitivity with high specificity for the early glaucoma detection.18,19,26,27 However, the diagnostic capability of two techniques is quite poor in OH and GS group from our result (OH vs healthy, AROC, 0.510–0.645; GS vs healthy, AROC, 0.510–0.689). We think that the result also implies the truth that the role of the two imaging machines in OH or GS group at the current stage is still uncertain because the concept of structural damage might precede functional damage in glaucoma is still a controversy.28 But the RNFL thickness measurement by these two machines could be used as a tool for follow-up of OH or GS group in real practice is well accepted.29
There are still some limitations in this cross-sectional study. First, entry bias comes from the selection of study cohort. For example, one recent study reported that RNFL analysis by OCT is more suitable for the glaucoma assessment in the tilted disk compared with GDx-VCC.30 Furthermore, due to the strict criteria of imaging data, we might delete any case with poor imaging signal, which might influence the outcome. Second, the visual field criteria that we used in this study are the ones proposed by Hodapp–Parrish–Anderson18 and Caprioli et al.,19 To avoid the bias coming from visual field interpretation in very early stage of glaucoma, all the study participants were strictly evaluated by the same Dr. (Chen HY). Although we have tried to reduce the bias in disease grouping, this is an inevitable problem in this kind of imaging studies. At last, comparisons across studies are difficult, because of differences in population demographics, the definition and severity of glaucoma. However, the results can be used as the basis for further improving the diagnostic accuracy of glaucoma in the Chinese population in the near future.
In summary, the diagnostic ability of Stratus OCT and GDx VCC was moderate in early glaucoma detection; RNFL thickness measurement was highly correlated between the two machines in early glaucomatous eyes. The role of imaging machine in evaluating OH or GS eye needs to be addressed in the future. When managing the case with OH or GS eye at the current stage, we should be more cautious in interpreting the different imaging data from the two machines.
Ethical responsibilitiesThis research follows the tenets of the Declaration of Helsinki. Informed consent was obtained from all participants, and the study was approved by the Institutional Review Board of the CMUH.
Conflict of interestsThe authors have no conflict of interests to declare.
The authors would like to thank for the financial support under contract nos. NSC-97-2628-E-167-001-MY3 and DMR-101-077.
Presented in part at: World Glaucoma Congress, June 2009, Boston, USA.


