


Phoria measurements form a routine part of the examination of binocular vision. Various studies have compared different methods of phoria measurement and their repeatability between sessions. However, no studies have accounted for within-session repeatability, and few norms have been available to date. Our aims were to assess the short-term within-session repeatability, the agreement and the comparisons between three phoria tests and the delineation of normative data.
MethodThe participants comprised 315 refractive corrected participants with a normal binocular vision, with ages between 20 and 80 years. Phoria was measured using three methods: von Graefe (VG), modified Thorington (MT) and Thorighton (TH) procedures. Each measurement was taken 3 consecutive times at far and near.
ResultsThe repeatability between measurements was high (0.87 to 0.96), but the relationship between tests was medium (0.407 to 0.682). About the mean bias, VG show more exo values (0.02 to 0.14 at far and 0.07 to 0.14 at near) and MT and TH similar values (−0.04 to 0.08 at far and −0.1 to 0.03 at near). The best agreement between tests was for TH and MT (LoA = 2.33 at far and LoA = 4.44 at near). Normative data for non-presbyopic were provided.
ConclusionOverall, there is a high agreement between MT and TH. Conversely, VG shows more exo values at near and shows large limits of agreement. We recommend that subjective measurements of phoria can best be quantified once using the MT or TH techniques in free space and the values compared with updated norms.
During a clinical evaluation of the visual system, several areas required investigation and some guidelines were developed in order to aid in the checking of all these areas.1–3 During a diagnostic testing routine, it is important to evaluate and diagnose accommodative, ocular motor, and non-strabismic binocular vision problems.4 One of the steps in the evaluation of binocular vision disorders is the measurement of the phoria (or eterophoria), both at distance (3 m) and at near (40 cm). Phoria is defined as a “misalignment in the horizontal, vertical, or cyclo-direction that is corrected or correctable by disparity vergence”.5
Several tests and procedures are available to clinicians for the subjective measurement of phoria, such as the estimated cover test, the cover test with prisms (subjective and objective), the Von Graefe technique (continuous and flash presentation), the Maddox rod, the Thorington and the modified Thorington (continuous and flash presentation).6–10 These tests, which are sometimes applied under different names, have some common features but they mostly differ in some form or another. All of them may be used in clinical practice. However, the usefulness of a tests needs to be determined not subjectively by clinicians but by using objective scientific criteria such as validity, repeatability, available expected values or norms, and other measurement parameters.11,12
In the past, several studies have taken into account reliability, repeatability and the agreement between different phoria tests.8,13–17 Three main comparisons have generally been made: between test, between session, between examiner.
Some groups of studies have primarily taken into account the inter-rater reliability, showing that the modified Thorington (MT) and the Thorington (TH) test present the highest correlation between examiners and the smallest limits of agreement (LoA).7,8,14 when compared with the Von Graefe (VG) and Cover Test 17,18 Apart from that, the repeatability of phoria measurement was usually higher than 0.90 (correlation coefficient) for test-retest evaluation. Conversely, the relationship between different tests was not as high, with a large variation between studies when different procedures were used.7 With respect to the agreement between measurements, the Thorington and the modified Thorington (MT) techniques were the tests with lower differences, and the Von Graefe (VG) test produced more exo-values and high variations compared to other tests for the poor control of accommodation and its specific methodology of administration.13
However, in order to perform a comparison and to obtain a stable value of phoria, different studies break binocularity for long periods of time. Frequently, a 5-min period of monocular occlusion was used to allow the dissipation of disparity vergence.16,20,21 This procedure appears attractive, but the clinical relevance of phoria measurement was compromised because the length of the time that binocular vision was broken directly affects the measurement.13 This method was useful for pure research purposes, excluding vergence adaptation, but it does not give valid results for clinical purposes because this condition is not ecologic.
Different phoria tests give different results for their specific accommodative control,22 procedure and dissociation methods. Coherently, each method should require specific norms,23 but few norms are available.9 Well-established norms require the best-corrected refraction to be used. In actual fact, some cited studies have used habitual correction that does not permit the results to be generalised as normative. The control of accommodation under best-corrected refraction is required for the testing of binocular vision to define normative data.8,16
In some of the studies that have been mentioned, for experimental purposes and to improve the reliability, each measurement was made typically three times.24 However, the question must be asked as to whether this measurement is important under the day-to-day working conditions encountered in the clinic? Coherently, with this observation, the main question that we want to answer in this study is, “Is it necessary to measure phoria at different times during a routine clinical examination?” This could be referred to as “within-session repeatability”. This is different from the classic between-session test-retest repeatability after between 24 and 48 h.16 The repeatability within session has its importance because it represents the first source of variability of measurement without any changes and also provides the baseline for the study of variability between sessions. To our knowledge, the within session repeatability has never been taken into account in phoria measurement.
Consequently, we have aimed to evaluate the short-term within-session (between measurement) repeatability, and also to consider three methods of phoria measurement using a new and robust statistical approach. Moreover, we have aimed to define normative data for each test.
Material and methodsSubjectsA total of 331 participants were initially enrolled in the study. The inclusion criteria were: the presence of normal binocular vision assessed by cover test, the absence of ocular pathology reported by the participants or by signs and symptoms observed by examiners, no use of medication or the presence of a disease that could affect accommodation and/or binocular vision, no history of refractive surgery, strabismus or amblyopia, a best corrected visual acuity (BCVA) equal to or greater than to +0.1logMAR in each eye at distance using a Sloan logMAR chart.25
The exclusion criteria were the presence of phoria values that exceeded the range of TH/MT cards (+/−4Δ at far and +10/−15Δ at near). A total of 16 participants did not meet the inclusion criteria (11 fell outside the range of the TH/MT cards at far, and 5 presented a monocular VA lower than +0.1logMAR) and were consequently excluded. Therefore, 315 participants took part in the study. The mean age was 33.4 years, SD 13.6, range 18−80. There were 85 (i.e. 25.7%) participants over 40 years of age. Based on the same criteria, participants were split into two groups of non-presbyopic (NP, 231 participants, age 18–40) and presbyopic (P, 84 participants, age 41–80). The study was carried out in accordance with the guidelines given in the Declaration of Helsinki and the participants gave their written consent to participate in the study.
TestsVonGraefe (VG)The phoropter and Risley rotary prisms were only used for this procedure. For the measurements at far (3 m), the distance refractive prescription was used. A 6Δ base-up prism was placed in front of the right eye and a 10Δ base-in was placed in front of left. The projected target was a vertical column of letters with a size of +0.2 LogMAR. For the measurements at near (40 cm), a 9Δ prism was placed base-up in front of the right eye and a 15Δ was placed base in in front of the left, together with the appropriate refractive correction. A 40 cm reduced-size Snellen table was used as a target. For both measurements, the participants were instructed to fixate the upper image and to keep the letter clear. The horizontal prism was reduced up to the two targets which were aligned (at about 1.0−1.5Δ for one second). The amount of prism used was recorded as the phoria value.
Modified Thorington (MT)In order to produce comparable conditions between this and the subsequent Thorington method, a similar target was used. Black-and-white phoria cards equivalent to those used for the Thorington method were used for far and near measurements. In each card, a small central hole was made so that a thin LED light could be inserted. Measurements were made at 3 m and at 40 cm. For these measurements, the relative distance prescription was placed into the trial frame, together with a multiple Maddox red cylinder. The participants were instructed to fixate the card, to keep the numbers clear and to report the number and the direction (left/right) that correspond to the red vertical line compared to the light. The number, according to the direction was recorded as the phoria value.
Thorigton (TH)Participants viewed the Facchin Phoria Card (COI vision, Milano, Italy), which is based on the Thorington technique.8 Two cards were used: one for 3 m (far) and one for 40 cm (near) distances. The specific prescription was placed into the trial frame. The participants were asked to look at the single “coloured row of numbers with an arrow”. At this point, a 6Δ base-up prism was inserted in front of the right eye and the participants were asked, “Can you see two rows of numbers? The arrow for the upper row indicates a number in the lower row. Which number is it? What colour is it?” According to the construction, light blue values corresponded to exo- and pink to eso- values. The value reported by participants was recorded as the phoria value. The same procedure was applied at near.
ProcedureIndependently of their habitual correction, for testing purposes, all participants were refractive correct at distance. At near, the addition for presbyopic patients was calculated taking into account their age26 and by balancing positive and negative relative accommodation.5 The testing order (far and near) and test sequence (VG, MT, TH) were balanced across participants.
The participants first gave their written consent to participation in the study and the general procedure was explained to them. Subsequently, the best subjective refractive corrections at distance and at near were assessed. Phoria measurement started at near or at far depending on balancing. The first test administered therefore also depended on the sequence of test used. Three measurements for each test were taken in sequence and normal binocular vision was re-established between each measurement. After three measurements for the first test using the same procedure, the second and the third tests were performed. Subsequently, the same procedure was replicated for the other distance. The whole procedure comprised a total of 18 measurements. In order to obtain a large sample of participants with different ages and to avoid the influence of a single examiner, the whole procedure was applied by eight examiners in their offices.
Statistical analysesThe different terms used in studies of the measurement properties of tests have at times been confused. In this study, in order to avoid confusion, we have used the term “repeatability” for test-retest correlation comparisons between measurement, “agreement between measurement” for the estimation of bias and the limits of agreement between the three measurements. Furthermore, we have also used the term “relationship between tests” for the correlation between tests (at first measurement) and “agreement between tests” for calculation of bias and LoA between tests (at first measurement). For each analysis, the results for the far and near tests have been discussed independently. For repeatability and convergence between tests, the Intraclass Correlation Coefficient (ICC) selected27 is the two-way model single score ICC [ICC(A,1)].28 The interpretation of correlation coefficients was based on five steps, each of 0.2 points between 0 and 1, with the respective subdivision: low, low to moderate, moderate, moderate to high and high.29–31 Since there is evidence for differences between non-presbyopic (NP) and presbyopic (P) in the agreement of tests of phoria measurement,24 this between-participants factor was taken into account during the analyses.
In order to evaluate agreement, two analyses were performed. The first was focused on bias. Since the results were expressed as a combination of the mean values between measurements and tests, we have reported the results of both frequentist and Bayesian repeated measure ANOVA.32 Modern Bayesian methods and procedures provide richer information compared to the Null-hypothesis significance testing (NHST).33 Bayesian analyses overcome the problems of p-value using a modern approach. Specifically, one advantage related to our aim is to quantify the evidence for the null hypothesis (similar tests result) compared to the whole resource used (number of participants).34 A Bayes factor (BF10) of <0.33 was interpreted as positive evidence for H0 and one of >3.0 as positive evidence for H134–36 Secondly, the Bland and Altman limits of agreement (LoA) were calculated and the plotted graphically. Bland-Altman limits of agreement (LoA; 1.96*SD) provide the mean value and the range of differences between the test and re-test or between different measurements.37,38 In order to compare tests and/or measurements, the LoA coefficients were compared. LoA corresponds perfectly to the previously named coefficient of reliability39 and coefficient of repeatability14 used in other studies. Finally, a series of tests was performed to assess the normality of the data and their deviation from zero, and hence define parametric and/or non-parametric normative data. As standard practice, esophoria values were reported with a positive sign (+) and the exophoria values with a negative sign (−). Data were analysed and represented using the R statistical environment and JASP.40,41
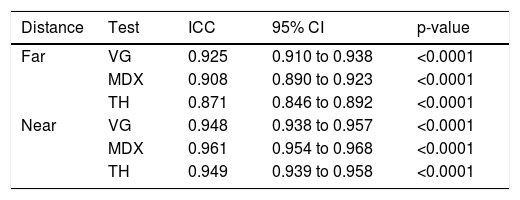
ResultsRepeatabilityThe ICC scores produced by the three measurements for the three tests at far and near are reported in Table 1. These showed high values. The VG showed a high degree of correlation for a wide range of values compared to the other tests. In fact, the other two tests were limited in the range between +4/−4Δ. In addition, at near the three tests present a high degree of correlation for the three measurements examined. No significant differences between non-presbyopic (NP) and presbyopic (P) participants were found.
Intraclass Correlation Coefficients (ICC) between the three sessions of testing for the two distance of test separately.
| Distance | Test | ICC | 95% CI | p-value |
|---|---|---|---|---|
| Far | VG | 0.925 | 0.910 to 0.938 | <0.0001 |
| MDX | 0.908 | 0.890 to 0.923 | <0.0001 | |
| TH | 0.871 | 0.846 to 0.892 | <0.0001 | |
| Near | VG | 0.948 | 0.938 to 0.957 | <0.0001 |
| MDX | 0.961 | 0.954 to 0.968 | <0.0001 | |
| TH | 0.949 | 0.939 to 0.958 | <0.0001 |
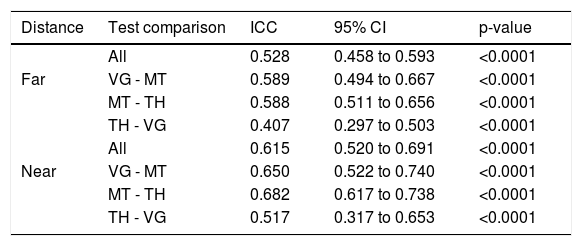
Firstly, we tested the relationship between all tests for far and near vision. Data are reported in Table 2. From these results there emerges a medium relationship between tests at far, and a medium to high correlation at near. However, these results are comprehensive and they cannot provide information on the specific comparison between tests. In order to accomplish this, the previous analyses between three tests were split into three comparisons between two tests. The results generally showed medium values, with the highest correlations between MT and TH. No significant differences between non-presbyopic (NP) and presbyopic (P) participants were found.
Intraclass correlation coefficients between the three tests for the two distance separately.
| Distance | Test comparison | ICC | 95% CI | p-value |
|---|---|---|---|---|
| All | 0.528 | 0.458 to 0.593 | <0.0001 | |
| Far | VG - MT | 0.589 | 0.494 to 0.667 | <0.0001 |
| MT - TH | 0.588 | 0.511 to 0.656 | <0.0001 | |
| TH - VG | 0.407 | 0.297 to 0.503 | <0.0001 | |
| All | 0.615 | 0.520 to 0.691 | <0.0001 | |
| Near | VG - MT | 0.650 | 0.522 to 0.740 | <0.0001 |
| MT - TH | 0.682 | 0.617 to 0.738 | <0.0001 | |
| TH - VG | 0.517 | 0.317 to 0.653 | <0.0001 |
Since the bias can be calculated between measurements tests and groups, and these three factors could interact, a unique factorial approach of analysis was primarily used. For far measurements, a repeated measure analysis of variance was performed using two within factors and one between factor: Test with three levels (VG, MT, TH), Measurement with three levels (M1, M2, M3) and Group with two levels (NP, P). Bayesian analysis was performed using the same approach.
The results at far showed a significant effect of Test [F(2,626) = 5.57, p < 0.005, η²p = 0.02, BF10 = 6.20E+20], a significant effect of Measurement [F(2,626) = 14.96, p < 0.0001, η²p = 0.05, BF10 = 0.02], a significant effect of Group [F(1,313) = 6.69, p < 0.05, η²p = 0.02, BF10 = 3.93], a significant interaction Test × Group [F(2,626) = 29.45, p < 0.0001, η²p = 0.03, BF10 = 2.36E+21], a significant interaction Measurement × Group [F(2,626) = 9.76, p < 0.0001, η²p = 0.03, BF10 = 0.08], a significant interaction Test × Group [F(2,626) = 29.45, p < 0.0001, η²p = 0.03, BF10 = 2.19E+34], a significant interaction between Test and Measurement [F(4,1252) = 5.75, p < 0.0001, η²p = 0.02, BF10 = 2.59E+16] and a significant triple interaction Test × Measurement × Group [F(4,1252) = 4.42, p < 0.005, η²p = 0.01, BF10 = 5.62E+19].
In order to show the differences in each test between measurements better, a series of one-way ANOVA was performed for each test using the factor Measurement with three levels (M1, M2 and M3). The results for non-presbyopic show a non-significant effect for VG (p = 0.57, BF10 = 0.03), MT (p = 0.38, BF10 = 0.04) and TH (p = 0.33, BF10 = 0.05). For presbyopic participants, the results show a significant effect for VG [F(2,166) = 15.48, p < 0.0001, η²p = 0.16, BF10 = 19678], a significant effect for MT [F(2,166) = 3.38, p < 0.05, η²p = 0.04, BF10 = 0.82], and a non-significant effect for TH (p = 0.77, BF10 = 0.05).
The same approach viewed for distance phoria was repeated at near. The results showed a significant effect of Test [F(2,626) = 46.32, p < 0.0001, η²p = 0.13,BF10 = 1.95E+67], a significant effect of Measurement [F(2,626) = 3.37, p < 0.05, η²p = 0.01, BF10 = 0.05], a significant effect of Group [F(1,313) = 19.81, p < 0.0001, η²p = 0.06; BF10 = 1412]. Significant second order interaction were Test × Group [F(2,626) = 4.72, p < 0.05, η²p = 0.01, BF10 = 2.6E+70], Measurement × Group [F(2,626) = 4.73, p < 0.01, η²p = 0.02, BF10 = 7.90] and Test × Measurement [F(4,1252) = 3.17, p < 0.05, η²p = 0.01, BF10 = 1.13E+65].
A series of one-way ANOVAs performed on each specific test, intended to assess the difference between measurements, showed, for non-presbyopic, a non-significant effect for VG (p = 0.09, BF10 = 0.15), a non-significant effect for MT (p = 0.14, BF10 = 0.10] and a non-significant effect for TH (p = 0.12, BF10 = 0.02). For presbyopic participants, the results showed a non-significant effect for VG (p = 0.4, BF10 = 0.09), MT (p = 0.06, BF10 = 0.63) and TH (P = 0.07, BF10 = 0.50). The results are shown in Fig. 1.
 and for presbyopic (C, D). Data were expressed in prismatic diopter and separated according to test (VG = Von Graefe, MT = Modified Thorington and TH = Thoringthon) and measurements (M1, M2 and M3). Positive values represent eso deviations and negative exo. Bars represents +/− 1SEM.")
Mean results of phoria evaluated at far and near for non-presbyopic (A, B) and for presbyopic (C, D). Data were expressed in prismatic diopter and separated according to test (VG = Von Graefe, MT = Modified Thorington and TH = Thoringthon) and measurements (M1, M2 and M3). Positive values represent eso deviations and negative exo. Bars represents +/− 1SEM.
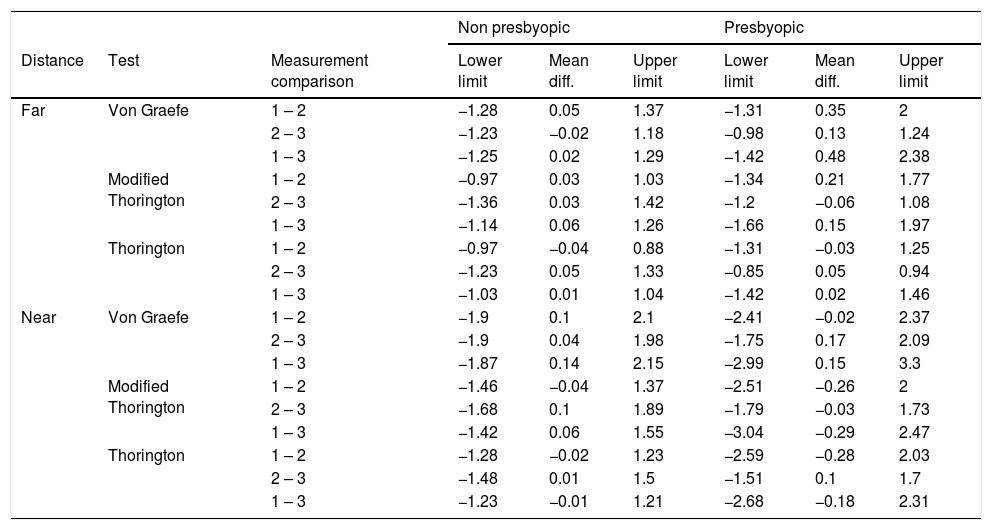
The LoA coefficients for the different tests and measurements are given in Table 3 and shown in Figs. 2 and 3, separated for presbyopic and non-presbyopic participants. Following the criteria of the smallest LoA range, the best agreements were obtained for TH followed by MT and VG for distance and near phoria. In general the agreement for presbyopic participants was lower (high LoAs).
Limits of Agreement and mean bias for the three phoria tests between each measurement separated for non-presbyopic and presbyopic. The units of these data are prismatic diopters.
| Non presbyopic | Presbyopic | |||||||
|---|---|---|---|---|---|---|---|---|
| Distance | Test | Measurement comparison | Lower limit | Mean diff. | Upper limit | Lower limit | Mean diff. | Upper limit |
| Far | Von Graefe | 1 – 2 | −1.28 | 0.05 | 1.37 | −1.31 | 0.35 | 2 |
| 2 – 3 | −1.23 | −0.02 | 1.18 | −0.98 | 0.13 | 1.24 | ||
| 1 – 3 | −1.25 | 0.02 | 1.29 | −1.42 | 0.48 | 2.38 | ||
| Modified Thorington | 1 – 2 | −0.97 | 0.03 | 1.03 | −1.34 | 0.21 | 1.77 | |
| 2 – 3 | −1.36 | 0.03 | 1.42 | −1.2 | −0.06 | 1.08 | ||
| 1 – 3 | −1.14 | 0.06 | 1.26 | −1.66 | 0.15 | 1.97 | ||
| Thorington | 1 – 2 | −0.97 | −0.04 | 0.88 | −1.31 | −0.03 | 1.25 | |
| 2 – 3 | −1.23 | 0.05 | 1.33 | −0.85 | 0.05 | 0.94 | ||
| 1 – 3 | −1.03 | 0.01 | 1.04 | −1.42 | 0.02 | 1.46 | ||
| Near | Von Graefe | 1 – 2 | −1.9 | 0.1 | 2.1 | −2.41 | −0.02 | 2.37 |
| 2 – 3 | −1.9 | 0.04 | 1.98 | −1.75 | 0.17 | 2.09 | ||
| 1 – 3 | −1.87 | 0.14 | 2.15 | −2.99 | 0.15 | 3.3 | ||
| Modified Thorington | 1 – 2 | −1.46 | −0.04 | 1.37 | −2.51 | −0.26 | 2 | |
| 2 – 3 | −1.68 | 0.1 | 1.89 | −1.79 | −0.03 | 1.73 | ||
| 1 – 3 | −1.42 | 0.06 | 1.55 | −3.04 | −0.29 | 2.47 | ||
| Thorington | 1 – 2 | −1.28 | −0.02 | 1.23 | −2.59 | −0.28 | 2.03 | |
| 2 – 3 | −1.48 | 0.01 | 1.5 | −1.51 | 0.1 | 1.7 | ||
| 1 – 3 | −1.23 | −0.01 | 1.21 | −2.68 | −0.18 | 2.31 | ||

Bland – Altman plots that show the agreement between measurements at far. The solid line represents the mean difference, the dashed lines represent the upper and lower limits of agreement. Values were separated for non-presbyopic and presbyopic. Many points were overlapped. The units of X and Y axes are prismatic diopters.

Bland – Altman plots that show agreement between measurements at near. The solid line represents the mean difference, the dashed lines represent the upper and lower limits of agreement. Values were separated for non-presbyopic and presbyopic. Many points were overlapped. The units of X and Y axes are prismatic diopters.
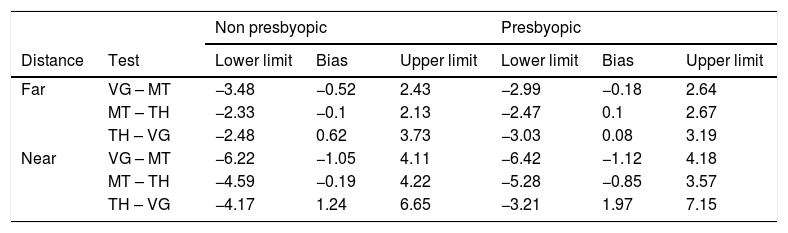
The LoA coefficients between tests at first measurement are listed in Table 4 and shown in Fig. 4. The best agreement as smallest LoA range was between MT and TH at far and near. No consistent difference between NP and P participants was found.
Limits of Agreement between tests and mean bias for the three phoria tests separated for non-presbyopic and presbyopic. The units of these data are prismatic diopters.
| Non presbyopic | Presbyopic | ||||||
|---|---|---|---|---|---|---|---|
| Distance | Test | Lower limit | Bias | Upper limit | Lower limit | Bias | Upper limit |
| Far | VG – MT | −3.48 | −0.52 | 2.43 | −2.99 | −0.18 | 2.64 |
| MT – TH | −2.33 | −0.1 | 2.13 | −2.47 | 0.1 | 2.67 | |
| TH – VG | −2.48 | 0.62 | 3.73 | −3.03 | 0.08 | 3.19 | |
| Near | VG – MT | −6.22 | −1.05 | 4.11 | −6.42 | −1.12 | 4.18 |
| MT – TH | −4.59 | −0.19 | 4.22 | −5.28 | −0.85 | 3.57 | |
| TH – VG | −4.17 | 1.24 | 6.65 | −3.21 | 1.97 | 7.15 | |

Bland – Altman plots that showed agreement between test at far and near at first measurement. The solid line represents the mean difference, the dashed lines represent the upper and lower limits of agreement. Values were separated for non-presbyopic and presbyopic. Many points were overlapped. The units of X and Y axes are prismatic diopters.
The main aim of this study was to compare tests and measurements, without considering the role of examiner by whom they were appropriately employed, in order only to collect data in different offices and expand the age range. Each examiner collected data for a different number of participants within different age ranges, depending on their availability. For these reasons a comparison cannot be defined as interexaminer differences. However, a comparison with a repeated measure ANOVA showed no significant effect of Examiner (p = n.s. at far and p < 0.05 at near), but Bayesian showed an uncertain result (BF10 = 0.67 at far and 2.54 at near).
Normative data definitionSince we recruited more than three hundred participants, the goal was to define specific norms (also called expected values)4 for each test taking into account the specificity of each test, distance and the distribution of data.
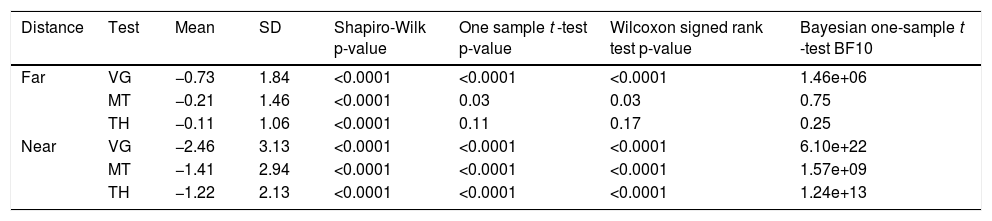
Significant differences in mean data were found in the previous analysis between non-presbyopic and presbyopic participants. For this reason, normative data cannot be defined without taking into account the influence of age. Since the two groups did not comprise balanced numbers (i.e. 231 participants for NP and 84 for P) and for a minimum calculation of percentile one hundred cases were necessary, we decided to develop normative data only for non presbyopic participants. Considering only the first administration, we have performed the Shapiro-Wilk test for normality and calculated the mean and SD, as well as one sample t-test, Wilcoxon signed ranked test and Bayesian one sample t-test against zero. These data are listed in Table 5.
Descriptive statistics of the sample of 231 non presbyopic participants together with the test for the distribution of data, one sample t-test, Wilcoxon signed ranked test and Bayesian one-sample t-test. Mean results are expressed in prismatic diopters.
| Distance | Test | Mean | SD | Shapiro-Wilk p-value | One sample t -test p-value | Wilcoxon signed rank test p-value | Bayesian one-sample t -test BF10 |
|---|---|---|---|---|---|---|---|
| Far | VG | −0.73 | 1.84 | <0.0001 | <0.0001 | <0.0001 | 1.46e+06 |
| MT | −0.21 | 1.46 | <0.0001 | 0.03 | 0.03 | 0.75 | |
| TH | −0.11 | 1.06 | <0.0001 | 0.11 | 0.17 | 0.25 | |
| Near | VG | −2.46 | 3.13 | <0.0001 | <0.0001 | <0.0001 | 6.10e+22 |
| MT | −1.41 | 2.94 | <0.0001 | <0.0001 | <0.0001 | 1.57e+09 | |
| TH | −1.22 | 2.13 | <0.0001 | <0.0001 | <0.0001 | 1.24e+13 |
In order to ascertain whether different tests require different norms, using only the first administration of each test, we have performed two One-Way ANOVAs with the factor tests for far and near phoria. The results at far show a significant result [F(2,460) = 25.58, p < 0.0001, η²p = 0.10, BF10 = 2.41E+08). Post-hoc comparisons with Bonferroni correction show a significant difference between VG and TH (p < 0.0001), between VG and MT (p < 0.0001), but a non-significant difference between MT and TH. In addition, Bayesian Post-Hoc comparisons confirm these results: between VG and MT BF10 = 32161, between VG and TH BF10 = 1.04E+06, between MT and TH BF10 = 0.18. At near, there is a significant effect [F(2,460) = 31.58, p < 0.0001, η²p = 0.12, BF10 = 4.36E+10]. Post-hoc comparisons with Bonferroni correction show a significant difference between VG and TH (p < 0.0001), between VG and MT (p < 0.0001), but a non-significant difference between MT and TH. Bayesian Post-Hoc comparisons confirm these results: between VG and MT BF10 = 1.64E+06, between VG and TH BF10 = 9.39E+09, between MT and TH BF10 = 0.16
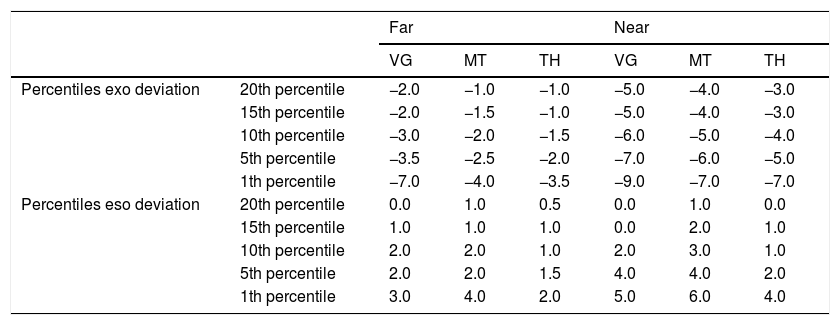
For a large sample, the Shapiro-Wilk test tends to detect even trivial shifts from the null hypothesis of normality.42 For this reason, we have produced a QQ plot and graphical representation of the distribution of score for each phoria tests (Fig. 5). Since the large part of phoria tests did present a non-normal distribution (Table 5 and Figure 6), for a practical application, we have calculated also the non-parametric percentiles that indicate the value below which a given percentage of a group of observations fall43 (Table 6). Since subjects could present only the eso- or exo- values, the scale was split for the two directions, reporting only the lower bound of the scale. Using this scoring method, a percentile below 15 is comparable with 1SD below the mean and a percentile below 5 is comparable with 2SD below the mean.43
 for each phoria test and distance for non presbyopic. PD = prismatic diopters.")
Percentile subdivision of the phoria measurements for the three test separated by distance and test. The units of these data are prismatic diopters.
| Far | Near | ||||||
|---|---|---|---|---|---|---|---|
| VG | MT | TH | VG | MT | TH | ||
| Percentiles exo deviation | 20th percentile | −2.0 | −1.0 | −1.0 | −5.0 | −4.0 | −3.0 |
| 15th percentile | −2.0 | −1.5 | −1.0 | −5.0 | −4.0 | −3.0 | |
| 10th percentile | −3.0 | −2.0 | −1.5 | −6.0 | −5.0 | −4.0 | |
| 5th percentile | −3.5 | −2.5 | −2.0 | −7.0 | −6.0 | −5.0 | |
| 1th percentile | −7.0 | −4.0 | −3.5 | −9.0 | −7.0 | −7.0 | |
| Percentiles eso deviation | 20th percentile | 0.0 | 1.0 | 0.5 | 0.0 | 1.0 | 0.0 |
| 15th percentile | 1.0 | 1.0 | 1.0 | 0.0 | 2.0 | 1.0 | |
| 10th percentile | 2.0 | 2.0 | 1.0 | 2.0 | 3.0 | 1.0 | |
| 5th percentile | 2.0 | 2.0 | 1.5 | 4.0 | 4.0 | 2.0 | |
| 1th percentile | 3.0 | 4.0 | 2.0 | 5.0 | 6.0 | 4.0 | |
In this study we have aimed to compare the results, to assess the within-session repeatability and define the norms of three phoria tests. In clinical assessment, these evaluations are necessary, because, without them, there can be no confidence in the values produced, and therefore the clinicians cannot draw the correct conclusions from the measurements.11,27,44 The results are discussed separately below for repeatability, test comparison, and normative data.
Measurement repeatabilityThe terms “reliability” and “repeatability” have been applied differently in a number of studies which has resulted in some confusion, making the border between them sometimes appear unclear.13,14,31,45–49 In specific cases, other terms have also been used incorrectly, including reliability for test-retest repeatability,15 consistency for agreement between tests,7,14,50,51 repeatability for agreement14 and agreement for comparison.52 The results of repeatability were therefore discussed in terms of both correlation and agreement.
The aim of the study on repeatability was to verify the requirements of multiple (typically three) repetitions of measurements in clinical practice in a short period of time corresponding to the length of the clinical examination. The results are clear in the reporting of a strong relationship between measurements, with near to zero bias but with moderate LoAs at far (about 2.8 for VG, 2.6 for MT and 2.2 for TH) and at near (about 4.3 for VG, 3.6 for MT and 3.2 for TH) with larger LoAs for presbyopic participants. For both distances, the best agreement between measurements was found for TH, medium for MT and lower for VG.
These results agree with the classical test/re-test procedure after a period of days with values that appear coherently to be slight lower.15,16 Specifically, the modified Thorington and Thorington tests were more repeatable than the von Graefe.15,16 The repeatability was better using a trial frame compared with the phoropter16, and CT at near gives some differences in measurements but they are not clinically significant.18 The Thorington and cover tests measurements showed small differences.14 Different tests performed using phoropter and trial frame in the measurement of phoria gave more stable results with the latter, and more variable with the former.16,53 The small values obtained here could have arisen from the difference in testing times. In our case, this was within a single session, in the other cases it was between sessions performed on different days. Observing the mean bias between measurements and tests, it appears that VG and MT at far drift to eso-values with repetitions in presbyopic but not for non-presbyopic participants. At near, some differences between sessions were found. However, the application of the Bayesian analyses has shown that some results are not sufficiently compelling and consequently they are not key factors. The strong difference between tests is the main difference found.
Test comparisonThe relationship between tests found to be medium. In fact, in both of the measurements (far and near) bias and the LoAs appear larger. Overall, the mean biases between tests show the well-known phenomena that VG gives more exo- values than the other two methods.54 Also, the LoAs demonstrate the large dispersion of the data. When comparisons were made with VG, larger LoAs were found. In fact, small LoAs were found between MT and TH, both at near and far. As a result of a medium relationship between tests, it seems that not all phoria tests are fully interchangeable and there is a requirement for specific norms for each specific test denoted by the different variance. Interestingly, a very small difference between non-presbyopic and presbyopic participants were found which does not support a previously observed large difference in agreement between cover and Von Graefe tests in comparing these two age ranges.24 Otherwise, some studies of test comparisons gave similar results, with a small bias and high agreement,14 but the Von Graefe test showed more exo- values,54 and this gives more support to the diagnosis of convergence insufficiency.23 The use of a detailed card, together with the MT method, provides better control of accommodation,22 and a different endpoint of CT was significantly different but not clinically relevant (<0.5Δ).18
Normative dataSince testing was performed with the best refractive correction, we have also defined the norms for each specific test. Since a difference between non-presbyopic and presbyopic participants was found and in the latter group there were relatively few cases, the normative data definition was limited to non-presbyopic. Data seem not to be distributed normally, and consequently we have provided both the mean and SD scores (as other norms for comparisons), together with the percentile ranking separated for eso- and exo- values. In defining normative data, when comparing different tests a difference was found and this result confirms the requirement for a specific norm for each test. Moreover, when 1 or 2 standard deviations were added to the mean value in order to consider the cut-off limits,4 the difference between tests grew larger, and the requirement for specific values became important. In comparing our data with those reported in the literature, we found small values and small SDs for some data,4 and similar results to more recent norms.55 Different samples, age and test modalities may explain these differences.44
ConclusionsOur primary finding was that the repetition of tests in clinical practice is not necessary since the within-session repeatability is very high. Secondly, we have reproduced the results of the Von Graefe technique, with more exo- values obtained when measuring phoria with phoropter. Based on these results, we recommend that subjective measurements of phoria can best be quantified using either the MT or TH techniques in free space and that the values be compared with the given, specific and updated norms.
Conflict of interestThe phoria card used for Thorington technique has the name of the first author. Nevertheless, he has no commercial interest in its sale.
We would thank the students and collaborators who helped the authors in collecting data (given in alphabetical order): Francesco Cantù, Tiziana Cattaneo, Vasco Lisena, Carlotta Pomarè Montin, Andrea Giuseppe Rubini and Roberta Signorelli.


