


To evaluate the relationship between intraocular pressure (IOP) measurements obtained with Pulsair EasyEye (PEE) and Ocular Response Analyser (ORA) in healthy patients.
MethodsSixty-five eyes from 65 patients underwent a full optometric examination, including central corneal thickness (CCT), and IOP measured with PEE and ORA. Differences between IOP measurements between both tonometers were analyzed. Pearson correlation coefficients between IOP values and ORA corneal biomechanics parameters were also obtained.
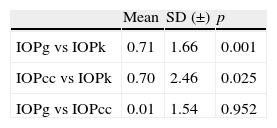
ResultsStatistically significant differences were found between IOP of PEE (IOPk) and Goldmann-corrected IOP of ORA (IOPg; p=0.001). IOPk and corneal resistance-corrected IOP of ORA (IOPcc) were also found to differ significantly (p=0.025). Mean differences between IOPg-IOPk, IOPcc-IOPk and IOPg-IOPcc were 0.71±1.66, 0.70±2.46 and 0.01±1.54mmHg (mean±standard deviation), respectively.
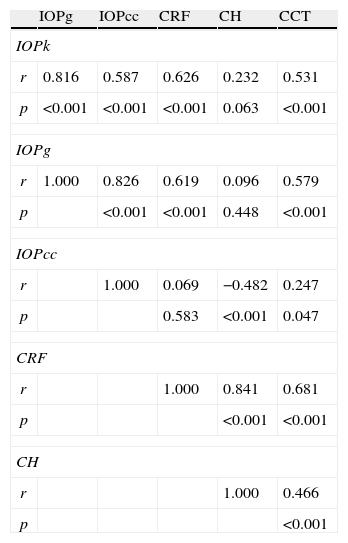
Pearson correlation coefficients indicated that IOPk, IOPg, and IOPcc were significantly correlated among them (p<0.001): r=0.816 for IOPk-IOPg, r=0.826 for IOPcc-IOPg and r=0.587 IOPcc-IOPk. IOPk and IOPg were linearly associated with corneal resistance factor (CRF; r=0.626 and r=0.619, respectively) and with CCT (r=0.531 and r=0.579, respectively). IOPcc had a linear relationship with corneal hysteresis (CH) (r=−0.482) and similar results were found between CRF and CH (r=0.841), CRF and CCT (r=0.681) or between CH and CCT (r=0.466).
ConclusionsDifferences between mean values of IOP measured with PEE and ORA are statistically significant, with ORA tonometer taking higher IOP values than PEE in most of the cases. IOPk, IOPcc and IOPg have, al least, moderate positive linear correlations and ORA biomechanics parameters CRF, CH and CCT have a linear positive relation between them.
Evaluar la relación entre las mediciones de la presión intraocular (PIO) obtenidas mediante Pulsair EasyEye (PEE) y el Analizador de Respuesta Ocular (ORA) en pacientes sanos.
MétodosSesenta y cinco ojos pertenecientes a 65 pacientes recibieron un examen optométrico completo, que incluía la medición del espesor corneal central (ECC) y la PIO, con PEE y ORA. Se analizaron las diferencias entre las mediciones de PIO realizadas con ambos tonómetros. También se calcularon los coeficientes de correlación de Pearson entre los valores de PIO y los parámetros biomecánicos corneales proporcionados por el ORA.
ResultadosSe hallaron diferencias estadísticamente significativas entre la PIO medida con PEE (PIOk) y la PIO corregida de Goldman medida con ORA (PIOg; p=0,001). La PIOk y la PIO corneal compensada medida con ORA (PIOcc) también fueron significativamente diferentes (p=0,025). Las diferencias medias entre PIOg-PIOk, PIOcc-PIOk y PIOg-PIOcc fueron de 0,71±1,66, 0,70±2,46 y 0,01±1,54mmHg (desviación media±estándar), respectivamente.
Los coeficientes de correlación de Pearson indicaron que los valores de PIOk, PIOg, PIOcc se hallaban significativamente correlacionados (p<0,001): r=0,816 para PIOk-PIOg, r=0,826 para PIOcc-PIOg y r=0,587 PIOcc-PIOk. Los valores de PIOk y PIOg se relacionaban linealmente con el factor de resistencia corneal (FRC; r=0,626 y r=0,619, respectivamente) y con el ECC (r=0,531 y r=0,579, respectivamente). La PIOcc también se relacionaba linealmente con la histéresis corneal (HC; r=−0,482), hallándose resultados similares entre la FRC y HC (r=0,841), FRC y ECC (r=0,681), o entre la HC y el ECC (r=0,466).
ConclusionesLas diferencias entre los valores medios de la PIO, medidas con PEE y ORA son estadísticamente significativas, obteniendo el tonómetro ORA unos valores de PIO superiores a los obtenidos por PEE en la mayoría de los casos. Los valores de PIOk, PIOcc y PIOg presentan, como mínimo, unas correlaciones lineales positivas moderadas, y los parámetros biomecánicos medidos con ORA, como FRC, HC y ECC presentan una relación positiva lineal entre ellos.
Glaucoma is defined as an acquired optic neuropathy, which is characterized by alterations in the visual field, and some specific changes in the optic disc and retinal nerve fiber layer (RNFL).1
IOP elevation is one of the risk factors of glaucoma, and although its presence or absence does not imply disease, it can indicate that the risk of damage on the optic nerve increases with elevation of IOP.
The fact that noncontact tonometry is a convenient procedure for the patient (no need for anesthetic and the reduction of cross infection between patients) has lead to an increase in popularity of noncontact tonometers for IOP screening.2Previous articles reported very high repeatability and correlation in results between Goldmann applanation and pneumatic tonometry.3,4
The PEE (Ophtalmic Instruments Inc., UK) and the ORA (Reichert, Inc., Depew, NY) are noncontact pneumatic tonometers. The air tonometers have the same basic principal as the Goldman tonometry, but with differences in the procedure for obtaining the measurement, although it should be considered that the dependence of the corneal thickness is similar in the applanation tonometry by Goldman and the noncontact tonometry.5–7
The PEE is a portable hand-held tonometer that makes it a useful method for monitoring IOP in patients with reduced mobility, children and domiciliary visits. The PEE is one of the few tonometers capable of measuring IOP in the supine position or in the prone position.8 PEE seems to be an accurate, reliable measurement technique of IOP in the normotensive population and an alternative method in screening of IOP and when GAT is difficult to perform with certain patients.9
The ORA has been designed to compensate the effects of corneal irregularities on the measurement of the IOP using biomechanical corneal indicators.3
The ORA generates two separates IOP output parameters, corneal compensated IOP (IOPcc), which is a measurement of the IOP less affected by the corneal properties and Goldmann-correlated IOP (IOPg) which would be the traditional measurement of the IOP. The ORA provides, apart from the IOP measurements, two corneal biomechanical parameters, corneal hysteresis (CH) and corneal resistance factor (CRF). During the ORA measurement, a jet of air is projected onto the eye, which makes the shape of the cornea change, going from convex to concave. In this process, the cornea goes through a first applanation, passing through a concavity state, and achieving a second applanation state as the eye recovers its normal convex shape, once the pressure applied diminishes. The ORA software detects these two states of applanation and measures the pressure necessary to achieve them. The applanation pressure values are different, due to the viscoelastic properties of the cornea. The difference between these two pressure values is called CH and is measured in mm Hg. The CH is a measurement of corneal viscous damping, in other words, the capacity of the tissue to absorb and dissipate the energy, resulting from the viscoelastic properties of the cornea. It is related to the state of the corneal fibers and indirectly with the CCT. The CRF measures the global resistance of the cornea which is determined by viscous resistance and its elasticity.10
There are studies that have shown that a low CH is an indicator independent of glaucomatous damage. The CH was significantly less in diseased eyes than in healthy eyes.11
Since the introduction of the ORA in clinical practice, several studies have been carried out looking for a relation between hysteresis and different pathologies apart from glaucoma and different surgical treatments. According to some authors, CH appears reduced in cases of keratoconus,12–14 Fuchs¿ dystrophy15 and even after refractive surgery and penetrating keratoplasty.12,16,17
The first objective of this study is to compare the measurements of two noncontact tonometers, PEE and ORA and to see the correlation of their measurements. The second objective is to study corneal biomechanic properties and its relationship with the IOP, starting from the values provided by the ORA (CH, CRF, CCT) in healthy population. To our knowledge, there was not any study comparing measurements between PEE and ORA.
MethodsSubjectsA total of 65 normal eyes of volunteers were recruited from September 2010 to November 2010. The subjects were selected from University of Zaragoza; all were students or teachers of Optics and Optometry Degree. The design of the study followed the tenets of the Declaration of Helsinki for biomedical research and the Institutional Review Board approved the study protocol. Written consent was obtained from all participants.
Exclusion criteria were previous ocular surgery, systemic diseases with ocular implications, presence of keratitis, and current use of medication that affects IOP or medications that could alter the properties of the cornea.
All patients included in this study underwent biomicroscopy of the anterior segment, IOP measurements by PEE (Keeler, Ophthalmic Instruments Inc., UK) and ORA (Reichert Inc., Depew, NY), and central corneal ultrasonic pachymetry by ORA (version 1.10 software was installed). After the procedure was explained to the subject, the readings were obtained accurately and quickly. For the assessment of IOP with PEE, three readings were taken and averaged to get the IOP reading for one eye.9 A single measurement of CCT was taken for each eye with the ORA. The PEE values were taken before ORA18 and at the end we obtained the CCT to avoid the effect of topical anesthesia on corneal biomechanical properties. All measurements were made at the same time of day (11 am±1h) to avoid diurnal fluctuations of IOP.19
Pneumatic tonometry (Pulsair EasyEye and Ocular Response Analyser) and central corneal thicknessPneumatic noncontact tonometry utilizes a gentle puff of air that creates pressure on the cornea when a correct alignment with the patient's eye exists. PEE only takes measures of the IOP (IOPk) while ORA determine corneal biomechanical properties relating the applied displacement produced in the tissue. ORA is able to measure CH that is a measurement of the ability of the cornea to both absorb and dissipate energy and the CRF that is calculated from the CH parameter and quantifies the overall corneal rigidity or stiffness.8 The last parameter measured with ORA is CCT; one drop of the topical anesthetic tetracaine hydrochloride and oxybuprocaine hydrochloride (Colircusí Double anesthetic; Alcon Laboratories Inc., Fort Worth, TX) was instilled in both eyes to measure it. Data points were monitored for accuracy in ORA using the corneal waveform graph obtained with each measurement. If the waveform graph suggested an inaccurate measurement, those data points were discarded and another measurement was taken. The same experienced technician performed all explorations and other person was the responsible of recording the values.
Statistical analysesStatistical analyses were carried out with the Statistical Package for the Social Sciences (SPSS 17.0, SPSS Inc., Chicago, IL) and MedCal 11.0.1. (MedCal Software, Mariakerke, Belgium). Kolmogorov–Smirnov Z-test was performed to check the normal distribution of variables. As the points had Gaussian distribution, parametric tests like t-Student's and Pearson coefficient correlation were used. The degree of correlation was categorized, in absolute values, as low when r<0.4, moderate when 0.4=r<0.6 and strong when 0.6≥r.
The assessment of agreement between results of IOPk, IOPg and IOPcc was performed according to Bland Altman.20
Regression Graphs were performed using Excel 2003 (Microsoft® Office Excel 2003, Microsoft Corporation) and Bland–Altman plots were obtained with MedCal.
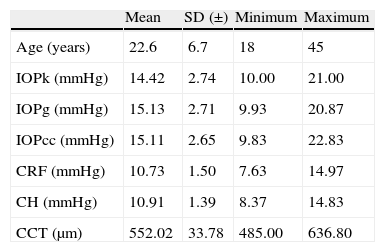
ResultsThe study sample included 65 eyes from 65 healthy individuals (30% male and 70% female) with mean age 22.6±6.7 years, ranging from 18 to 45 years. Mean IOPk was 14.42±2.74mmHg, while mean Goldmann-corrected IOP of ORA (IOPg) was 15.13±2.71mmHg and corneal resistance-corrected IOP of ORA (IOPcc) was 15.11±2.65mmHg. Biomechanics corneal parameters measured with ORA were 10.91±1.39mmHg for CH, 10.73±1.50mmHg for CRF and 552.02±33.78μm for CCT (Table 1).
Descriptive statistics.
| Mean | SD (±) | Minimum | Maximum | |
| Age (years) | 22.6 | 6.7 | 18 | 45 |
| IOPk (mmHg) | 14.42 | 2.74 | 10.00 | 21.00 |
| IOPg (mmHg) | 15.13 | 2.71 | 9.93 | 20.87 |
| IOPcc (mmHg) | 15.11 | 2.65 | 9.83 | 22.83 |
| CRF (mmHg) | 10.73 | 1.50 | 7.63 | 14.97 |
| CH (mmHg) | 10.91 | 1.39 | 8.37 | 14.83 |
| CCT (μm) | 552.02 | 33.78 | 485.00 | 636.80 |
IOPk, Keeler Intraocular Pressure; IOPg, Goldmann Correlated Intraocular Pressure; IOPcc, Corneal Compensated Intraocular Pressure; SD, standard deviation; CCT, central corneal thickness; CH, corneal hysteresis; CRF, corneal resistance factor.
Table 2 presents the two-tailed t-Student's test for the IOP measured with the Keeler tonometer and the ORA. The results (mean±standard deviation) indicated that there were statistically significant differences between IOPg and IOPk (0.71±1.66; p=0.001) as well as between IOPcc and IOPk (0.70±2.46; p=0.025). There was no significant difference between IOPg and IOPcc (0.01±1.54; p=0.952).
Table 3 shows Pearson's correlation coefficients (r) and significance levels for two-tailed test (p) between the ORA measures and the Keeler tonometer values. IOPk, IOPg and IOPcc were significantly correlated between them (p<0.05) and these variables were found to be linearly related. The degree of agreement between instruments was evaluated using the Bland–Altman method (Figs. 1–3). This analysis shows that although the limits of agreement and average difference change, the differences did not vary in direct proportion to the magnitude of the measured IOP. IOPg and IOPcc provide similar values as observed by the narrow confidence interval but IOPk shows poorer agreement with IOPcc than with IOPg like Pearson correlation coefficients do. Figs. 4–6 presents the percentage of subjects whose means differences between the IOP measured with ORA and Keeler were within 1mmHg, between 2.1 and 3mmHg and over 3.1mmHg.
Pearson's correlation coefficients (r) and significance levels for two-tailed test (p) between the ORA measurements and the Keeler tonometer values. p≤0.05 was considered statistically significant.
| IOPg | IOPcc | CRF | CH | CCT | |
| IOPk | |||||
| r | 0.816 | 0.587 | 0.626 | 0.232 | 0.531 |
| p | <0.001 | <0.001 | <0.001 | 0.063 | <0.001 |
| IOPg | |||||
| r | 1.000 | 0.826 | 0.619 | 0.096 | 0.579 |
| p | <0.001 | <0.001 | 0.448 | <0.001 | |
| IOPcc | |||||
| r | 1.000 | 0.069 | −0.482 | 0.247 | |
| p | 0.583 | <0.001 | 0.047 | ||
| CRF | |||||
| r | 1.000 | 0.841 | 0.681 | ||
| p | <0.001 | <0.001 | |||
| CH | |||||
| r | 1.000 | 0.466 | |||
| p | <0.001 | ||||
IOPk, Keeler Intraocular Pressure; IOPg, Goldmann Correlated Intraocular Pressure; IOPcc, Corneal Compensated Intraocular Pressure; CCT, Central corneal thickness; CH, corneal hysteresis; CRF, corneal resistance factor.
 on y-axis and the average of the instruments’ readings (IOPg+IOPcc)/2 on the x-axis. Overall agreement is low (mean Δ±SD: 0.0±3.1mmHg with 95% limits of agreement between −3.1 and +3.1). Correlation R2=0.0013 (p=0.7766). Slope=−0.0222 (p=0.7766). Intercept=0.3233 (p=0.7872).")
Bland–Altman analysis showing distribution of intraocular pressure differences (IOPg-IOPcc) on y-axis and the average of the instruments’ readings (IOPg+IOPcc)/2 on the x-axis. Overall agreement is low (mean Δ±SD: 0.0±3.1mmHg with 95% limits of agreement between −3.1 and +3.1). Correlation R2=0.0013 (p=0.7766). Slope=−0.0222 (p=0.7766). Intercept=0.3233 (p=0.7872).
 on y-axis and the average of the instruments’ readings (IOPg+IOPk)/2 on the x-axis. Overall agreement is low (mean Δ±SD: 0.7±3.3mmHg with 95% limits of agreement between −2.5 and +4.0). Correlation R2=0.0005 (p=0.8614). Slope=−0.0141 (p=0.8614). Intercept=0.9175 (p=0.4486).")
Bland–Altman analysis showing distribution of intraocular pressure differences (IOPg-IOPk) on y-axis and the average of the instruments’ readings (IOPg+IOPk)/2 on the x-axis. Overall agreement is low (mean Δ±SD: 0.7±3.3mmHg with 95% limits of agreement between −2.5 and +4.0). Correlation R2=0.0005 (p=0.8614). Slope=−0.0141 (p=0.8614). Intercept=0.9175 (p=0.4486).
 on y-axis and the average of the instruments’ readings (IOPcc+IOPk)/2 on the x-axis. Overall agreement is low (mean Δ±SD: 0.7±4.8mmHg with 95% limits of agreement between −4.1 and +5.5). Correlation R2=0.0017 (p=0.7473). Slope=−0.0416 (p=0.7473). Intercept=1.3121 (p=0.4975).")
Bland–Altman analysis showing distribution of intraocular pressure differences (IOPcc-IOPk) on y-axis and the average of the instruments’ readings (IOPcc+IOPk)/2 on the x-axis. Overall agreement is low (mean Δ±SD: 0.7±4.8mmHg with 95% limits of agreement between −4.1 and +5.5). Correlation R2=0.0017 (p=0.7473). Slope=−0.0416 (p=0.7473). Intercept=1.3121 (p=0.4975).
 on y-axis and values of the difference (mmHg) on the x-axis. 0–1mmHg (32.3%), 1.1–2mmHg (18.5%), 2.1–3mmHg (21.5%) and over 3.1mmHg (27.7%).")
 on y-axis and values of the difference (mmHg) on the x-axis. 0–1mmHg (53.8%), 1.1–2mmHg (27.7%), 2.1–3mmHg (13.8%) and over 3.1mmHg (4.7%).")
 on y-axis and values of the difference (mmHg) on the x-axis. 0–1mmHg (44.6%), 1.1–2mmHg (26.2%), 2.1–3mmHg (20.0%) and over 3.1mmHg (9.2%).")
There were statistically significant correlations between the IOP values obtained with the tonometers and the corneal biomechanical parameters (Table 3). IOPk, IOPg, IOPcc and CCT were significantly correlated between them (p<0.05) and these variables were also linearly related. IOPk and IOPg were linearly associated with CRF (r=0.626 and r=0.619 respectively, p<0.001) but not with CH (r=0.232 and r=0.096 respectively, p>0.05). However, the opposite occurs with IOPcc, linear relation with CH (r=−0.482, p<0.001) but not with CRF (r=0.069, p>0.05). It could be also observed that all the biomechanics parameters (CRF, CH and CCT) were linearly related (p<0.001): CRF-CH with r=0.841, CRF and CCT with 0.691 and CH and CCT r=0.466.
DiscussionNon-invasive tonometry is an objective, quick and accurate technique to measure IOP. Thus, an easy to use tonometer is necessary in optometric practice, as well as for routine checkups, glaucoma diagnosis in compromised corneas or pediatric patients. Keeler and ORA tonometers carry out this premise and they are widely incorporated in optometric protocols. These tonometers have certain advantages over the applanation tonometer, as corneal anesthesia is not required, the procedure is comfortable for the patient and there is minimal risk of corneal abrasion or cross infection between patients. It has been widely described that the noncontact tonometer ORA is considered an accurate reliable method but it cannot be used interchangeably with the GAT because the first overestimates IOP and differences between both sets of measurements increase with highest IOPs.21–23
IOPg and GAT present better correlation than IOPcc and GAT because viscoelastic corneal properties influence in IOPg and GAT but not in IOPcc because it is modified by the values of CH and CRF.21–23
With both tonometers, IOP average values for healthy subjects were similar to those found by other authors.9,15,24–27
Analyzing absolute values measured in the same individual we found that in the majority of the cases Keeler tonometer measured lower than the ORA did. Specifically, IOPg was higher than IOPk in 69.23% of the cases versus 29.39% in which the opposite occurred. Average IOPcc was higher than IOPk in 66.15% of our patients, in 32.3% the contrary happened and only in 1.54% were equal. The statistical analysis of this situation revealed that significant differences were present between IOPk and IOPg and between IOPk and IOPcc. In consequence of this we can infer that both tonometers, PEE and ORA, are not clinically interchangeable. Results obtained with ORA demonstrate that between IOPg and IOPcc did not appear to exist statistically significant differences as other authors have already described.10,26,27
Although statistical differences between means have been found, high linear correlations appeared between IOPg and IOPcc (r=0.826 and p<0.001) and between IOPk and IOPg (r=0.816 and p<0.001). Correlation between IOPk and IOPcc was moderate (r=0.587 and p<0.001) but this could be justified because IOPcc was corrected by CRF.
One of the most important aims of this study was to know if differences in IOP between these tonometers would be relevant in the clinical practice. According to the Bland–Altman plots, as it has shown in previous studies,7,14,28–32,33 the precision in the IOP results with ORA (IOPg and IOPcc) and PEE (IOPk) are very good in our population, with a maximum mean of 0.7mmHg. In a healthy subject we have observed that average differences among IOPk, IOPcc and IOPk measurements do not vary in direct proportion to the magnitude of the measured IOP. The Bland and Altman confidence limits and the graphics of distribution of frequency (Figs. 4–6) show that for any given eye we can expect the presence of variability. A limitation of our study design is that the examiner knew the IOP previous values and for this reason could be influenced to carry out the measures in the second tonometer. In this way, more work is necessary to elucidate the possible effects of this fact in our findings.
The study of the corneal biomechanical properties was the second part of this study. Among corneal biomechanical parameters, the most previously evaluated and studied is the CH. Our mean value was 10.91mmHg, similar to other authors except for Moreno-Montañes et al.,24 who found lower results for this parameter.15,16,25–27,34–37
CH is a parameter that changes from one patient to other; our results show that in healthy eyes vary from 8.37mmHg to 14.83mmHg. Luce,10 compared normal eyes with pathological and post-surgery eyes and their results indicated that the range of CH is higher (1.8–14.6mmHg) in anomalous eyes than in our group. This can be explained because pathological or post-surgical eyes have lower hysteresis than healthy ones. The overlap of the ranges indicates that this parameter could not diagnose illness or surgery. In our study, like Luce,10 we have observed that CH had low correlation with IOPg and IOPk and moderate with IOPcc.
Our values of CRF and CCT are similar to those found in previous studies.15–17,24–27,34–37
Correlation between CRF and CH is strong like the results previously founded by Shah et al.,16,17 Montard et al.,27 or other authors.10,26,32
This is due to these parameters that are obtained from the values of the flatten pressures of the tonometry. We have obtained similar results compared to these authors in the moderate correlation between CCT and CH, but a stronger correlation than Luce,10 is reveled in our study. In the end, positive and high correlation between CCT and CRF is obtained in our measurements.
In conclusion, we found that PEE frequently provides lower values than the ORA does but IOPk, IOPcc and IOPg have, al least, moderate, positive linear correlations.


