To evaluate the changes in the stimulus and response Accommodative Convergence to Accommodation (AC/A) ratio following vision therapy (VT) in Convergence Insufficiency (CI).
MethodsStimulus and response AC/A ratio were measured on twenty five CI participants, pre and post 10 sessions of VT. Stimulus AC/A ratio was measured using the gradient method and response AC/A ratio was calculated using modified Thorington technique with accommodative responses measured using WAM-5500 open-field autorefractor. The gradient stimulus and response AC/A cross-link ratios were compared with thirty age matched controls.
ResultsMean age of the CI and control participants were 23.3±5.2 years and 22.7±4.2 years, respectively. The mean stimulus and response AC/A ratio for CI pre therapy was 2.2±0.72 and 6.3±2.0 PD/D that changed to 4.2±0.9 and 8.28±3.31 PD/D respectively post vision therapy and these changes were statistically significant (paired t-test; p<0.001). The mean stimulus and response AC/A ratio for controls was 3.1±0.81 and 8.95±2.5 PD/D respectively.
ConclusionsStimulus and response AC/A ratio increased following VT, accompanied by clinically significant changes in vergence and accommodation parameters in subjects with convergence insufficiency. This represents the plasticity of the AC/A crosslink ratios that could be achieved with vision therapy in CI.
Evaluar los cambios de la relación convergencia acomodativa/acomodación (AC/A) estímulo y respuesta, tras terapia visual (TV) en casos de Insuficiencia de Convergencia (CI).
MétodosSe midieron las relaciones AC/A de estímulo y respuesta en veinticinco participantes, tras realizar sesiones previas y posteriores de TV. La relación AC/A de estímulo se midió utilizando el método gradiente, y la relación AC/A de respuesta se calculó utilizando la técnica modificada de Thorington, midiendo las respuestas acomodativas con un autorrefractómetro de campo abierto WAM-5500. Se compararon las relaciones cruzadas AC/A gradiente estímulo y respuesta con treinta controles emparejados por edad.
ResultadosLa edad media del grupo con CI y el grupo control fue de 23,3±5,2 años y 22,7±4,2 años, respectivamente. La relación media AC/A de estímulo y respuesta para CI previa a la terapia fue de 2,2±0,72 y 6,3±2 PD/D, cuyos valores fueron de 4,2±0,9 y 8,28±3,31 PD/D respectivamente tras la terapia visual. Dichos cambios fueron estadísticamente significativos (prueba de t pareada; p<0,001). La relación media AC/A de estímulo y respuesta para los controles fue de 3,1±0,81 y 8,95±2,5 PD/D.
ConclusionesLa relación AC/A de estímulo y respuesta se incrementó tras la TV, junto a cambios clínicamente significativos en lo que respecta a vergencia y parámetros de acomodación en los pacientes con insuficiencia de convergencia. Esto representa la plasticidad de las referencias cruzadas AC/A, que podría alcanzarse con terapia visual en los casos de CI.
Convergence Insufficiency (CI) is the most common non-strabismic binocular vision disorder with prevalence estimates of 10.3–14.6% among children between 7 and 13 years1–4 and 19.6% among children between 13 and 17 years of age.1 Common clinical signs in CI include receded near point of convergence (NPC), high near exophoria as compared to distance phoria, reduced positive fusional vergence (PFV) for near, and a low stimulus AC/A ratio.5,6 Reduced vergence adaptation, and imbalance between the vergence and accommodation adaptive mechanisms have been proposed to be the underlying mechanisms in CI.7
Convergence Insufficiency Treatment Trial (CITT) group in a randomized clinical trial has shown that vision therapy (VT) as compared to home therapy and placebo, has been the most effective treatment of CI for children under 14 years of age, and adults.6,8,9 Apart from improvement in clinical signs, changes in vergence ranges,8–10 flattening of forced vergence fixation disparity curve,11–12 and improved adaptation to prism induced heterophoria13,14 have been reported following vision therapy in CI. Literature reporting near phoria changes with vision therapy is equivocal.14–17 Recent studies have reported that vergence adaptation and concurrent decay of convergence output could be improved with a standard VT protocol.18,19 If poor vergence adaptation is the underlying mechanism in CI, it would be logical to predict that the change in vergence adaptation would alter the cross link ratios of accommodative convergence to accommodation (AC/A) and convergence accommodation to convergence (CA/C). A study by Brautaset and Jennings,17 showed no change in AC/A & CA/C ratio following VT in CI. However, with a small sample size of 10 subjects and with a home based vision therapy protocol, it becomes difficult to comment about the efficacy of VT protocol in itself. In contrary, earlier reports from Manas16 and Flom20 state that the AC/A ratio is malleable to vision therapy.
In this study, we aimed to understand (1) changes in crosslink ratios of stimulus and response AC/A before and after a structured in-office VT program in CI and (2) to compare the stimulus and response AC/A ratios in CI to age-matched controls.
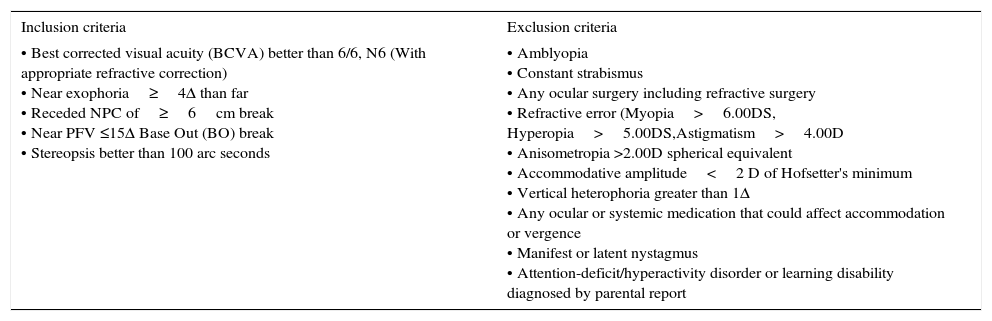
MethodsThe study was approved by the institutional review board of Medical Research Foundation, Chennai and adhered to the declaration of Helsinki. Written informed consent was obtained from all participants, and for children assent was obtained from parents. The study was carried out at the binocular vision and vision therapy clinic of Sankara Nethralaya, Chennai. This was a quasi-experimental study with a control group. A total of 55 participants were included in the study: 25 cases and 30 controls in the age group 9–35 years. The inclusion criteria followed for CI were adopted and modified from CITT study8 (Table 1). Symptomatic subjects reporting to the binocular vision clinic with minimum two of the three primary signs (Near exophoria≥4Δ than far, reduced near PFV <15 PD break and receded NPC>6cm) were included for the study. Any subject who reported near visual symptoms such as eyestrain, headache, blurred vision, diplopia or asthenopia were considered as symptomatic. Best corrected visual acuity better than 6/6, N6 and stereopsis >100 arc seconds were common criteria for both the cases and controls. The inclusion criteria for the control group included; BCVA better than 6/6, N6 (with appropriate refractive correction), normal accommodative and vergence parameters,19 absence of any binocular vision anomaly, any ocular pathology, and/or any other exclusion criteria (Table 1). The controls were recruited from the student and staff population who were novice to the testing procedures as that of the cases.
Inclusion and exclusion criteria for convergence insufficiency (CI).
| Inclusion criteria | Exclusion criteria |
|---|---|
| • Best corrected visual acuity (BCVA) better than 6/6, N6 (With appropriate refractive correction) • Near exophoria≥4Δ than far • Receded NPC of≥6cm break • Near PFV ≤15Δ Base Out (BO) break • Stereopsis better than 100 arc seconds | • Amblyopia • Constant strabismus • Any ocular surgery including refractive surgery • Refractive error (Myopia>6.00DS, Hyperopia>5.00DS,Astigmatism>4.00D • Anisometropia >2.00D spherical equivalent • Accommodative amplitude<2 D of Hofsetter's minimum • Vertical heterophoria greater than 1Δ • Any ocular or systemic medication that could affect accommodation or vergence • Manifest or latent nystagmus • Attention-deficit/hyperactivity disorder or learning disability diagnosed by parental report |
Testing procedures: Participants meeting the inclusion criteria in both cases and control group underwent a comprehensive binocular vision assessment. Selected participants were given a detailed description of the treatment and test procedures that they were expected to undergo. Questions from the participants were encouraged. The test for binocular vision included: visual acuity, sensory and motor evaluation. This included stereopsis, ocular movements & cover test, near point of convergence, fusional vergence ranges, near point of accommodation, relative accommodation measures, accommodative and vergence facility.5 Manual of procedures (adopted from the CITT study protocol)8 were followed to ensure standardization of test procedures and patient instructions. All the measurements were taken with the participants’ best refractive correction. The initial investigation of binocular vision assessment was completed within one hour and a break of 5minutes was given between the measurements of each test. The sequence followed throughout the study was as follows: test for distance and near phoria, the near point of convergence (NPC), the amplitude of accommodation, monocular estimate method (MEM) retinoscopy, and fusional vergence amplitudes. All of these measurements were obtained using a standard protocol.5 The pre and post VT clinical measurements were documented by masked examiners.
Instrument and set upAn objective, infrared, commercially available WAM-5500 open field auto-refractometer (Grand Seiko, Japan) was used to measure the dynamic accommodative response for the response AC/A measurement. In the dynamic mode, spherical equivalent (SE) value, and pupil diameter was measured at 0.2seconds step for 120seconds. Data was collected in comma separated value (CSV) file format and then cleaned for analysis. The extreme values due to improper fixation and blink were removed prior to analyses.
Measurement of stimulus and response AC/A ratioThe stimulus AC/A ratio was calculated using gradient method. Initially, participants’ phoria was measured at 40cm with the best correction using modified Thorington technique. Following this, the phoria was measured by placing −1.00DS trial lens in addition to the participants’ best correction. In children whom the response was varying, prism bar cover test (PBCT) was performed to measure the phoria. The subjects were encouraged to keep the stimulus clear with the insertion of the minus lens. The stimulus AC/A ratio was calculated by dividing the change in deviation in prism diopters by the change in lens power (gradient method).5
To determine response AC/A ratio, simultaneous measurement of accommodative response and convergence (heterophoria) using the modified thorington technique was adapted.21,22 The participant was positioned on the WAM-5500 wearing a large-aperture trial frame with best refractive correction. A Maddox rod was placed horizontally in front of the left eye and the participant was asked to look at the modified thorington card placed at 4m and phoria measurements were taken. Accommodative response readings of the fellow right eye were taken with the WAM-5500 auto-refractometer simultaneously. The participant was instructed to keep the target clear all the time. Similarly, measurements were carried out at 40cm. Response AC/A ratio was calculated by the following equation (Gwiazda et al., 2000).22
where; IPD is the Interpupillary distance in centimeters; NAS is the near accommodative stimulus in diopters; FP is the far phoria in prism diopters; NP is the near phoria in prism diopters; NAR is the near accommodative response in diopters; FAR is the far accommodative response in diopters.Treatment regimen
All participants underwent In-office VT5,8 for 60min per day for continuous or alternate days for 10 sessions. In-office VT was divided into three phases. Within each phase, there were various exercises to train the gross convergence, vergence amplitudes and facility, and accommodative amplitude and facility. The therapy procedures were administered as per the guidelines in CITT manual of procedures.8 These therapy procedures are designed scientifically to train the accommodation and vergence systems in an incongruent manner, unlike the conventional pencil push up exercises. The endpoints set were reasonable estimates so that each participant was able to achieve. Thus, if a participant appeared to have attained the stated objectives of the therapy technique but was unable to achieve the precise endpoint, the training was moved to the next procedure after a reasonable effort. But training was given on the previous techniques also to achieve endpoints.5,8,9 The post-VT measurements were repeated on the immediate next day following the VT in all the participants.
ResultsThe mean age of the CI participants was 23.3±5.2 years (age range: 13–35 years). This group included a total of 12 females. The mean age of the control participants was 22.7±4.2 years (age range: 11–33 years). This group included a total of 19 females. No statistically significant difference in the age distribution was found between the cases and controls (unpaired t-test, p=0.6) Out of the total of 25 CI participants, 68% (n=17) were emmetropic (+0.50 DS to −0.50 DS), 24% (n=6) were myopic (<−0.50 DS) and 8% (n=2) were hyperopic (>+0.50 DS). Out of the total 30 control participants, 67% (n=20) were emmetropic, 30% (n=9) were myopic, and 3% (n=1) were hyperopic.
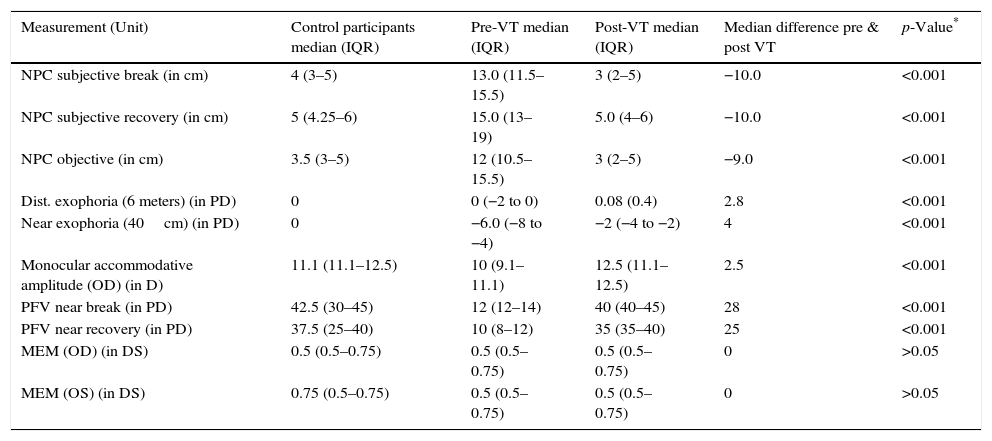
The binocular vision parameters of the control and CI participants have been reported in median (IQR) as the data was not normally distributed. BV parameters in CI participants pre and post VT including NPC subjective, objective break & recovery (B/R), distance and near exophoria, PFV distance and near B/R, and accommodative amplitude were compared. All the parameters showed statistically significant changes (Wilcoxon signed rank test, p<0.001) (Table 2).
Binocular vision parameters in control participants, and pre and post VT in CI subjects.
| Measurement (Unit) | Control participants median (IQR) | Pre-VT median (IQR) | Post-VT median (IQR) | Median difference pre & post VT | p-Value* |
|---|---|---|---|---|---|
| NPC subjective break (in cm) | 4 (3–5) | 13.0 (11.5–15.5) | 3 (2–5) | −10.0 | <0.001 |
| NPC subjective recovery (in cm) | 5 (4.25–6) | 15.0 (13–19) | 5.0 (4–6) | −10.0 | <0.001 |
| NPC objective (in cm) | 3.5 (3–5) | 12 (10.5–15.5) | 3 (2–5) | −9.0 | <0.001 |
| Dist. exophoria (6 meters) (in PD) | 0 | 0 (−2 to 0) | 0.08 (0.4) | 2.8 | <0.001 |
| Near exophoria (40cm) (in PD) | 0 | −6.0 (−8 to −4) | −2 (−4 to −2) | 4 | <0.001 |
| Monocular accommodative amplitude (OD) (in D) | 11.1 (11.1–12.5) | 10 (9.1–11.1) | 12.5 (11.1–12.5) | 2.5 | <0.001 |
| PFV near break (in PD) | 42.5 (30–45) | 12 (12–14) | 40 (40–45) | 28 | <0.001 |
| PFV near recovery (in PD) | 37.5 (25–40) | 10 (8–12) | 35 (35–40) | 25 | <0.001 |
| MEM (OD) (in DS) | 0.5 (0.5–0.75) | 0.5 (0.5–0.75) | 0.5 (0.5–0.75) | 0 | >0.05 |
| MEM (OS) (in DS) | 0.75 (0.5–0.75) | 0.5 (0.5–0.75) | 0.5 (0.5–0.75) | 0 | >0.05 |
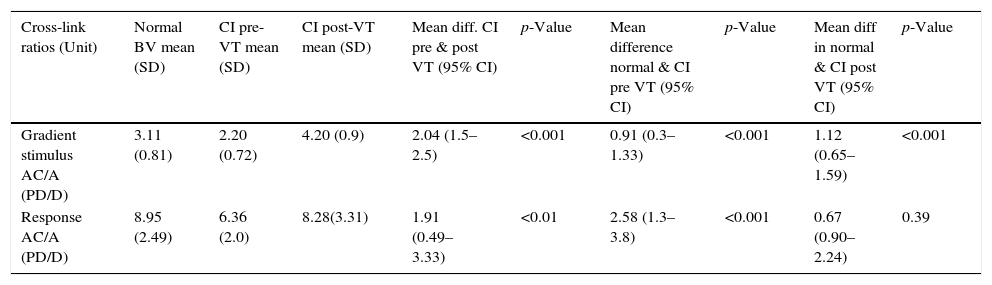
Response and stimulus AC/A ratios were compared in controls and CI pre VT and post VT (Table 3). Stimulus and response AC/A ratios were significantly different pre and post VT (paired t-test; p<0.05). Following VT, stimulus and response AC/A ratios improved significantly from the baseline in CI. Post VT, the response AC/A ratio became comparable to that of the controls (un-paired t-test; p>0.05).
Response and stimulus AC/A ratio, in controls, CI pre VT, and CI post VT subjects.
| Cross-link ratios (Unit) | Normal BV mean (SD) | CI pre-VT mean (SD) | CI post-VT mean (SD) | Mean diff. CI pre & post VT (95% CI) | p-Value | Mean difference normal & CI pre VT (95% CI) | p-Value | Mean diff in normal & CI post VT (95% CI) | p-Value |
|---|---|---|---|---|---|---|---|---|---|
| Gradient stimulus AC/A (PD/D) | 3.11 (0.81) | 2.20 (0.72) | 4.20 (0.9) | 2.04 (1.5–2.5) | <0.001 | 0.91 (0.3–1.33) | <0.001 | 1.12 (0.65–1.59) | <0.001 |
| Response AC/A (PD/D) | 8.95 (2.49) | 6.36 (2.0) | 8.28(3.31) | 1.91 (0.49–3.33) | <0.01 | 2.58 (1.3–3.8) | <0.001 | 0.67 (0.90–2.24) | 0.39 |
The results of our study show that changes occur in both stimulus and response AC/A ratios following VT, a finding consistent with that reported by Manas16 and Flom.20 Ten sessions of in-office VT, each one of 60min (total 600min), produced significant changes in the outcome measures of response and stimulus AC/A crosslink ratios, and accommodation and vergence parameters. Similar results showing improvements in accommodation and vergence parameters have been reported by the CITT8,9 study group.
Poor vergence adaptation13,18,19 reduced ability of the system to make rapid changes to the decay of the convergence accommodation (CA) amplitudes,18,19 unstable monocular preference23 and asymmetry in eye movements, and convergence peak velocity24 have been reported to be associated with CI. Vision therapy or orthoptic training program has been shown to improve the vergence adaptation, improve the decay of the convergence accommodation output, and eye movement parameters in CI.15,19,24 Brautaset and Jennings17 evaluated the effect of orthoptic treatments on the stimulus AC/A and CA/C ratio in six CI subjects and reported no change in the parameters after 12 weeks of home vision training. This could be due to the nature of training, as this study was focused on home VT and hence becomes difficult to compare directly with our study results wherein the VT was office based and was given for 10 consecutive/alternate days and hence more intense in nature. We have tested this protocol in an earlier study on a different cohort of subjects (unpublished data under review) and have found the results to be comparable with that of the CITT study outcomes.8,9 This type of a unique protocol has been adapted in our study for two reasons; (1) a few of our study subjects were from outstation and could comply only with such a protocol and (2) to look at effects of continued training on the mechanisms of vergence adaptation.
The response AC/A ratios were high in our study, in both the CI subjects and the controls, with CI subjects having lower means than the controls. This could be due to the reduced accommodative amplitudes of the subjects or the stimulus characteristics used for the experiment. However, all the CI subjects had normal accommodative amplitudes in our study. Also, the target used for the AC/A measurement was found to be optimally stimulating the accommodation which was verified by documenting the near accommodative responses with open field autorefractor for 30seconds prior to the response AC/A measurements. The individual mean lag of accommodation in CI subjects did not exceed 0.75D during this experiment and thus the high AC/A could not be attributed either to the accommodative status of the subjects or to the target characteristics.
The mean response AC/A ratio of 8.95 PD/D reported in our study correlates well with that of previous studies by Turner et al.25 who observed a mean response AC/A ratio of 1.3 MA/D (equivalent to 7.8 PD/D for a 60mm IPD) and Gwiazda et al.22 who reported 8 PD/D among emmetropic subjects and 11 PD/D among myopic children. In the formula that we adopted from Gwiazda et al.22 the denominator represents the difference between near and far accommodative response, and so a difference in accommodative lag of 0.25 D between two individuals for example could change the response AC/A ratio by around 1 PD/D. Influence of proximal vergence and its influence on accommodative lag could significantly impact the response AC/A ratio and this methodological issue needs to be explored further. Another issue with the distance-near heterophoria comparison technique is the unknown influence of proximal vergence that makes it difficult to correlate with gradient measurement techniques.5 This mandates that the results of each of these techniques in our study need to be interpreted separately pre/post VT and future studies should focus on the comparison of response AC/A ratio with different techniques, which is a limitation of the current study.
It is hypothesized that conventional orthoptic therapy such as pencil push-up exercises alone may not improve the vergence adaptation as the stimulus to both accommodation and vergence are congruent in such training.18,19 A structured in-office VT program where the therapy is designed in a way that the accommodation and vergence systems are incongruent may improve vergence adaptation and clinical vergence parameters.8,9,19 This is one reason as to why some studies including ours have shown changes in the crosslink ratio,16,20 whereas a few studies have not.17,26,27 We observed a significant change in near phoria in our study and this could be one reason for the observed increase in the AC/A ratio.13–15 But it would be worth to test the long term effects of training on the near phoria to comment about this association.
Effort and therapist interaction plays a significant role in vision therapy28–29 and thus a sham treatment group could have added value in terms of justifying the true effect of VT in improving the crosslink ratios. Also the sustainability of the improvement seen in the AC/A ratio needs to be assessed to comment about the long term change in the crosslink ratio. Though the observed changes in the crosslink ratio in the CI group were quite large, the repeatability of these ratios among the controls would have provided insight about the clinically significant difference in the AC/A ratio.
This study adds evidence to the fact that the efficacy of VT is not just limited to the improvement in clinical parameters of accommodation and vergence, but also transfers to improvements in the AC/A crosslink ratio.
ConclusionStimulus and response AC/A ratio increased post vision therapy in CI and reached comparable values as that of the control participants. A structured VT program training the accommodation and vergence systems in an incongruent manner can improve vergence parameters with concurrent change in the AC/A ratio.
Financial disclosuresNone.
Conflicts of interestThe authors have no conflicts of interest to declare.
Statement of publicationThis article has not been submitted/published elsewhere.
Dr. Krishna Kumar R, Principal, Elite School of Optometry for his suggestions with the manuscript revision.


