

The aim of this study was to determine the relationship between central corneal thickness (CCT) and axial length (AL) in adult Nigerians.
MethodsA total of ninety-five (n=95) subjects aged between 20 and 69 years consisting of 56 males and 39 females were recruited for this study. The CCT was measured by ultrasound pachymetry using SW-1000P ultrasound pachymeter (Tianjin Suowei Electronics Technologies LTD, China) and the axial length by A-Scan ultrasonography using I-2100 A Scan Biometer (Cima Technology Inc., USA).
ResultsThe average CCT and AL were 547.0±29.5μm and 23.5±0.70mm, respectively. Age inversely correlated with CCT (r=−0.32, p=0.02), but had no effect on AL (r=0.082, p=0.43). The association between CCT and AL showed an inverse trend but was not statistically significant (r=−0.10, p=0.32). Neither CCT nor AL was affected by gender (p=0.11; p=0.63, respectively).
ConclusionCCT decreases with age, but AL was not affected by age. The association between CCT and AL was not significant. Gender did not show any statistically significant effect on CCT and AL.
El propósito de este estudio fue la determinación de la relación entre el espesor corneal central (ECC) y la longitud axial (LA) en nigerianos adultos.
MétodosPara este estudio se seleccionó a un total de noventa y cinco personas (n=95), con edades comprendidas entre 20 y 69 años, de los cuales 56 eran varones y 39 mujeres. El ECC se midió mediante paquimetría ultrasónica, utilizando un paquímetro ultrasónico SW-1000P (Tianjin Suowei Electronics Technologies LTD, China), y la longitud axial mediante ultrasonografía A-Scan utilizando un biómetro A-Scan I-2100 (Cima Technology Inc., EEUU).
ResultadosLos valores del ECC y la LA medios fueron 547,0±29,5μm y 23,5±0,70mm, respectivamente. La edad guardó una correlación inversa con el ECC (r=−0,32, p=0,02), aunque no tuvo ningún efecto sobre la LA (r=0,082, p=0,43). La asociación entre el ECC y la LA mostró una tendencia inversa, aunque no fue estadísticamente significativa (r=−0,10, p=0,32). El sexo no influyó en el ECC ni en la LA (p=0,11; p=0,63, respectivamente).
ConclusiónEl ECC decrece con la edad, y la LA no se ve afectada por la misma. La asociación entre ECC y LA no fue significativa. El sexo no arrojó ningún efecto estadísticamente significativo en cuanto a ECC y LA.
The introduction of laser refractive procedures (photorefractive keratectomy [PRK] and laser in situ keratomileusis [LASIK]) brought about increasing interest in the determination and evaluation of differences in normal central corneal thickness (CCT). This interest has become more justified as central corneal thickness has been shown to affect measurement of intraocular pressure (IOP) by applanation tonometry, resulting in change in patient's management decisions. Also, the decision to perform some refractive surgical procedures such as PRK and LASIK is affected by the values of CCT.1 The influence of central corneal thickness on other ocular parameters began to be studied first in the light of its effect on intraocular pressure by conventional tonometry that was acknowledged by Goldmann and Schmidt.2 Several investigators have studied the CCT of indigenous Africans (Table 1). Axial length (AL) is the distance from the posterior corneal surface to an interference peak corresponding to retinal pigment epithelium/Bruch's membrane.3,4 Chen et al.5 found no statistically significant correlation between CCT and AL. They claimed that the eye elongates with sclera thinning but CCT may not be affected by the sclera thinning that occurs during eye elongation in myopia. However, Chang et al.6 hypothesized that there might be a stretching-related increase in corneal area associated with axial elongation and scleral thinning but could find no statistically significant relationship between AL and CCT in a Taiwan based clinical study. Any factor that affects the CCT could potentially influence the true value of measured IOP. Such factors have to be incorporated in the regression equation in order to predict their effects in the true assessment of CCT. This is important in the clinical diagnosis, management and monitoring of glaucoma therapy. The aim of this study was to investigate the variation of central corneal thickness with axial length in adult Nigerians with normal intraocular pressure. To the best of our knowledge there are no previously published data on this subject in blacks of African descents (Table 1).
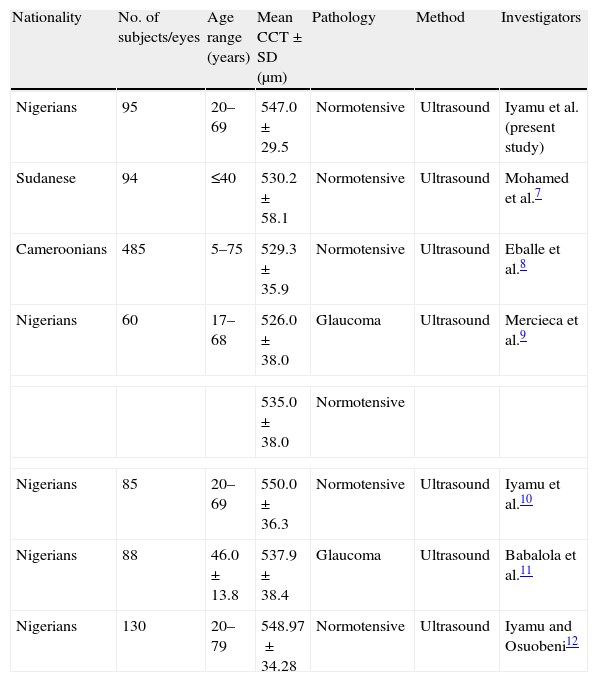
Central corneal thickness (CCT) in African subjects.
| Nationality | No. of subjects/eyes | Age range (years) | Mean CCT±SD (μm) | Pathology | Method | Investigators |
| Nigerians | 95 | 20–69 | 547.0±29.5 | Normotensive | Ultrasound | Iyamu et al. (present study) |
| Sudanese | 94 | ≤40 | 530.2±58.1 | Normotensive | Ultrasound | Mohamed et al.7 |
| Cameroonians | 485 | 5–75 | 529.3±35.9 | Normotensive | Ultrasound | Eballe et al.8 |
| Nigerians | 60 | 17–68 | 526.0±38.0 | Glaucoma | Ultrasound | Mercieca et al.9 |
| 535.0±38.0 | Normotensive | |||||
| Nigerians | 85 | 20–69 | 550.0±36.3 | Normotensive | Ultrasound | Iyamu et al.10 |
| Nigerians | 88 | 46.0±13.8 | 537.9±38.4 | Glaucoma | Ultrasound | Babalola et al.11 |
| Nigerians | 130 | 20–79 | 548.97±34.28 | Normotensive | Ultrasound | Iyamu and Osuobeni12 |
SD=standard deviation; ultrasound=ultrasound pachymetry.
This was an observational, prospective, cross-sectional study carried out at Optometry Clinic, Department of Optometry, University of Benin, Nigeria between October 2009 and January 2010. Informed consent was obtained from each participant after the procedure and possible outcomes were explained. The subjects recruited for the study were healthy adult Nigerians. The inclusion criteria were as follows, subject aged 20 years and above, no history of contact lens wear, corneal trauma, surgery or pathology (like infection, encroached pterygium, dystrophy, ectasia), no history of systemic diseases (like diabetes or hypertension) and associated rheumatoid arthritis, and intraocular pressure of 10–21mmHg (assessed by keeler Pulsair EasyEye non-contact tonometry [Keeler Instruments Inc., USA]). The study was approved by Departmental Research Ethics Committee (DREC) of the University in accordance with the tenets of Declaration of Helsinki. Participants were assigned to one of four age groups: 20–39, 40–49, 50–59, 60–69 years.
The central corneal thickness was measured by ultrasound pachymetry using SW-1000P ultrasound Pachymeter (Tianjian Suowei Electronics Technology Co., LTD, China. Probe frequency=20MHz, velocity=1640m/s), and the axial length by A-Scan ultrasonography using I-2100 A Scan Biometer (Cima Technology Inc., USA. Probe frequency=10MHz, velocity=1550m/s).
ProcedureThe subject was comfortably seated with the head upright and ayes in the primary position of gaze. The probe was sterilized with 70% alcohol and allowed to air-dry. A drop of topical anaesthetic (Tetracaine HCl 0.1%) was instilled in subject's eye. The probe was carefully aligned perpendicularly to and lightly applanating the cornea. At least ten readings are continually taken and the average calculated as the measured central corneal thickness (expressed in microns).
For the axial length measurement, subject's and instrument preparations are same as in pachymetry. The axial length was displayed on liquid crystal display (LCD) screen through output interface. Three measurements were taken for each subject and the average calculated as the measured axial length (expressed in millimetres). All measurements were taken between 10.00am and 12.00 noon. All measurements were taken by the same observer to avoid inter-observer bias.
Statistical analysesSPSS ver., 17.0 (SPSS Inc., Chicago, IL, USA) and Statgraphics Plus ver., 5.1 (Statpoint Technologies Inc., Warrenton, VA, USA) for the PC were used for data analyses and preparation of figures. The central corneal thickness and axial length between the right and left eyes were highly correlated [Pearson correlation coefficients were as follows: CCT=0.97, AL=0.96]. And to avoid duplication of results, only the right eye findings were further used for analyses. The measured variables were tested for normality with the Kolmogorov–Smirnov Z test (normal distribution when the p-value is >0.05). Analysis of variance (ANOVA) was used to compare variables across age groups. Gender-related differences in measured variables were tested with Student's t-test (unpaired). The relationship between variables was tested with regression analysis. Statistical significance was declared when p-value is ≤0.05.
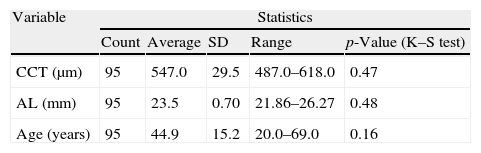
ResultsA total of ninety-five (n=95) subjects aged between 20 and 69 years, with mean age 44.9±15.2 years, consisting of 56 males and 39 females were enlisted in this study. Table 2 shows the descriptive statistics of the measured variables.
Descriptive statistics of measured variables.
| Variable | Statistics | ||||
| Count | Average | SD | Range | p-Value (K–S test) | |
| CCT (μm) | 95 | 547.0 | 29.5 | 487.0–618.0 | 0.47 |
| AL (mm) | 95 | 23.5 | 0.70 | 21.86–26.27 | 0.48 |
| Age (years) | 95 | 44.9 | 15.2 | 20.0–69.0 | 0.16 |
SD=standard deviation; K–S=Kolmogorov–Smirnov Z test; p-value=statistical significance.
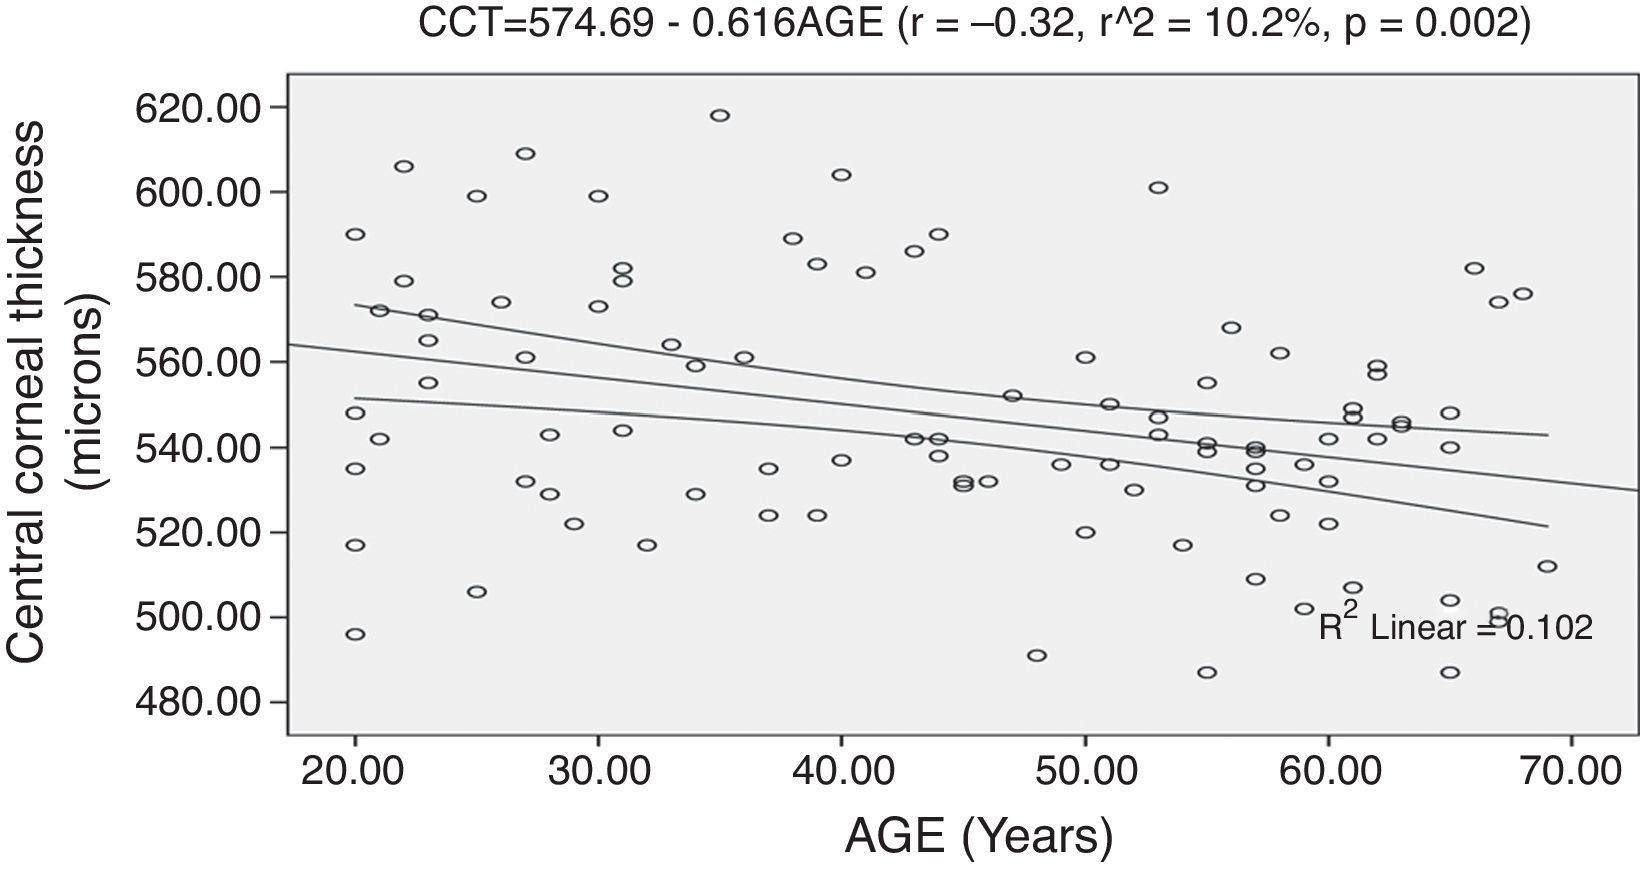
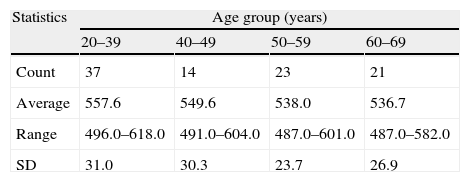
The mean CCT of the study population was 547.0±29.5μm. ANOVA performed on the mean difference in CCT across age groups shows statistical significance (F=3.45, df=3, 91, p=0.02). Post hoc test using Fisher's least significant difference (LSD) shows that the mean CCT of the age group 20–39 years was statistically higher than the other age groups. The differences in mean CCT of 19.6μm (between age groups 20–39 and 50–59 years), 20.9μm (between age groups 20–39 and 60–69 years) were statistically significant (p<0.05). However, the mean differences of 11.6μm (between 40–49 and 50–59 years) and 12.9μm (between 40–49 and 60–69 years) were not statistically significant (p>0.05). The least difference in mean CCT of 1.2μm was seen between age groups 50–59 and 60–69 years. Table 3 shows the descriptive statistics of CCT according to age groups (Table 3).
The regression analysis performed on CCT and age shows a statistically significant inverse correlation (r=−0.32, r2=10.2%, p=0.002). The model as fitted explains 10.2% of the variability in CCT. The model is represented by: CCT=574.69−0.616AGE. From the linear regression equation, a prediction of approximately 6.0μm decrease in CCT for every decade is made. Fig. 1 shows the correlation of CCT and age with 95% confidence interval of the linear regression line.
Mean AL, effect of age on AL
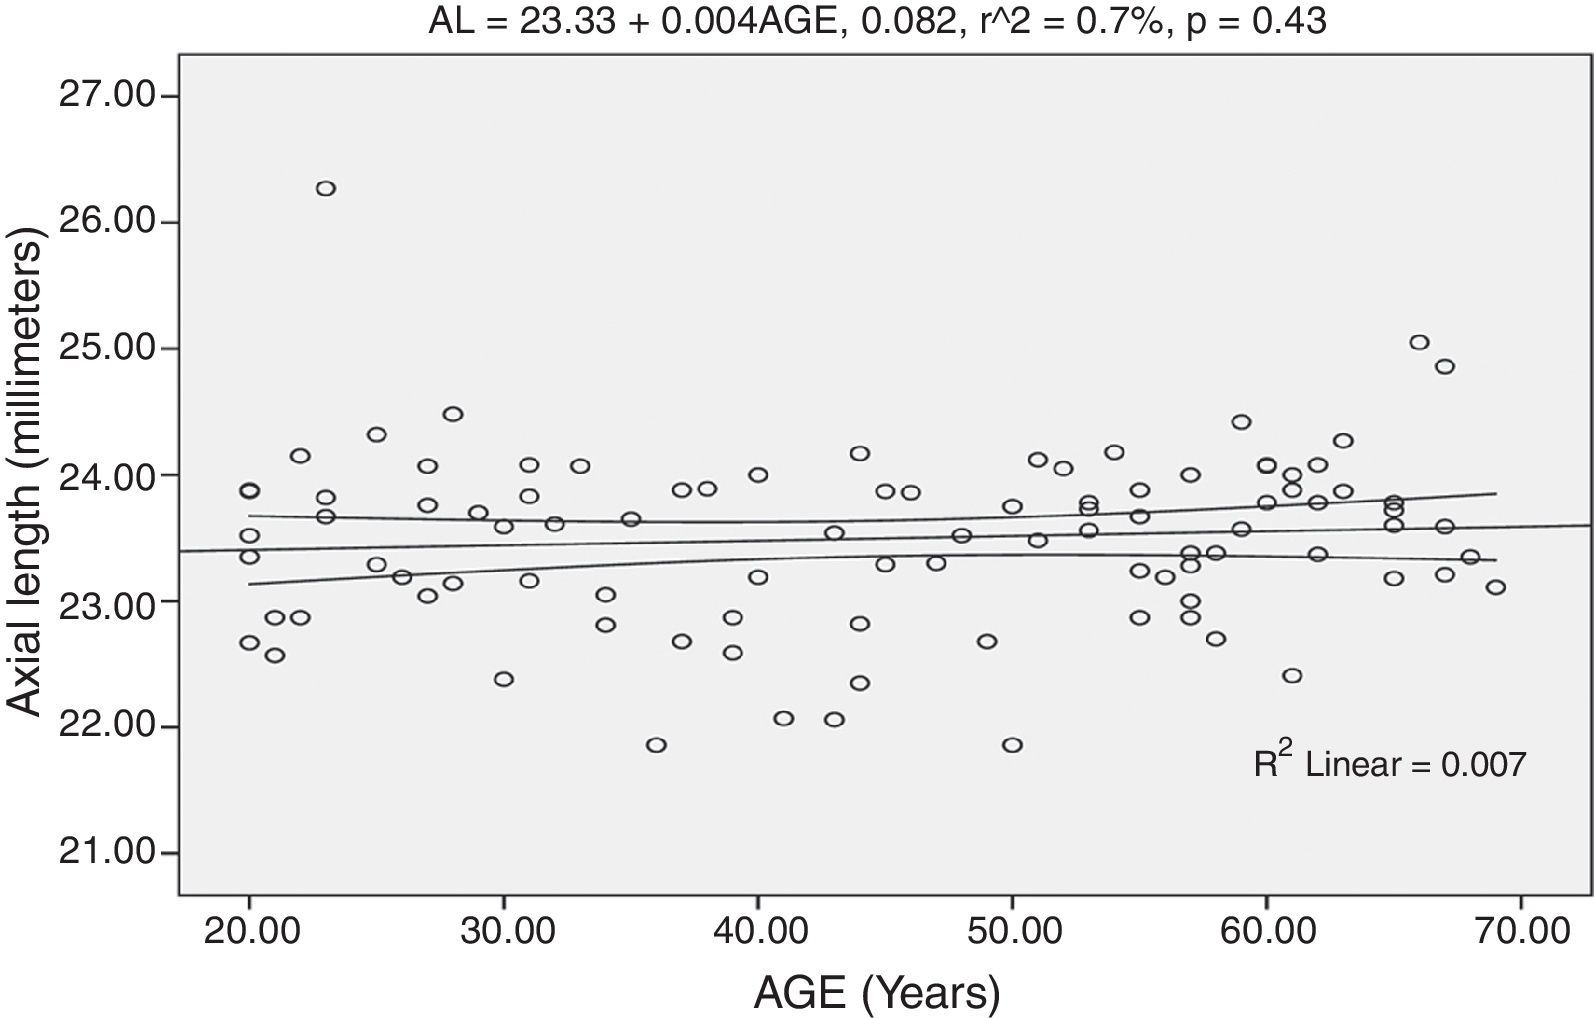
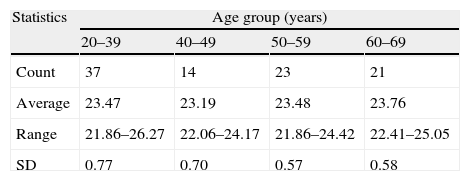
The mean AL was 23.50±0.70mm. Analysis of variance performed on the mean difference in AL across the age groups was not statistically significant (F=2.06, df=3, 91, p=0.11). Table 4 shows the descriptive statistics of axial length across the age groups.
The regression analysis performed on AL and age shows no statistical significance (r=0.08, p=0.43). The model was represented by: AL=23.33+0.004AGE. Fig. 2 shows the correlation of AL and age with the 95% confidence interval of the linear regression line.
Association of CCT and AL
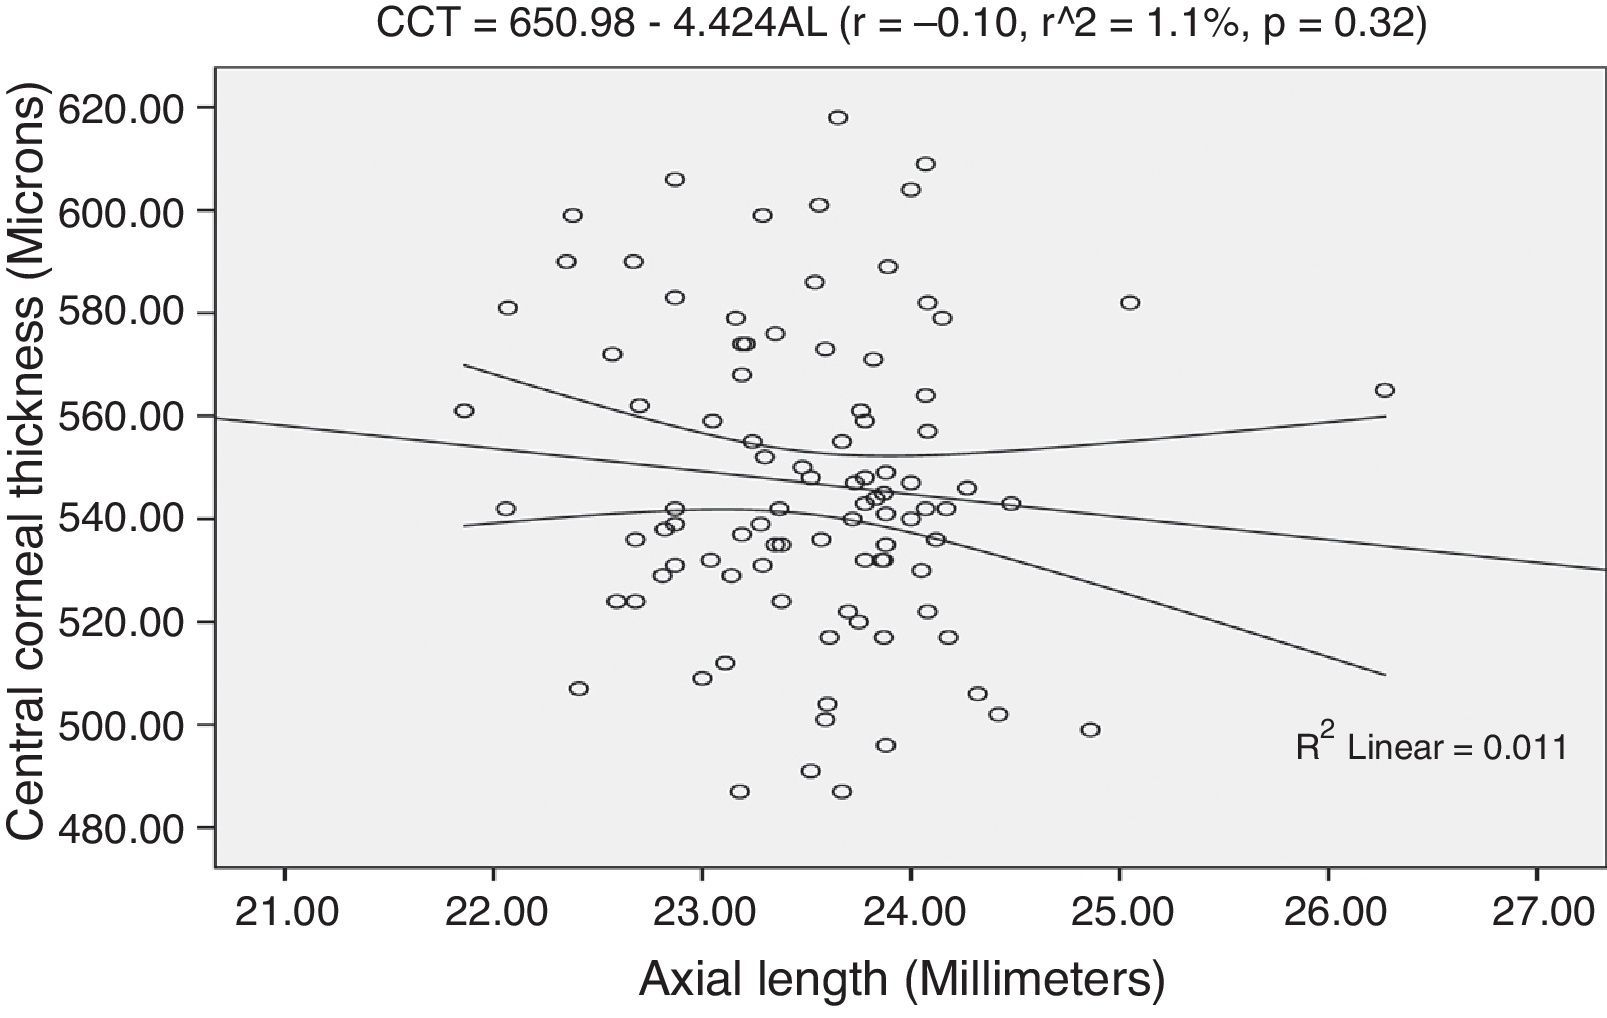
The regression analysis performed on CCT and AL shows an inverse association though not statistically significant (r=−0.10, r2=1.1%, p=0.32). The regression model is represented by: CCT=650.98−4.424AL. The model as fitted explains 1.1% of the variability in CCT. From the linear regression equation, for every 1.0mm increase in AL, the CCT decreases by approximately 4.2μm. Fig. 3 shows the association between CCT and AL with 95% confidence interval of the regression line.
Effect of gender on CCT and AL
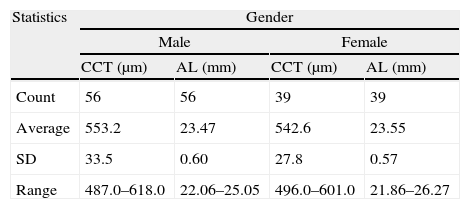
The difference in mean CCT of 10.6μm between males (mean, 553.2±33.5μm; range, 487.0–618.0μm) and females (mean, 542.6±27.8μm; range, 496.0–601.0μm) was not statistically significant (unpaired t-test: t=1.61, df=93, p=0.11). Similarly, the difference in mean AL between males (mean, 23.47±0.60mm; range, 22.06–25.05mm) and females (mean, 23.55±0.57mm: range, 21.86–26.27mm) was not significant (t=−0.50, df=93, p=0.63). Table 5 shows the descriptive statistics of CCT and AL according to gender.
Descriptive statistics of central corneal thickness and axial length according to gender.
| Statistics | Gender | |||
| Male | Female | |||
| CCT (μm) | AL (mm) | CCT (μm) | AL (mm) | |
| Count | 56 | 56 | 39 | 39 |
| Average | 553.2 | 23.47 | 542.6 | 23.55 |
| SD | 33.5 | 0.60 | 27.8 | 0.57 |
| Range | 487.0–618.0 | 22.06–25.05 | 496.0–601.0 | 21.86–26.27 |
SD=standard deviation.
The human cornea is thinner at the centre and gets progressively thicker towards the periphery which comprises the superior, nasal, inferior and temporal quadrants. The thickness of the cornea is largely determined by the degree of hydration.13 Studies have shown that the peripheral corneal thickness (PCT) in normals range from 0.68 to 0.89mm, while CCT from 0.52 to 0.61mm.13,14 Gromacki and Barr14 have shown that in diseased condition like keratoconus the defining factor was CCT as it varies between normals and keratoconus patients while the PCT demonstrated no significant difference.14 However, the differential between CCT and PCT of keratoconic patients was significantly higher than that of normals and this was considered pathognomonic of the disease.14 Studies7,8,11 have reported thinner CCT in patients with open-angle glaucoma.
Central corneal thickness has become a very important ocular parameter of study due to its importance as an indicator of corneal health status, its effect on applanation tonometry, and decision on refractive surgery is dependent on it.1 There is no general consensus with respect to how CCT relates to other ocular parameters, one of which is axial length of the eyes. These two ocular parameters have been shown to be associated with glaucoma.15–17 The average central corneal thickness of 547.0±29.5μm from this study is comparable to CCT values for a Nigerian population obtained from previous studies.10,18–20 However, lower CCT values have been reported for Nigerians and other Africans with normal IOP.7–9 This mean CCT value of 547.0±29.5μm is only marginally higher than the calculated ultrasound pachymetry average of 544 um in the meta-analysis undertaken by Doughty and Zaman21 for white individuals. The difference in mean CCT across age group was statistically significant, with the highest mean CCT of 557.6±31.0μm found in the younger age group (20–39 years) and the lowest mean CCT of 536.7±26.9μm in the 60–69 years group. The regression analysis performed on CCT and age showed a statistically significant negative correlation (r=−0.32, p=0.002). From the regression equation (CCT=574.69–0.616AGE), a decrease of approximately 6.0μm in CCT for every decade was predicted. This was consistent with the studies of Wong et al.1 and Hawker et al.22 who reported negative correlation between CCT and age (r=−0.237, −0.63 respectively, both p<0.05). Iyamu et al.10 also reported a statistically significant negative correlation between CCT and age (r=−0.25, p=0.021). The model was represented by CCT=571.93–0.513AGE. From this equation, a decrease of approximately 5.0μm in CCT for every 10-year increase in age was predicted, and this was very similar to that obtained in this study. This change in CCT with age can be attributed to changes in the structural biomechanical properties of the cornea that occur with age. However, other studies7,18,20 reported that the association between CCT and age was not significant statistically. Within the meta-analysis-generated average and variance, age had no obvious impact on CCT measures for white individuals, although an age-related decline in CCT is evident for non-whites.21 Two reasons have been put forth to explain divergent opinions of authors on the association between CCT and age. One of such is the issue of age distribution, and the other is the technique for assessing CCT. The ultrasound and optical pachymetry have been shown to give different CCT values for same subjects.23,24 From this study, the difference in mean AL across age group was not statistically significant (p=0.11). The association between axial length and age was not significant (r=0.08, p=0.43). This finding was consistent with the claim of Shufelt et al.25 that there were no age-related differences in axial length (p>0.05). The explanation for this is that once the eye has achieved its adult size, little change occurs in the axial length during adulthood and with ageing. However, this was not consistent with the study of Wong and colleagues,26 who reported shorter axial length in older persons which was attributed to cohort effect. The regression analysis performed on CCT and AL shows no statistically significant correlation (r=−0.10, p=0.32). This finding was in agreement with other studies27–29 with subjects from different nationalities (Greek, Mixed population). Similarly, Chang et al.6 reported an inverse trend in the association between CCT and axial length though not statistically significant (r=−0.11, p=0.14). They hypothesized that the trend seen was attributed to the axial elongation of the eyeball that increases the surface area of the cornea leading to thinner corneal stroma with consequent reduced corneal thickness. Chen et al.5 claimed that no true association between the variables could be expected in the general population from the small sample size used by Chang and colleagues.6 Celorio and Pruett30 claimed that during eyeball elongation the sclera thins but with greater involvement of the posterior segment, the corneal thickness is not affected. Sanchis-Gimeno et al.31 assessed the CCT and PCT (3mm from the visual axis) with Orbscan Topography System II in normal Spanish population and mean CCT and PCT of 543.5 and 624.9μm were obtained.
Gender-related differences in mean CCT and axial length were not statistically significant (Table 5). Sanchis-Gimeno et al.31 also reported that CCT and peripheral corneal thickness was not affected by gender in a Spanish population.
In conclusion, there was an inverse association between CCT and age, but axial length was not significantly correlated with age. There was no significant relationship between central corneal thickness and axial length. Neither central corneal thickness nor axial length was affected by gender.
Conflicts of interestThe authors have no conflicts of interest to declare.


