


To evaluate whether tobacco affects color vision in young moderate smokers.
MethodsChromatic mechanisms of 13 moderate smokers (10–20 cigarettes/day and at least 5 years smoking) and 17 non-smokers in the 18–35 age range were assessed with the Farnsworth-Munsell 100-hue (FM100h) test and short wavelength automated perimetry (SWAP).
ResultsFM100h Total Error Scores (TES) were higher for smokers, and although differences were not significant (p = 0.14), a linear model with principal component analysis was able to explain 95% of the variance in TES and red-green partial error scores, though not in blue-yellow partial error scores (p = 0.07), using the number of years as smokers and the number of cigarettes/day as predictors. SWAP sensitivity values were globally worse (p = 0.002) for smokers (25.7 + 6.2 dB) than for non-smokers (26.7 + 6.2 dB). In the upper visual hemifield sensitivity, total deviation and pattern deviation values were worse for smokers (p < 0.001). Differences in mean defect and pattern standard deviation were not significant (p > 0.05 in both cases). The number of out-of-limits points in the total difference and pattern difference map were significantly larger for smokers. After correcting for multiple comparisons, only the differences in the upper visual hemifield were significant.
ConclusionsThis pilot study suggests that even young moderate smokers show small sensitivity loss in the blue-yellow mechanism, it is statistically significant, restricted to the upper visual hemifield. This corresponds to a retinal region where literature reports a lower density of retinal ganglion cells and where, therefore, the chromatic mechanisms would be more fragile.
Tobacco contains more than three thousand toxic substances and heavy metals (nicotine, nitrosamines, benzene, carbon monoxide …)1–4 and, given that the associated health risks include harm to the visual system,1–4 a smoking habit is an element to take into account during anamnesis in an optometric exam. Smoking is associated with early onset or the development of ocular pathologies such as age macular degeneration,1–4 cataracts,1,3 thyroid ophthalmopathy,1–3 anterior ischemic optic neuropathy,3 toxic amblyopia (alcohol-tobacco amblyopia),3,4 hypertensive retinopathy,3 uveitis,1 ocular surface damage1,4,5 and macular pigment losses.2 In addition, it is known that hypoxia in the retina reduces chromatic sensitivity in the mesopic range6 and that carbon monoxide poisoning provokes defects in the visual field (central or paracentral scotomas), causing a toxic neuropathy similar to tobacco-alcohol amblyopia.7
It seems, therefore, reasonable to study if tobacco affects the visual pathways, specifically color vision. Dose-dependent color vision alterations, as assessed by color ordering tests, have been observed in the central retina. Measurements with the desaturated Roth 28-Hue test, reveal differences in error score between non-smokers, smokers of less than 20 cigarettes a day and smokers of more than 20 cig / day,8 and Bimler and Kirkland9 found that smokers in the 20–34 age range who had been smoking at least a packet of cigarettes per day, for at least a year, had statistically less sensitivity to red–green differences in the d-15 test. On the other hand, non-selective discrimination losses in smokers have also been reported.10
Previous studies with groups of smokers classified according to the number of cigarettes smoked per day, using red-on-white11 or blue-yellow12,13 (SWAP) perimetry, found foveal sensitivity losses in moderate smokers (maximum 20 cig/day),12 while in chronic smokers (minimum 20 cig/day) they found paracentral scotomas.11
Our aim is to assess the effect of tobacco in the color vision of young moderate smokers, and particularly in the blue-yellow mechanism. As we have described above, selective losses in this mechanism have been reported in the literature on tobacco smokers and it would be interesting to determine how early this damage is produced. Though it cannot be discarded that preferential damage to the blue-yellow mechanism may reflect only a greater sensitivity of the measuring device,14,15 the characteristics of the blue-yellow mechanism would lead to expect a greater fragility than the red-green mechanism.16–17 It has been argued that the small number of S cones causes damage to the cones to have a comparatively greater effect than in the RG mechanism (paucity hypothesis14). Its L and M cone inputs would make the BY mechanism sensitive to damage in any kind of cones.18 Finally, it has also been suggested that the S mechanism may be more vulnerable to attacks by toxic substances or the action of pathologies than RG mechanism.19 Alteration in the transmittance of pre-receptoral media could also be selective for the blue-yellow mechanism.20
Material and methodsThis pilot study adheres to the tenets of the Declaration of Helsinki for Research Involving Human Subjects and was approved by the University of Valencia Institutional Review Board.
ObserversThirteen smokers, 8 women (mean age 26 ± 3 years) and 5 men (mean age 28 ± 2 years) and 17 non-smokers, 7 women (24 ± 3 years) and 10 men (26 ± 2 years) were enrolled. One observer with congenital color deficiency was excluded. In average, participants in the smoking group consumed 12 ± 3 cigarettes per day, and had been smoking for 10 ± 3 years. All observers signed an informed consent to participate in the study.
Instruments and measurementsAll the observers underwent an exhaustive ophthalmological exam, including a questionnaire about health habits, full anamnesis, macula and optic nerve OCT (3D-OCT 2000 Topcon) exploration, slit-lamp exam (SL-2 F Topcon), measurement of the best corrected visual acuity (BCVA) and determination of the intraocular pressure (IOP) with a non-contact tonometer (TRK-1 P Topcon). All measurements were conducted in the afternoon.
Inclusion criteria for both groups were age between 18 and 35 (young observers without presbyopia), 0.0 logMAR or better BCVA, IOP below 21 mmHg, absence of corneal opacities or irregularities, ocular pathologies, previous ocular surgery, systemic pathologies affecting the visual system or congenital color vision deficiencies, or use of any drug that could affect color vision or diminish response capacity.
Non-smokers were required not to have smoked more than 100 cigarettes sporadically throughout life. Inclusion criteria for smokers were a history of smoking of at least 5 years consuming 10–20 cigarettes per day. No distinction was made between cigarettes and hand rolling tobacco because both are equally harmful.21
Data included in the analysis was obtained from the observer's sensory dominant eye, determined by the +2 diopter positive lens method.22 BCVA was measured, and the subject wore the optical compensation so determined throughout the experiments. Most subjects did not need any optical compensation. The FM100 h was taken with the subjects wearing their own spectacles, if needed, and the colored chips placed inside a GretagMacBeth cabin, using the D65 illuminant. SWAP perimetry was carried out with a Humphrey Field Analyzer (model 745i, with a 24−2 threshold technique) (Zeiss, Germany) and the subject was compensated using narrow-rim lenses placed in the perimeter’s lens holder, in order to minimize rim effects. None of the lenses used had blue-blocking filters. To reduce learning effects in both tests, the measurements were made first in the non-dominant eye, and then in the dominant eye.23
Data and statistical analysisFM100 h results were plotted using Dain and Birch’s criterion and Total Error Scores (TES)23 were computed using a Matlab-based program developed by researchers of Valencia and Alicante Universities.24 TES scores were computed by summing the partial error scores for every cap. Total partial error scores were computed for the red-green (RG TES) axis using caps 13–33 and 55–75, and for the blue-yellow (BY TES) axis using caps 1–12, 34–54, and 76–85.25
The sensitivity of the blue-yellow mechanism was measured with SWAP perimetry in 54 positions of the visual field with a 24−2 threshold technique. The points close to the blind spot, which could distort the result, were excluded from the analysis. Sensitivity (S), total deviation and pattern deviation maps (TD and PD), and their corresponding probability maps (pTD and pPD) were used to study localized losses, after being transformed into right eye maps. pTD and pPD were binary versions of the probability maps: locations were labelled either as “normal” or “out-of-normal-limits” depending on whether the percentage of normal subjects with TD or PD values equal or worse than the subject was higher or lower than 5%, respectively. Two global parameters, the mean deviation (MD) and the pattern standard deviation (PSD) were included in the analysis.26
Statistical analysis was carried out with IBM SPSS Statistics 20 (IBM Corp., Armonk, NY) and JASP 0.12.2.0 (JASP Team (2020)). Normality of the distributions was checked separately for the smoker and non-smoker groups with the Shaphiro-Wilk test, given the small number of samples. The t-test was used for variables that followed the normal distribution and the U-Mann-Whitney test for those who did not. The Square-Chi test was used to check for differences in the number of anomalous field points between smokers and non-smokers. Before comparing smokers with non-smokers, we checked with each parameter whether gender differences would bias the results. Effect size is reported using the rank-biserial correlation (r)27 and its 95% confidence interval (95% CI).
The number of comparisons performed is large (52 locations x 3 parameters, plus six global parameters). The Benjamini-Hochberg (BH) correction was used to account for multiple comparisons, with a false detection rate of 0.05. Under these conditions, the significance level for the test with the lowest p-value would be 0.0003.
ResultsAll the scale variables failed the normality test at least in one of the groups or in at least one location in the SWAP maps. Therefore, the U Mann-Whitney test was used for comparisons. No statistically significant gender differences were found in this study.
Table 1 summarizes the results obtained with the FM100 h test. Although average total and partial error scores were worse in smokers than in non-smokers, effect sizes can be considered to be zero (see r values and their 95% confidence intervals in Table 1) and the differences between groups were not significant (p > 0.05). A linear model shows that the number of cigarettes per day and the number of years the subject has been smoking do not significantly determine TES, RG or BY. However, principal component analysis (Table 2) shows that a combination of both parameters significantly affect TES and RG (p = 0.02, p = 0.004, respectively) but not BY (p = 0.07).
Mean and standard deviation of Total Error Score (TES), and partial red-green (RG) and blue yellow (BY) scores for non-smoker and smoker group. Effect size is measured by the rank-biserial correlation (r). 95% confidence intervals (95% CI) for the size effect are reported. Effect sizes and differences between groups were not statistically significant (p < 0.05).
| TES | RG | BY | |
|---|---|---|---|
| Smoker | 60 + 60 | 25 + 27 | 35 + 36 |
| Non-Smoker | 33 + 16 | 9 + 7 | 24 + 11 |
| r [95% CI] | −0.05 [−0.459 0.377] | −0.25 [−0.605 0.189] | 0.128 [−0.308 0.519] |
| p value | 0.14 | 0.07 | 0.29 |
Coefficients for the linear models with principal component analysis to predict the values of total error score (TES), red-green error score (RG), blue-yellow error score (BY), mean deviation (MD) and pattern standard deviation (PSD). The variable T is 0.7789*C+0.6271*Y, where C is the number of cigarettes per day and Y the number of years as a smoker. SE is the standard error of the coefficients and t is the t-statistic for each coefficient to test whether the coefficient is zero. t is computed as the quotient of the estimate of the parameter and its error. TES and RG significantly increase with T. Neither C nor Y separately can account for the changes in any of the parameters.
| Parameter | Predictors | Estimate | SE | t | p-value |
|---|---|---|---|---|---|
| TES | Intercept | 45.067 | 7.2671 | 6.2015 | 1.1e-06 |
| T | 2.286 | 0.90391 | 2.529 | 0.017 | |
| RG | Intercept | 16.067 | 3.2004 | 5.0202 | 2.6e-05 |
| T | 1.2406 | 0.39807 | 3.1164 | 0.004 | |
| BY | Intercept | 29 | 4.3968 | 6.5957 | 3.7e-07 |
| T | 1.0454 | 0.54689 | 1.9116 | 0.07 | |
| MD | Intercept | −0.72533 | 0.51692 | −1.4032 | 0.17 |
| T | −0.023867 | 0.064296 | −0.3712 | 0.71 | |
| PSD | Intercept | 3.0043 | 0.29692 | 10.118 | 7.4e-11 |
| T | 0.050282 | 0.036932 | 1.3615 | 0.18 |
The mean values obtained for MD in smokers and non-smokers were-1.20 + 2.91 dB and −0.36 + 2.72 dB (r = 0.213, pointing to a small effect, but with a 95% CI [−0.205,0.565], including zero), respectively, and for PSD 3.53 + 1.11 dB and 2.61 + 1.90 dB (r = −0.333, pointing to an intermediate effect with higher values for smokers, but with the 95% CI, [−0.640,0.080], also including zero). Although values for smokers were worse, indicating both lower overall sensitivity (MD) and higher irregularity (PSD), the differences between groups were not statistically significant (p = 0.42 for MD and p = 0.11 for PSD) and the small differences between groups could not be explained using the number of cigarettes per day and the number of years as a smoker as predictors.
According to Pearson's chi-square test results, the number of points declared as out of limits in the total deviation and pattern deviation maps for the smoking group was significantly larger than for the non-smoking subjects.
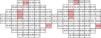
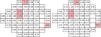
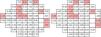
Figs. 1–3 show point-to-point comparisons between smokers and non-smokers for sensitivity, total deviation and pattern deviation values. SWAP perimetry does not compute TD and PD values close to the blind spot, but in the case of sensitivity only the blind spot was excluded. In the TD and PD maps we have excluded an additional point, for which the standard variation was abnormally large. For the highlighted positions, differences between the two samples were statistically significant (p < 0.05). If the sensitivities in all locations are considered, overall sensitivities differences between groups were small, 26.7 + 6.2 dB for non-smokers and 25.7 + 6.2 dB for smokers, with r = 0.102 (95% CI [0.045,0.158] and p = 0.002 in the Mann-Whitney test, but suggest a slight sensitivity loss in smokers.
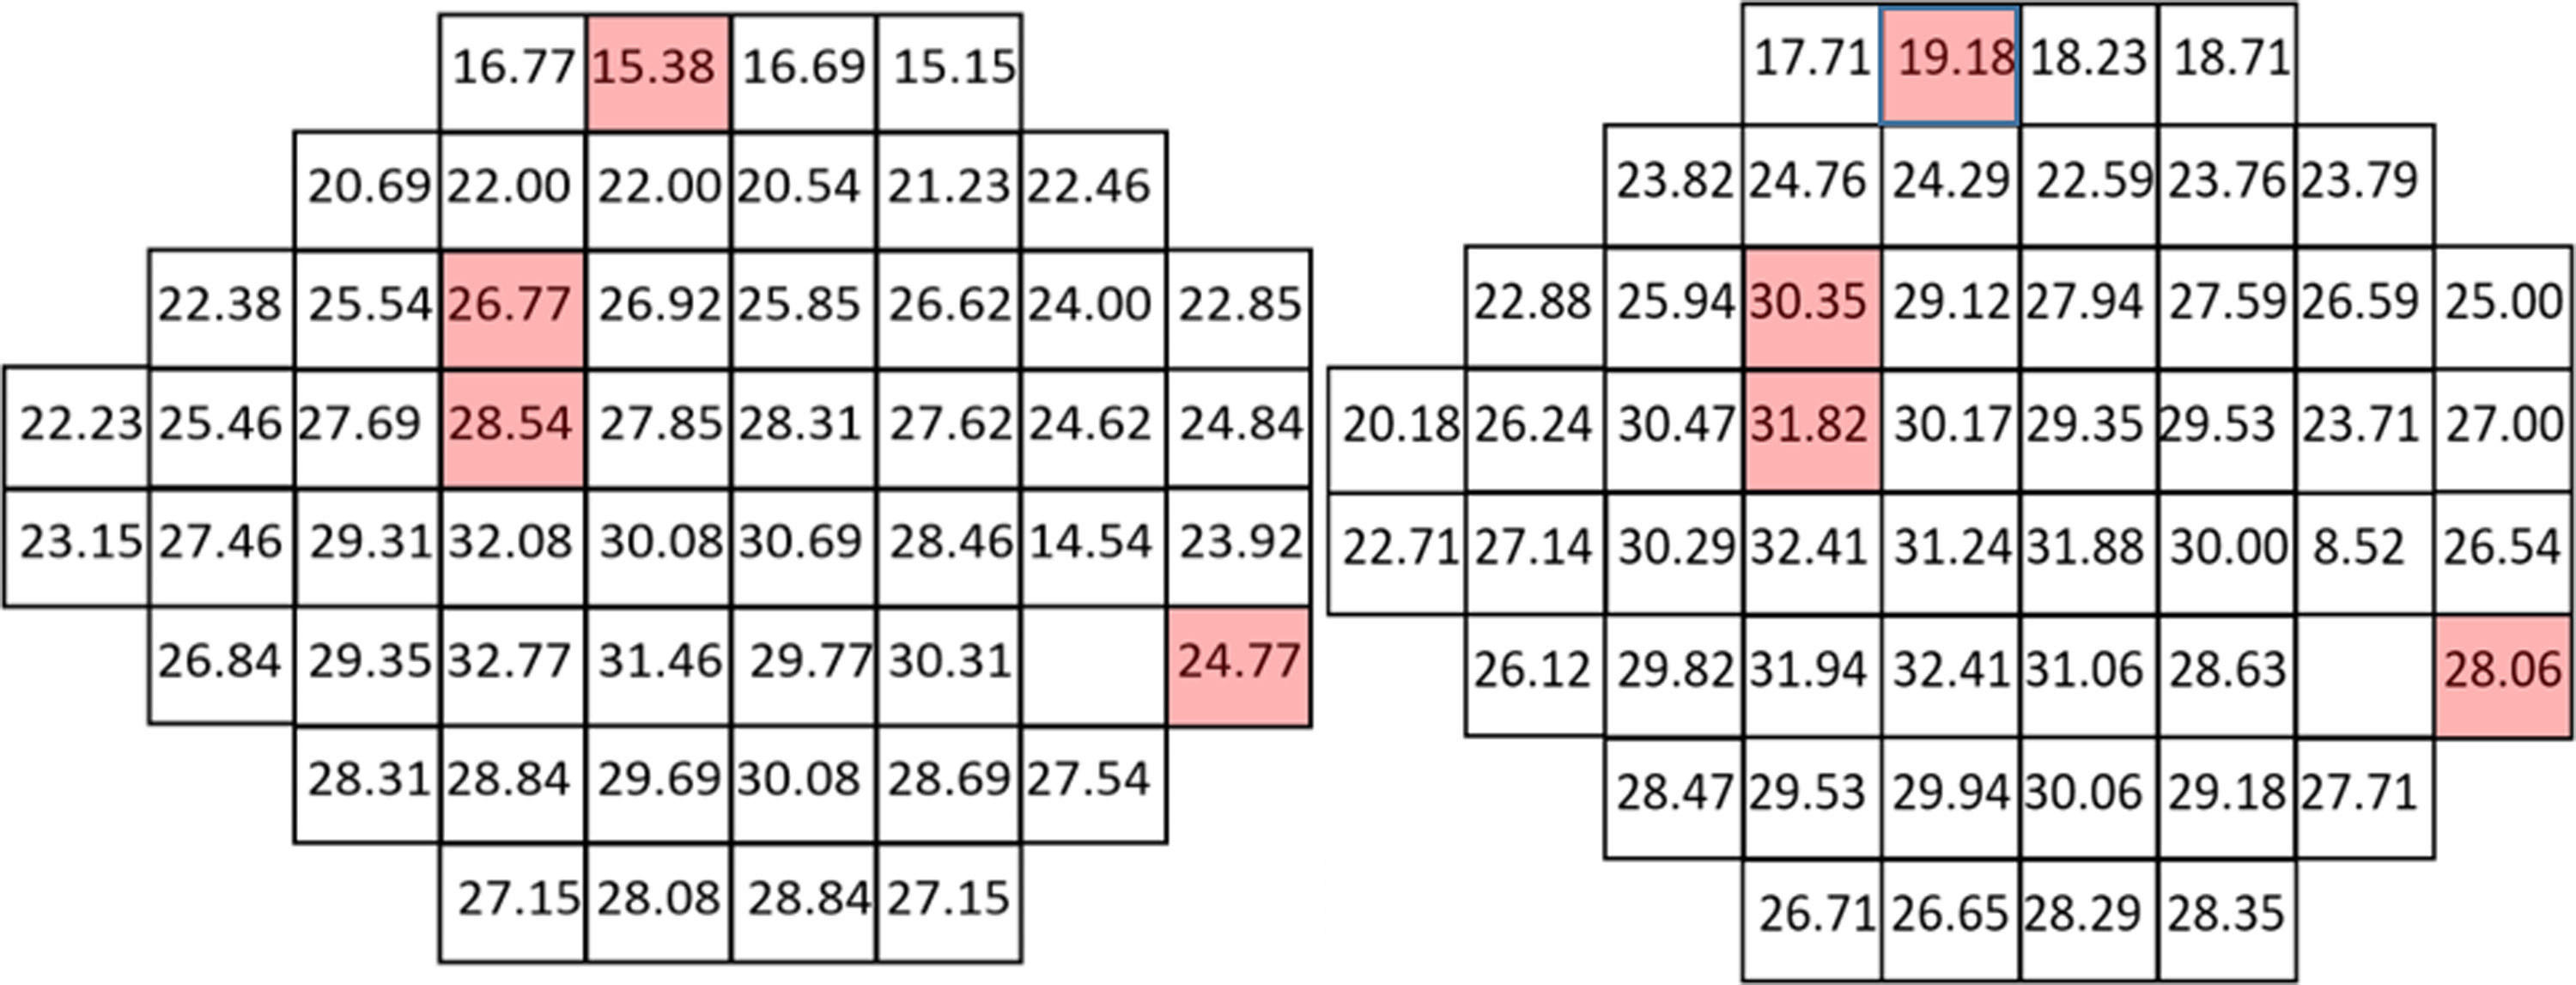
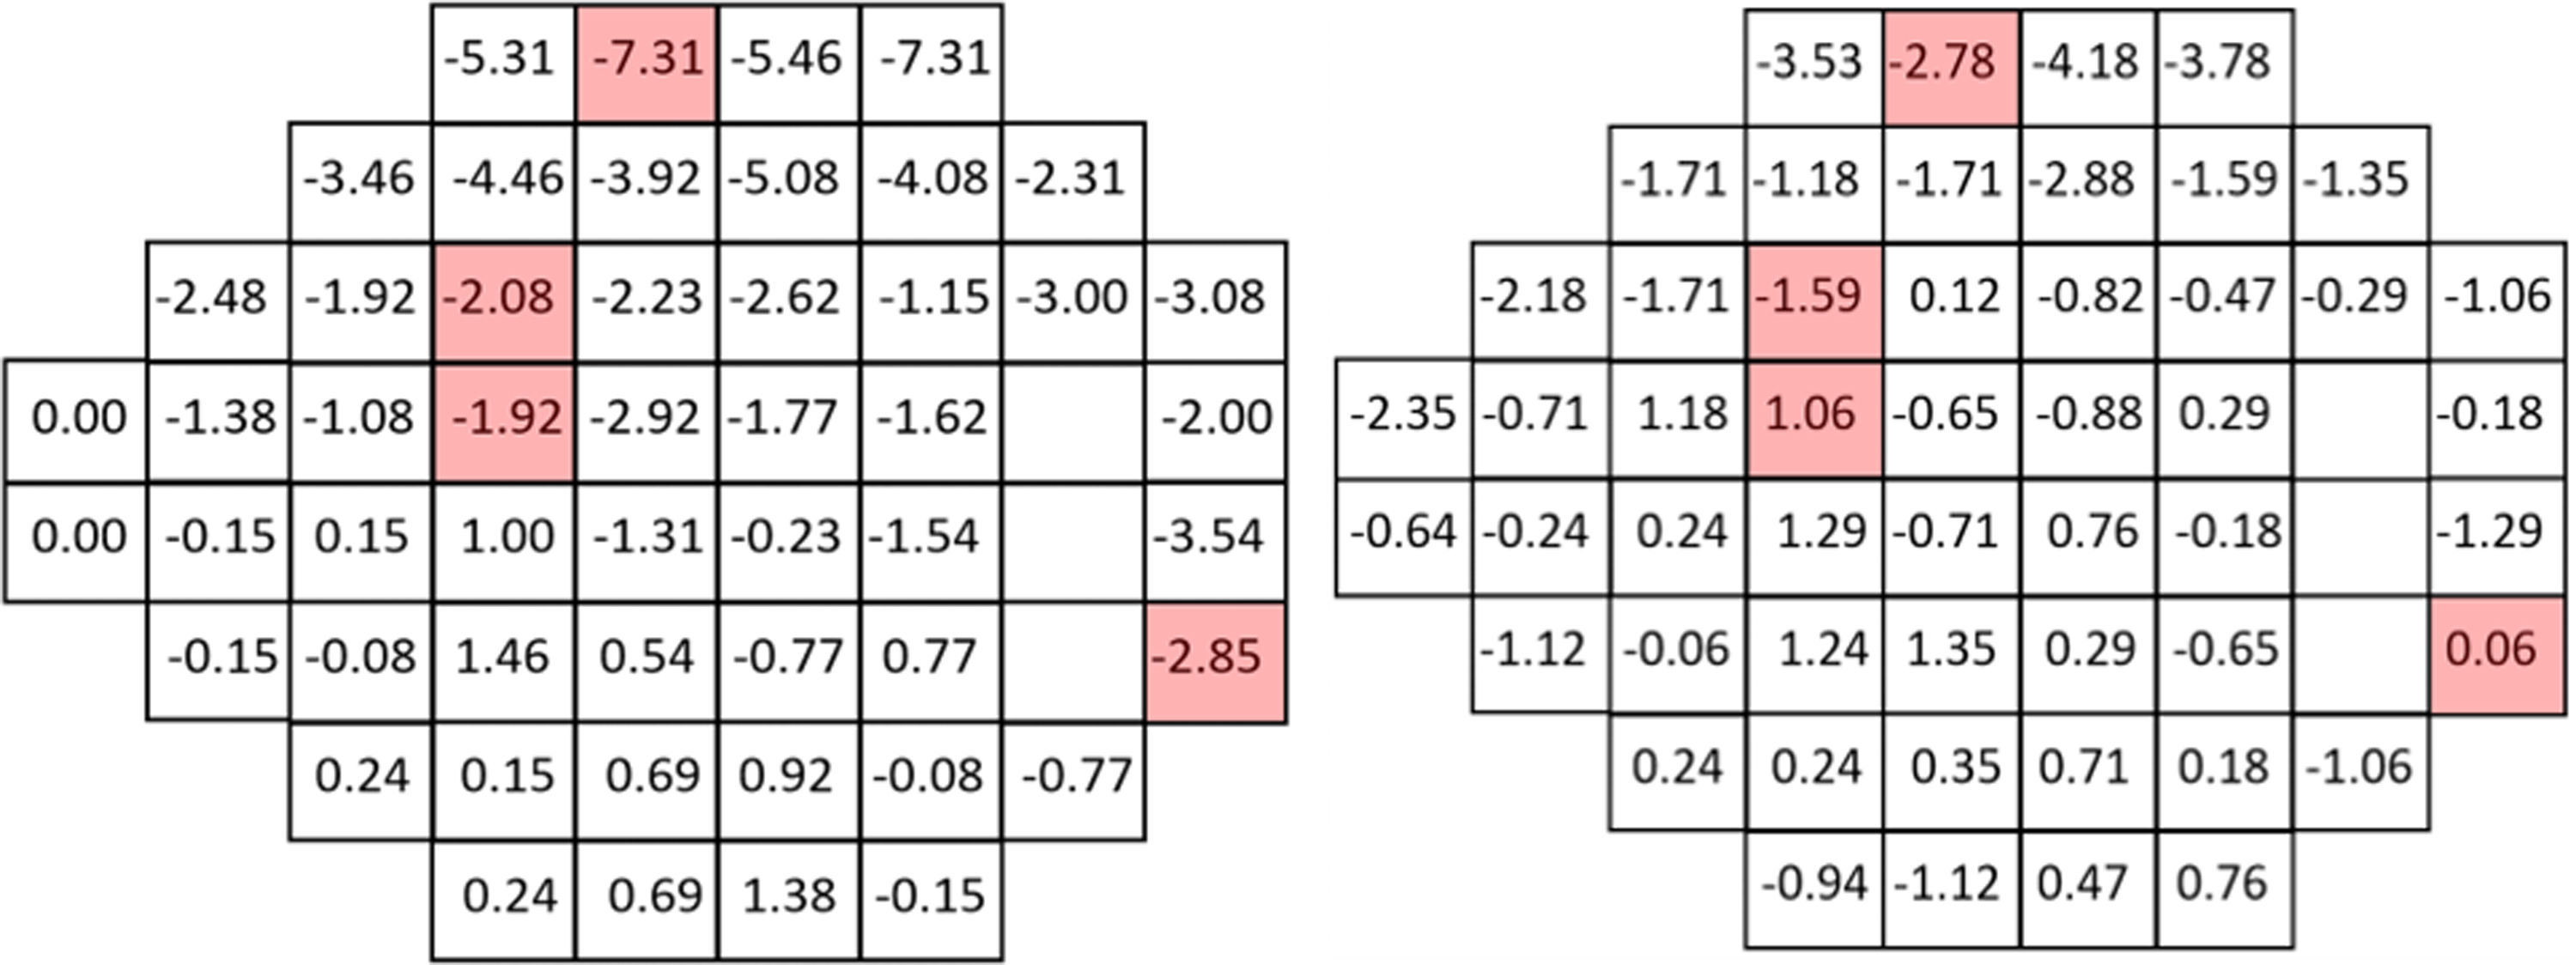
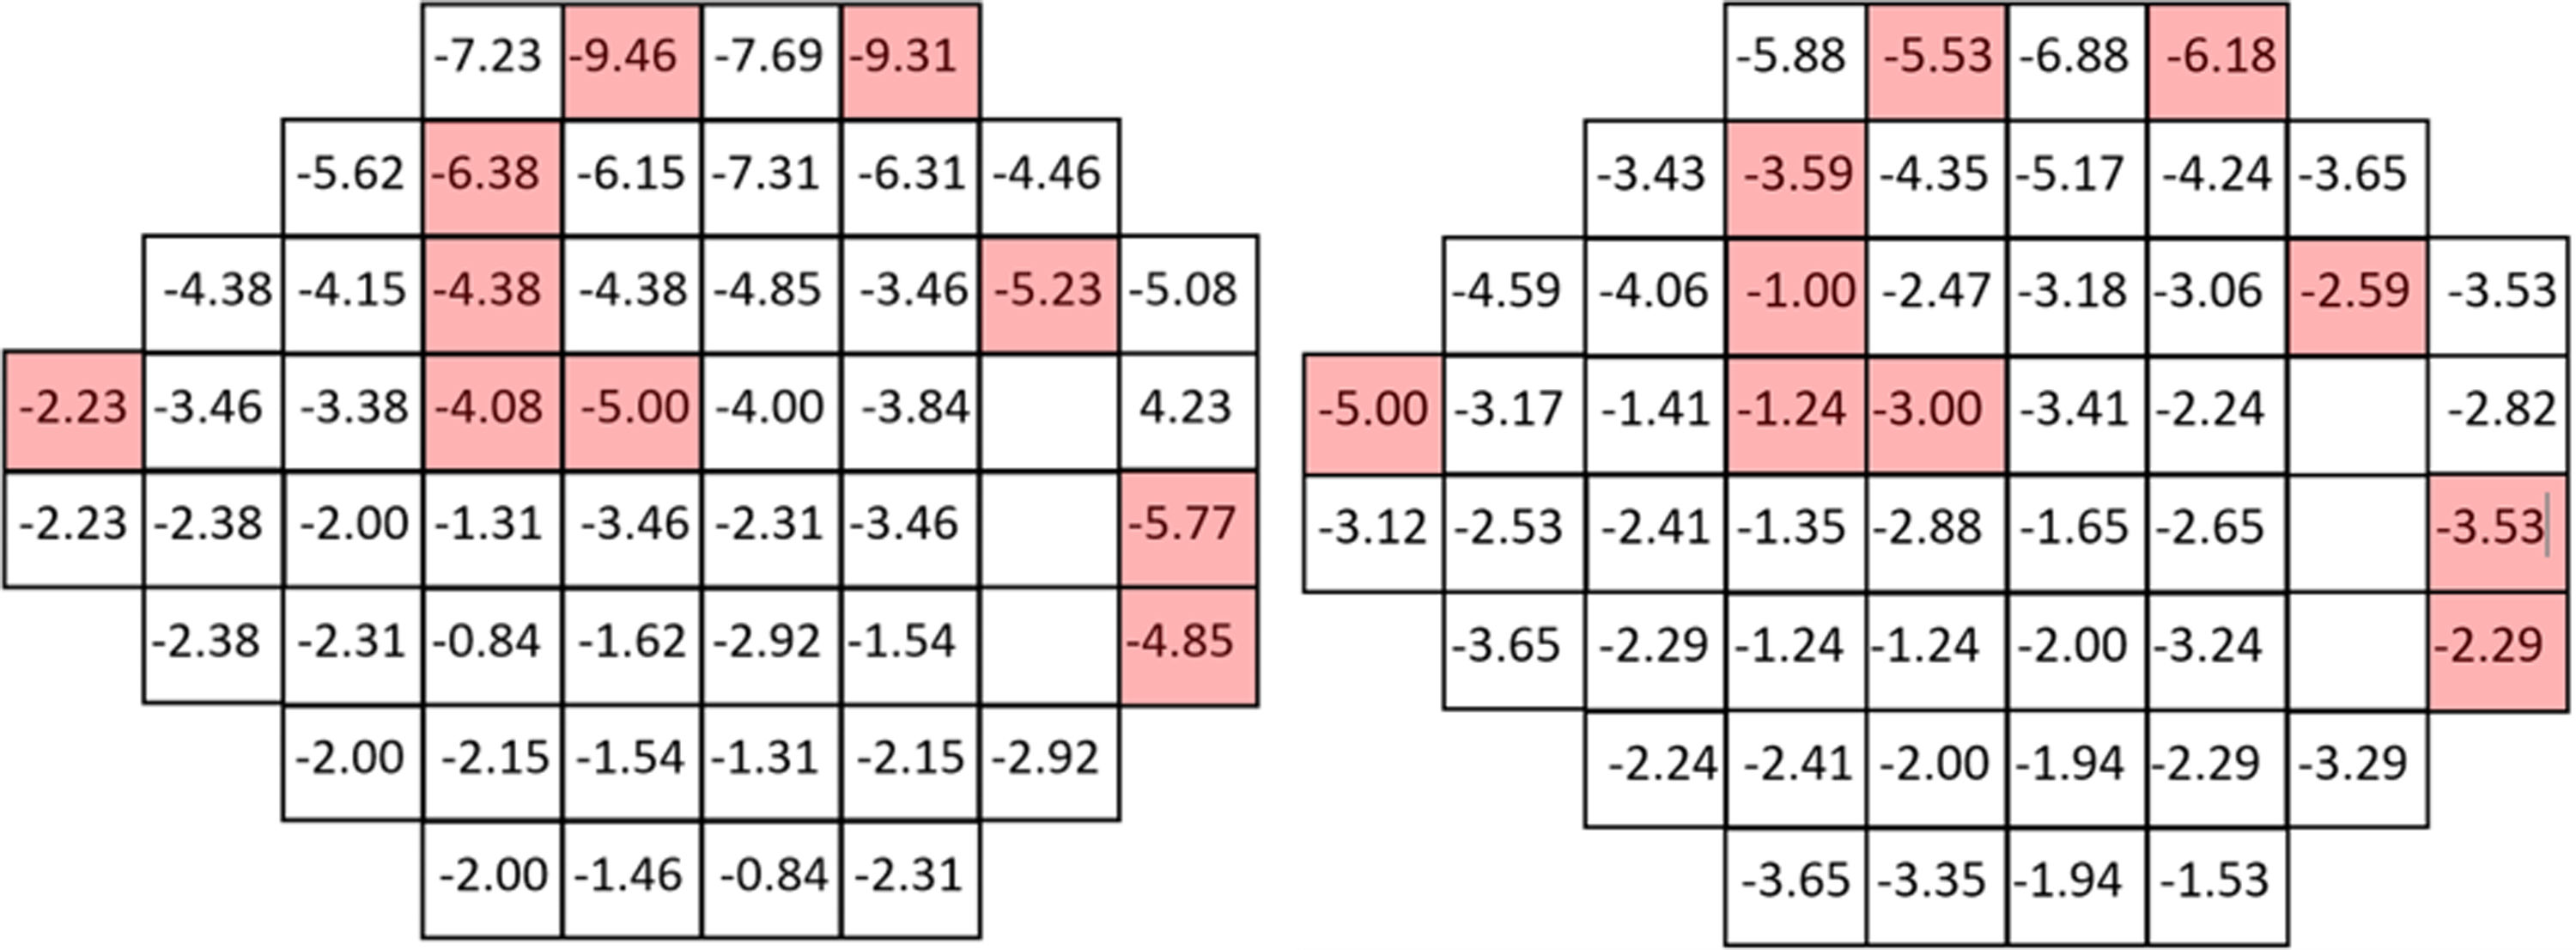
Mean TD values were −0.61 + 4.24 dB for non-smokers and −1.62 + 4.87 dB for smokers, with r = 0.117 (95% CI [0.059,0.174]) and p < 0.001 in the Mann-Whitney test. The mean value of PD was −3.81 + 3.90 dB for smokers and -3.07 + 3.30 dB for non-smokers (r = 0.104, 95% CI [0.046, 0.161]; p < 0.001), pointing to slightly larger defects and greater field irregularity for smokers.
In particular locations of the visual field, differences between the two populations yielded p-values below 0.05, though not below the significance level set by the B Benjamini-Hochberg correction. Given the pattern of losses, the visual field was subsequently divided in four quadrants and for each subject the mean sensitivity, total deviation and pattern deviation for each quadrant was computed. When the analysis was performed globally for each quadrant of the visual field, significant differences in S, TD and PD appeared only on the upper hemifield (see p-values in the legend of Fig. 4).
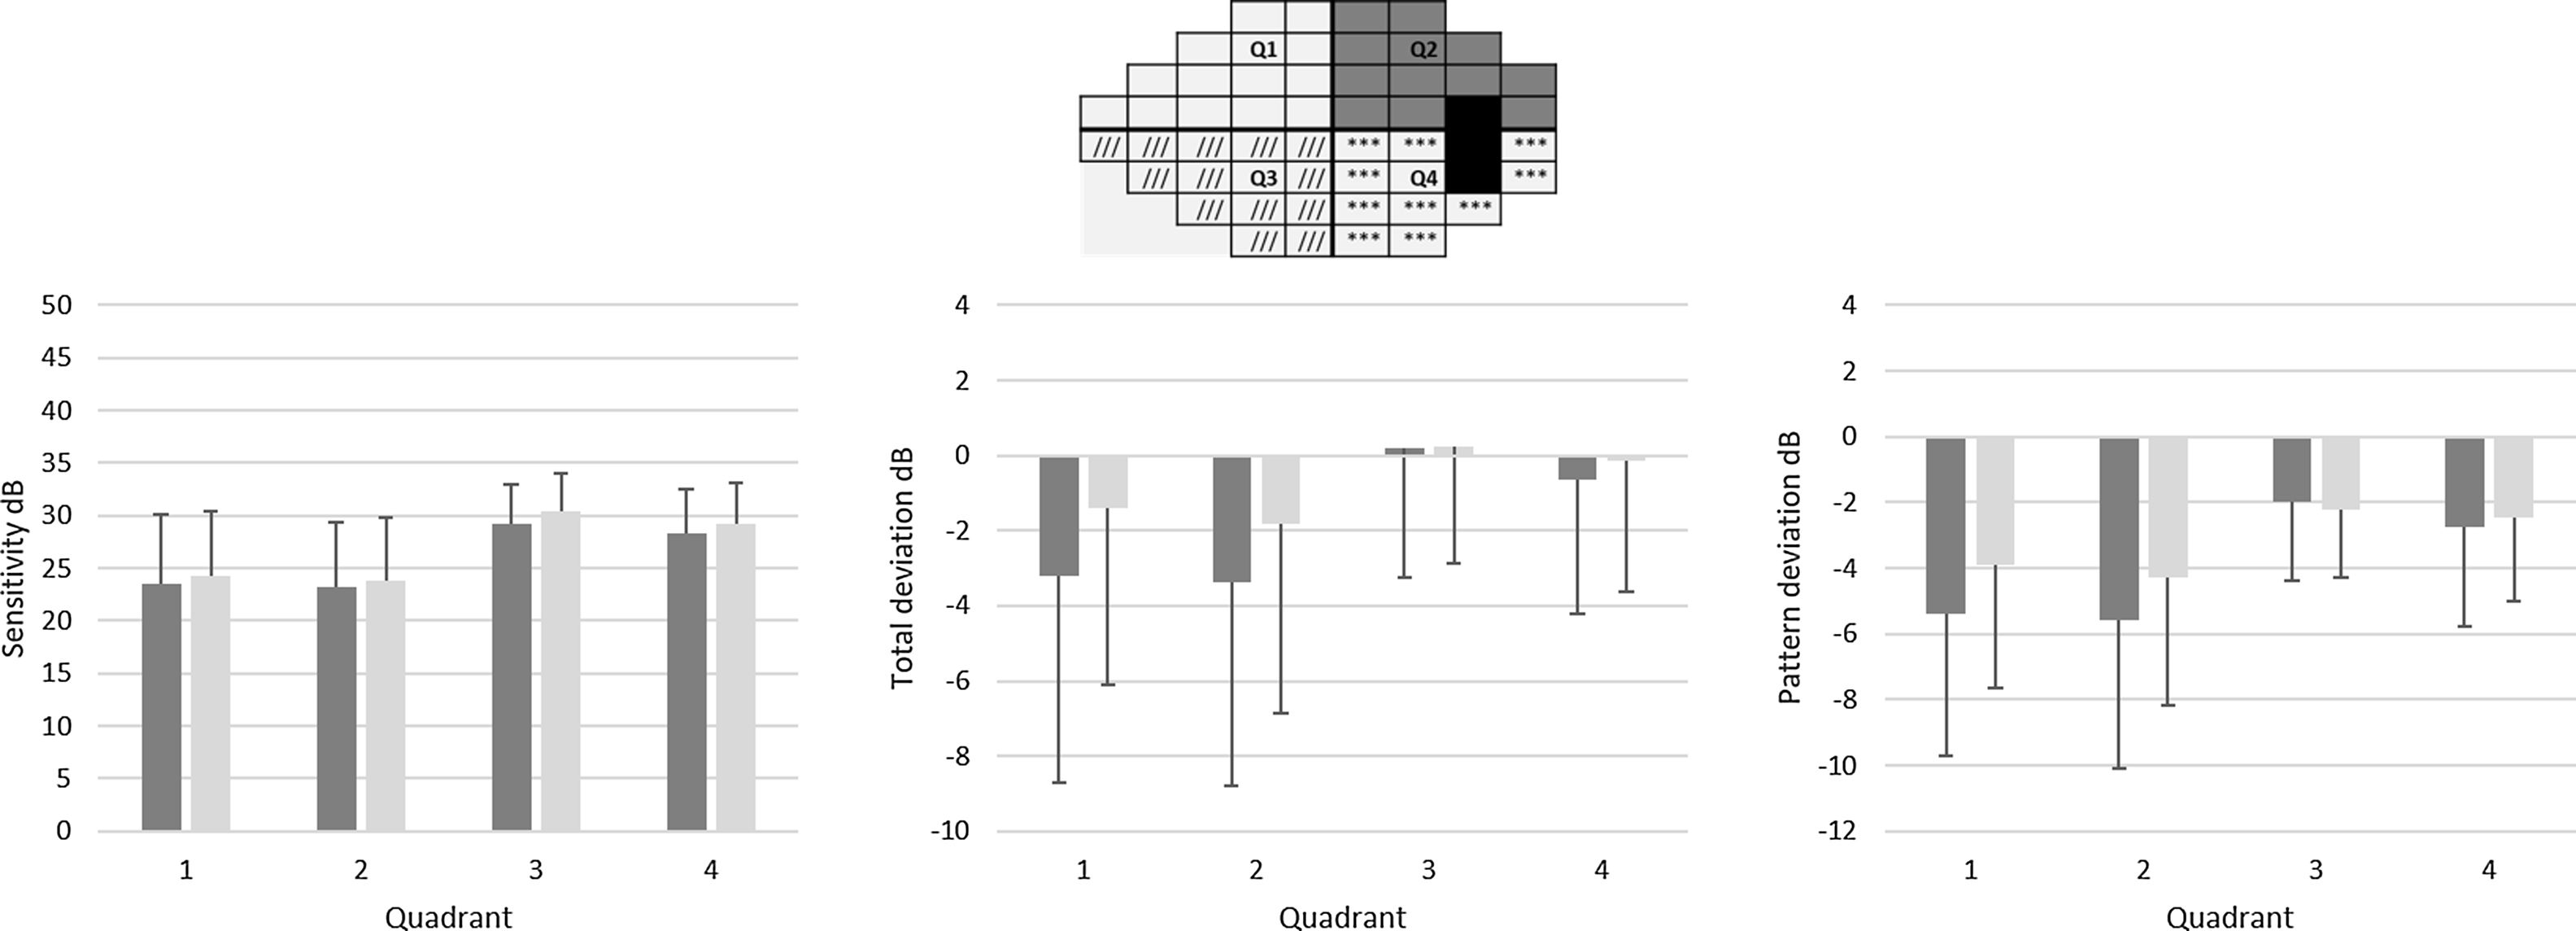
Figure 4: Mean quadrant sensitivities (left), total deviations (center) and pattern deviation (right) for smokers (dark bar) and non-smokers (light bar). Differences were significant only for Q1 (p < 0.001 for S, p < 0.001 for TD and PD) and Q2 (p = 0.006 for S, p = 0.001 for TD and PD) quadrants for the three parameters. Q1 = upper-left, Q2 = upper-right, Q3 = lower-left, Q4 = lower-right.
In this study, we evaluate chromatic mechanisms by means of two different tests. The differences between our young moderate smokers and our non-smokers in SWAP are small (r < 0.15), and not statistically significant, in the FM100hue test. The red-green mechanism is assessed only by the FM100hue test, and results suggest that the combined effect of number of years smoking and the number of cigarettes per day affect the red-green mechanism. A linear model with PCA (Principal Component Analysis model),28–29 using a weighted contribution of both variables was significant for TES and RG. This point must be tested with a larger sample.
Our results with the FM100 hue test are in agreement with the results obtained by Bimler and Kirkland9 with the D15 test. They found that smokers in the 20–34 age range who had been smoking at least a packet of cigarettes per day, for at least a year, had statistically less sensitivity to red–green differences. These changes are consistent with some form of injury to the optic nerve.30,31 If that were the case, we would have expected to find signs in the OCT, but no anomaly was detected in our participants.
However, our study does not agree with other results obtained with color arrangement tests in patients of a similar age range. Arda et al.32 found differences in TES in the FM100hue test but not in the partial scores (RG and BY TES). Their subjects took the test binocularly and this could mask small monocular defects, but their smokers consumed a larger number of cigarettes per day and had been smoking for a larger number of years. This is reflected in larger TES scores ((65 in smokers versus 50.5 in non-smoker, both values larger than ours) but not in a selective loss in the chromatic mechanisms. As with our subjects, they found no relationship between the number of cigarettes per day and years of smoking and the TES score. Not even when the difficulty of the task is increased, which might increase the probability of detecting small defects, reveals losses in light smokers. Roth’s desaturated test has not revealed differences between young non-smokers and young light smokers (less than 20 cigarettes per day), though the differences with heavy smokers (more than 20 cigarettes per day) were significant.8
The blue-yellow mechanism is assessed by both SWAP and the FM100hue test, but in our study only SWAP suggests differences between smokers and non-smokers. These sensitivity differences were confined to the upper visual field, so this particular sensitivity reduction pattern could be consistent with normal BY FM100hue results. A linear model with PCA analysis, using a weighted contribution of number of years smoking and the number of cigarettes per day variables was not significant for BY in the FM100hue test.
Different spatial patterns of blue-yellow sensitivity loss have been previously reported in smokers, using SWAP and the full-threshold strategy,12,13 as in our study. Prevalence of diffuse damage and localized damage in the upper hemifield has been described in the central 10−2 visual fields of older (46.8 ± 9.0 years) heavy tobacco smokers,12 but the results may be affected by the fact that the subjects were also alcohol consumers. In moderate smokers, Arkasu and co-workers13 found a sensitivity loss at fovea, but no other localized loss or an overall sensitivity reduction in the central 30−2 visual field, in disagreement with our results. Extrapolating from our own results, we would have expected a clearer pattern of sensitivity reduction in the upper hemifield, given that the smokers in the study by Arkasu and co-workers were older (mean age 32.7 ± 5.8), smoked a slightly larger number of cigarettes per day (15.8 ± 4.6 in average) and had smoked for a longer period of time (8.1 ± 2.2 years). In fact, these factors could account for the difference between our mean sensitivity values and those reported by Arkasu and co-workers (22.2 ± 6.3 dB for smokers and 25.5 ± 4.0 dB for non-smokers). Age alone would lead to expect a difference of about 0.9 dB between the two non-smoker groups (0.13 dB per year of age).33 We also agree with the fact that differences between groups in MD and PSD are not significant. However, the reason for a different pattern of loss is not clear. SWAP has large inter-observer and test-retest variability,34,35 resulting in wide normality intervals, particularly with the full-threshold strategy.33 It is also subject to a learning effect,34 and though participants in both studies took training sessions prior to the measurements, the number of sessions differs (two in the study by Arkasu et al., one in our case). The procedure used for analysis also may play a role: in our study, the difference in sensitivity between smokers and non-smokers was enhanced when the quadrants of the visual field were studied separately. However, we did find a significant difference in the number of out-of-limit points in the total and pattern deviation maps, that did not appear in the older sample. The robustness of the conclusions, derived from these small samples (Arkasu’s 30 non-smokers and 22 smokers and our 17 non-smokers and 13 smokers) can be questioned.
Both in our results and in those by De Carvalho and co-workers12 the asymmetry in the pattern of sensitivity decrement in the visual field may be explained by the paucity hyphothesis.14 In vertebrates, there is a decline in the spatial densities in most of cell types (except for rods and S bipolar cells) with increasing retinal eccentricity, and this is particularly true for mammals. This decline is matched by an increase in the sizes of the dendritic fields of these cells, and these variations appear primarily to be due to differential retinal growth during development. The works of Curcio et al.36,37 show that the superior retinal field has more cell density than the inferior retinal field. This difference in cell density makes the lower visual field slightly more sensitive than the upper visual field.38
Therefore, it seems that the differences between both groups of observers are greater in the less sensitive areas of the visual field, in the same areas where cell density is lower also in healthy observers and where damage in the existing cells could be expected to have greater effect.
This study shows that moderate consumption of tobacco induces alterations in the blue-yellow channel in comparison to the age-matched control group. However, some limitations should be considered before our findings may be generalized. This is a pilot study and the small sample limits the generality of the conclusions and the number of variables that can be used realistically in a model to explain the results, although it points to an interesting general trend.
With our small samples and small effect sizes, the influence of different sources of distortion may be large. Both FM100hue and SWAP present strong learning effects23 that could mask the differences between groups, although we tried to reduce this effect by ensuring that our subjects had performed the test at least once, with the non-dominant eye. On the other hand, normal subjects make more errors in caps 40–50, whose correct arrangement relies on the responses of the blue-yellow mechanism,15 and, therefore slight differences in this mechanism could pass undetected in a small sample. There is also evidence supporting that the differences between smokers and non-smokers could be affected by other factors, such as coffee or alcohol intake12,39,40 or the use of contraceptives.39,40Though we collected data about usual coffee or alcohol intake in our questionnaire, given the smallness of the sample, it was not possible to analyse which of these parameters did affect FM100hue or SWAP results. Menstrual cycle was not taken on consideration either, though it has been shown that it may alter visual fields.39 Given that we did not find differences due to gender, we may conclude that menstruation changes did not affect the results, although this factor should be considered in a future work. In a future study, it could be also interesting to evaluate both chromatic mechanisms with the same techniques, that is, with specific perimetries.
Declaration of interestThe authors report no conflicts of interest and have no proprietary interest in any of the materials mentioned in this article
This submission has not been published anywhere previously and it is not simultaneously being considered for any other publication. This submission has not any financial support.


