

This study was undertaken to find correlations between visual functions and visual disabilities in patients with diabetic retinopathy.
MethodA cross-sectional study was carried out among 38 visually impaired diabetic retinopathy subjects at the Low Vision Clinic of B.P. Koirala Lions Centre for Ophthalmic Studies, Kathmandu. The subjects underwent assessment of distance and near visual acuity, objective and subjective refraction, contrast sensitivity, color vision, and central and peripheral visual fields. The visual disabilities of each subject in their daily lives were evaluated using a standard questionnaire. Multiple regression analysis between visual functions and visual disabilities index was assessed.
ResultThe majority of subjects (42.1%) were of the age group 60–70 years. Best corrected visual acuity was found to be 0.73±0.2 in the better eye and 0.93±0.27 in the worse eye, which was significantly different at p=0.002. Visual disability scores were significantly higher for legibility of letters (1.2±0.3) and sentences (1.4±0.4), and least for clothing (0.7±0.3). Visual disability index for legibility of letters and sentences was significantly correlated with near visual acuity and peripheral visual field. Contrast sensitivity was also significantly correlated with the visual disability index, and total scores.
ConclusionImpairment of near visual acuity, contrast sensitivity, and peripheral visual field correlated significantly with different types of visual disability. Hence, these clinical tests should be an integral part of the visual assessment of diabetic eyes.
Este estudio se llevó a cabo para hallar las correlaciones existentes entre las funcionalidades visuales y el nivel de discapacidad visual en pacientes con retinopatía diabética.
MétodoSe realizó un estudio transversal en 38 pacientes con retinopatía diabética y disfunción visual en la Clínica de Baja Visión del B.P. Koirala Lions Centre para estudios oftalmológicos de Katmandú. Los pacientes fueron sometidos a estudios de agudeza visual cercana y lejana, refracción objetiva y subjetiva, sensibilidad de contraste, visión de color y campos visuales central y periférico. Se evaluó el nivel de discapacidad visual de cada paciente en su vida diaria mediante un cuestionario estandarizado. Se realizó un análisis de regresión múltiple para determinar la relación existente entre las funcionalidades visuales analizadas y el nivel de discapacidad visual.
ResultadoLa mayoría de los pacientes (42,1%) pertenecían al grupo de edad de 60–70 años. Se halló que la agudeza visual mejor corregida se situaba en 0,73±0,2 en el mejor ojo, y en 0,93±0,27 en el peor ojo, existiendo una diferencia estadísticamente significativa, p=0,002. Los índices de discapacidad visual fueron considerablemente superiores para la legibilidad de letras (1,2±0,3) y frases (1,4±0,4), y los mínimos para la ropa (0,7±0,3). El índice de discapacidad visual para la legibilidad de letras y frases presentaba una correlación significativa con la agudeza visual cercana y el campo visual periférico. También la sensibilidad de contraste mostró una correlación considerable con el índice de discapacidad visual y las puntuaciones totales.
ConclusiónLas deficiencias de la agudeza visual cercana, la sensibilidad de contraste y el campo visual periférico se correlacionaron significativamente con los diferentes tipos de discapacidad visual. Por tanto, estas pruebas clínicas deberían constituir una parte integral de la evaluación visual de los ojos de los pacientes diabéticos.
Visual impairments secondary to diabetic retinopathy represent a major public health problem.1,2 Legal blindness accounts for 83% of visual impairment among persons with youth-onset diabetes, and 33% among persons with older age onset diabetes.1 Diabetes alone can increase the risk of blindness 25 times.2 Diabetic retinopathy occurs in approximately 7–29% of patients attending general medical practices.3–7 Approximately two-thirds of diabetics have an increased possibility of visual impairment after 35 years of suffering the condition, and are 25 times more likely to go blind, compared with other health conditions.1
Low-vision patients perceive marked impairment of functional status, daily living activities, and quality of life.8–11 A person with low vision due to diabetic retinopathy often experiences difficulties with activities such as identifying faces, reading bus numbers from a distance, reading small and low contrast print, writing in a straight line, intolerance to light, and difficulty in moving outdoors after dusk, shopping, cooking and locating food, seeing the time on a watch, or differentiating coins and bank notes of similar dimensions.12
Visually impaired diabetics have specific needs to be addressed. They need to be able to see well enough to fill insulin syringes, read the labels of oral medications, and to see their blood sugar level indicators. They may also have neuropathies affecting their feet. Hence, utilizing remaining vision to its fullest potential becomes paramount in such cases.12,13
Recent studies reported various grades of diabetic retinopathy in 21–47% of diabetic patients in Kathmandu.14–17 Visual impairment among diabetics was reported at 15.2–15.6% and legal blindness at 1.5–2.3%.16,17 However, visual function parameters which have an impact on visual disabilities have not been extensively studied in Nepal. The present study was carried out to find the relationships between impairments of visual functions and visual disabilities, and to determine the function parameters which have greater impact on causing disabilities among Nepalese people with diabetic retinopathy.
MethodSubjects and sample sizeA hospital-based cross sectional study was carried out among 59 subjects referred to the Low Vision Clinic (LVC) from the Retina Clinic at B.P. Koirala Lions Centre for Ophthalmic Studies (BPKLCOS) in the period January to June 2010. Subjects having diabetic retinopathy and visual acuity equal to or less than 6/18 were enrolled in the study. Subjects having any other associated ocular pathology which was not attributable to diabetes, with currently uncontrolled blood sugar, or being treated with pan-retinal photocoagulation for less than 6 weeks, were excluded from the study.
Informed consent was obtained from all subjects and their attendants after explaining to them the purpose of the study. The subjects were requested to bring to the clinic their present optical correction, and the most recent blood sugar report to ensure control and stability of their blood sugar level. Only 38 subjects (64%) fitted the inclusion criteria to be assessed for the low vision service.
Clinical examinationClinical examination included the following procedures:
- (a)
Presenting, and best-corrected distance visual acuities, were assessed using a Log MAR chart that was designed to be used at 10feet under normal room illumination. It was an illiterate E chart having a consistent number of five letters in each row. There was a geometric progression of 0.1log units in each line. If the subject was unable to read the top line at 10feet, the chart was brought nearer (8feet, 6feet, 4feet, 2feet or 1foot) until they were able to identify those letters.
- (b)
Objective and subjective refraction was undertaken to achieve the best distance acuity. To determine the refractive error the power was estimated by the bracketing technique in which plus and minus lenses of equal powers was compared. To determine the interval of lenses to be compared, a concept of just noticeable difference (JND) was adopted. To calculate JND, the denominator of the acuity at 10feet was divided by 100.
- (c)
Near vision was assessed with a continuous reading chart while wearing best refractive correction, and near addition in presbyopic subjects. The meter system was adapted to record near visual acuity. Accurate measurement of reading distance from the spectacle plane was also recorded.
- (d)
Contrast sensitivity was assessed monocularly as well as binocularly using the Pelli–Robson chart at one meter distance, with best distance refractive correction and near addition of +0.75D in presbyopic subjects.
- (e)
Color vision was assessed monocularly using the Farnsworth dichotomous D-15 test with best refractive correction, and near addition if necessary.
- (f)
Central visual field was tested monocularly at 33cm distance, with an Amsler grid chart with best refractive correction, and near addition in presbyopic subjects. With the Amsler chart, a white grid on a black background was used. The grid represents a 10cm×10cm square containing 400 single squares equally distanced. If any scotoma, blurred lines, patchy defects, or metamorphopsia were detected the test was considered positive.
- (g)
Peripheral visual field was assessed monocularly with the Bernell handheld disc perimeter under normal room illumination. The Bernell disc perimeter comes with a 9in. long wand and 1–2–3–4mm targets. The radius of the perimetric arc was 13in., and the arc was 2in. high. A white test object of 3mm size was used to test the field at a distance of 1/3m. This instrument has been found to have high reliability and repeatability when compared to the Humphrey Field Analyzer II (Syah, 2007, as cited in Haliza, 2010).18
To evaluate the visual disabilities of each subject in daily life, a set of 34 questions in 7 sections was used (Appendix 1). The reproducibility and validity of the data obtained by the questionnaire had been established by an investigation in glaucoma and retinitis pigmentosa patients.19,20 The seven categories included questions about the legibility of letters, the legibility of sentences, walking, going out, having a meal, choosing clothing/dressing, etc. Multiple questions on visual disabilities were present in each category.
The questionnaire was translated to Nepali and back to English to check the consistency in meaning. Few modifications were done to suit the environment and culture of our study population, e.g. “Can you read a fare table for trains and subways?” was removed as it would not be applicable in Nepal. “When you write sentences in vertical lines, does it lean in either direction?” was replaced with “When you write sentences between two horizontal lines, does it tilt in direction?” “Do you feel some difficulty in using chopsticks?” was replaced with “Do you feel some difficulty in using a knife, fork, or spoon?”
Each patient was also asked to write about visual disability in daily life, with respect to factors that were not covered in the questionnaire. Difficulty in taking insulin and doing a blood sugar evaluation were reported. They were all included in the questionnaire.
Each question had three types of response choices, which were scored as: greatly disabled (2 points), slightly disabled (1 point), and not disabled (0 point). The visual disability score was calculated as the mean score within each category and the sum was calculated for each subject.
Statistical analysisAll data were evaluated using the statistical package for social sciences (SPSS 17.0.). Presenting, and best corrected visual acuity, contrast sensitivity, peripheral visual field, and refractive error differences between the better and worse eyes, were analysed using parametric paired sample t-test. Color vision and central visual field tests were analysed using Wilcoxon sign rank test. Multiple regression analysis was also used to assess the correlation between each dependent variable (legibility of letters, legibility of sentences, walking, going out, having a meal, dressing, etc.), and independent variables (visual functions – visual acuity, color vision, contrast sensitivity, central and peripheral visual field). Confidence interval was considered at 95% level. p-Value was considered significant for less than 0.05.
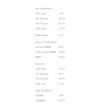
ResultDistribution and characteristics of the sampleThe main characteristics of the sample in the study are given in Table 1. Most of subjects (42.1%) who were in the age group of 60–70 years attended to the low vision clinic. Male/female ratio was 2.4:1. Severe non-proliferative diabetic retinopathy was present in 38.2% of subjects. Fifty percent of subjects had diabetes for 10–20 years.
General characteristics of the sample.
| Age distribution | |
| ≤50 years | 7.9% |
| 50–60 years | 26.3% |
| 60–70 years | 42.1% |
| ≥70 years | 23.7% |
| Male:female | 2.4:1 |
| Stages of retinopathy | |
| Severe NPDR | 9.2% |
| Very severe NPDR | 38.2% |
| PDR | 52.6% |
| Duration | |
| ≤10 years | 15.8% |
| 10–20 years | 50% |
| 20–30 years | 28.9% |
| ≥30 years | 5.3% |
| Type of diabetes | |
| IDDM | 2.6% |
| NIDDM | 97.4% |
NPDR, non-proliferative diabetic retinopathy; PDR, proliferative diabetic retinopathy; IDDM, insulin dependent diabetic mellitus; NIDDM, non-insulin dependent diabetic mellitus.
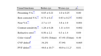
Results of visual function analysis are given in Table 2. Except color vision (p=0.5), all the components of visual functions were significantly different between the better eye (BE) and worse eye (WE). Color vision could not be assessed in 7.9% subjects due to poor visual acuity. Color vision was found to be normal in 13.2% of the BE group and 23.7% of the WE group. CVD did not show any specific line of defect in 26.3% in the BE, and 21% in the WE.
Assessment of visual functions.
| Visual functions | Better eye | Worse eye | p* |
| Presenting VA** | 0.85±0.21 | 1.0±0.25 | 0.00 |
| Best corrected VA** | 0.73±0.2† | 0.93±0.27† | 0.002 |
| Near VA** | 2.7±1.5 | 3.6±1.9 | 0.001 |
| Contrast sensitivity** | 1.28±0.28 | 1.11±0.4 | 0.002 |
| Refractive error** | 0.50±2.2 | 0.3±1.4 | 0.69 |
| Color vision# | 52.6% (Tritan) | 47.4% (Tritan) | 0.49 |
| CVF defect# | 34.2% | 57.9% | 0.005 |
| PVF defect** | 44.6±10.7° | 40.9±11.2° | 0.01 |
VA=visual acuity; CVF=central visual field; PVF=peripheral visual field.
Fifteen subjects (39.5%) presented with spectacles during the assessment. One person had one aphakic eye (+9.00) and the other eye +2.00 hyperopia. Eight subjects (21%) were bilaterally pseudophakic and 24 subjects (63.1%) were monocular pseudophakic. Central vision defects comprised of metamorphopsia and patchy central scotoma. Peripheral visual field could not be assessed in 7.9% subjects who could only see hand movements.
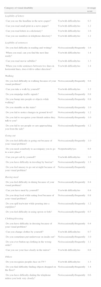
Results of the assessments of visual disabilities are presented in Fig. 1. The most common disabilities reported were legibility of sentences (1.4±0.4), and legibility of letters (1.2±0.3). The least common visual disability reported was clothing/dressing (0.7±0.3). Reading letters in a dictionary (1.6), and reading/writing sentences (1.6) on “legibility of sentences”, were the most disabling conditions for the subjects.
Multiple regression analysis between visual disability and visual functions in the BE
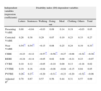
Table 3 contains the standard regression coefficients and adjusted R2 value of multiple regression analysis. Visual disability index (VDI) for “Legibility of letters” and “Legibility of sentences” was correlated with near visual acuity and peripheral visual field. Visual disability index for “Walking” was correlated with contrast sensitivity (−0.57, p=0.01). Visual disability index for “Going out” was correlated with contrast sensitivity (−0.56, p≤0.05) and peripheral visual field (−0.31, p≤0.05). Visual disability index for “having meals and dressing” was not significantly correlated with visual functions. The sum of the visual disability score was correlated with near visual acuity (0.33, p≤0.05) and contrast sensitivity (−0.38, p≤0.05).
Standard regression coefficient and adjusted R2 value in multiple regression analysis.
| Independent variables (regression coefficients) | Disability index (DI)-dependent variables | |||||||
| Letters | Sentences | Walking | Going out | Meal | Clothing | Others | Total | |
| Presenting VABE | 0.00 | −0.04 | −0.03 | 0.09 | 0.14 | 0.19 | −0.03 | 0.05 |
| Corrected VABE | 0.26 | 0.38 | 0.29 | 0.07 | 0.19 | 0.23 | 0.33 | 0.27 |
| Near VABE | 0.54** | 0.54** | −0.15 | 0.08 | 0.25 | 0.24 | 0.19 | 0.33* |
| CSBE | −0.23 | −0.12 | −0.57** | −0.56** | −0.27 | −0.08 | −0.32* | −0.38* |
| REBE | −0.24 | −0.14 | −0.05 | 0.02 | 0.00 | −0.21 | 0.23 | −0.07 |
| CVBE | 0.10 | 0.12 | −0.05 | −0.10 | 0.00 | 0.13 | −0.18 | 0.02 |
| CVFBE | 0.19 | 0.16 | −0.04 | −0.08 | −0.04 | −0.15 | 0.04 | 0.05 |
| PVFBE | 0.26* | 0.27* | −0.20 | −0.31* | −0.23 | −0.20 | −0.32* | −0.06 |
| Adjusted R2 | 0.70 | 0.67 | 0.57 | 0.56 | 0.44 | 0.31 | 0.57 | 0.69 |
VABE=visual acuity in better eye; CSBE=contrast sensitivity in better eye; CVBE=color vision better eye; CVFBE=central visual field better eye; PVFBE=peripheral visual field in better eye; REBE=refractive error in better eye.
The present study showed the relationship between impairment of visual functions and visual disability in people with diabetic retinopathy.
Reduced visual acuity in diabetics can be attributed to proliferative retinopathy, macular edema, cataract, corneal haze, grid photocoagulation for diabetic macular edema and variation in refraction caused by fluctuating blood sugar level.1,13,21 Though corrected visual acuity (Table 2) was significantly improved in both the BE (p<0.05) and the WE (p<0.05) compared to the presenting acuity, the degree of improvement was not sufficient for most of subjects. This finding was well supported by the correlation between visual acuity and disability index (Table 3). In our study, difficulty in recognizing faces was the most common visual complaint in all cases (100%).
Our study showed that refractive error correction could improve useful vision significantly (Table 2), but could not eliminate the impairment. Telescopic visual acuity was also assessed in the BE in 78.9% of subjects. Although there was a significant improvement of visual acuity, the functional implication of the telescopes has not been highlighted in this report.
Reduced vision in diabetics can affect not only their daily living activities, but importantly also, in managing diabetic medications, diet and health issues, and psychological well-being.1 The blood glucose level is determined by visually comparing the color of the test-strip to a color chart or by inserting the strip into a reflectance meter (Cooke, 2001).13 For these purposes, diabetic patients require reasonably good near vision as well as intact color vision.
In our study, each subject was also asked to record visual disabilities in their daily life that were not covered in the questionnaire. Only six subjects (16%) reported difficulty in taking insulin and doing a blood sugar evaluation. Near vision in the BE was 2.7±1.5M (range 1–10M). Near vision was almost 2.5 times poorer than standard text sizes (1M). Visual disability was most significantly correlated with near vision (Table 3) in the study.
Mantyjarvi22 reported acquired color vision defects with the Farnsworth-Munsell 100-hue test in 50% of subjects, with 80% of them having defects in the blue/yellow axis. Tritan color vision defects were present in 52.6% of the BE and in 47.4% of the WE in our study. However, correlation between color vision and visual disability could not be established. Presumably color vision tests became difficult in some elderly and visually impaired people, and produced erroneous reports. The color caps which were used for these tests were designed for use in a regular eye-clinic.
Even with the intact and good visual acuity, many elderly people may get visually impaired in low and changing light levels, face recognition, reading, glare and low contrast.23,24 Contrast sensitivity (CS) is often reduced in patients with diabetic retinopathy.25–27 Contrast sensitivity are usually decreased at intermediate and low spatial frequencies.28 Macular edema, early development of cataract, and laser photocoagulation treatment have effects on contrast sensitivity.13,21 In our study, decreased contrast sensitivity was the second most significantly correlated visual dysfunction.
The central visual field is important in understanding the patient's near vision status and helps the practitioner during making a decision for magnification. In the Kooyong LVC study, 30.6% (N=43) of eyes had visual field defects.13 Central visual defects in the form of metamorphopsia and patchy scotoma were present in the BE of 34.2% of subjects, and in the WE of 47.4% of subjects in our study. Central visual field defects were not significantly correlated with the visual disability index.
The Amsler grid did not enable the practitioner to determine the size and configuration of the scotoma. Central visual fields were tested on the Amsler grid to screen for the presence of defects, but intensity or severity of the defect could not be measured with this chart. The Amsler grid was not useful in cases of visual field defects that extended beyond 10°, and in which a central scotoma size was of more than 5° of radius.29 Subjects might fixate eccentrically to view more of the grid.
Peripheral field results are essential to ensure appropriate orientation and mobility training of patients.13 Peripheral visual field was found restricted in both the BE (44.6±10.7) and the WE (40.9±11.2). In our study, most of subjects had their retinopathy recorded as severe NPDR or PDR (Table 1) and was treated by pan-retinal photocoagulation in 86.8% of cases. This might be the reason for a higher percent of field restriction compared to other studies (Constable, 1990; as cited in Cooke 2001).13 Peripheral visual field restrictions (Table 3) were the third significant visual function correlated with disability index.
The study had many limitations. The sample was very small and there was a lack of control group to evaluate the effectiveness of the intervention. The questionnaires were translated through face validity technique only. No pilot study was conducted before assigning the questionnaires to the subjects.
ConclusionThe answers to the questionnaires revealed information about the level of disability and the effects on the life-style of the subjects. Impairments in near visual acuity, contrast sensitivity and peripheral visual field correlated with different types of visual disabilities. Hence, these clinical tests should be carefully considered as an integral part of the visual assessment in diabetic subjects.
Conflicts of interestThe authors declare not to have any conflicts of interest.
We would like to thank Mr. Robert F Kinnear, senior optometrist for helping us editing the manuscript and largely correcting English language.
| Category of visual disability | Average score | |
| Legibility of letters | ||
| Can you see the headline in the news paper? | Yes/with difficulty/no | 0.3 |
| Can you read small print in a news paper? | Yes/with difficulty/no | 1.2 |
| Can you read letters in a dictionary? | Yes/with difficulty/no | 1.6 |
| Can you see numbers in telephone directory? | Yes/with difficulty/no | 1.2 |
| Legibility of sentences | ||
| Do you feel difficulty in reading and writing? | No/occasionally/frequently | 1.6 |
| When you read, can you find the next line easily? | Yes/with difficulty/no | 1.4 |
| Can you read movie subtitles? | Yes/with difficulty/no | 1.3 |
| When you write sentences between two lines in horizontal lines, does it tilt to either direction? | Yes/with difficulty/no | 1.4 |
| Walking | ||
| Do you feel difficulty in walking because of your visual problem? | No/occasionally/frequently | 0.8 |
| Can you take a walk by yourself? | Yes/with difficulty/no | 1.2 |
| Do you misjudge traffic signals? | No/occasionally/frequently | 0.8 |
| Do you bump into people or objects while walking? | No/occasionally/frequently | 0.8 |
| Do you stumble on the stairs? | No/occasionally/frequently | 1.0 |
| Do you fail to notice changes in ground level? | No/occasionally/frequently | 1.2 |
| Do you fail to recognize your friends unless they talk to you? | No/occasionally/frequently | 1.0 |
| Do you fail to see people or cars approaching you from the side? | No/occasionally/frequently | 1.2 |
| Going out | ||
| Do you feel difficulty in going out because of your visual problem? | No/occasionally/frequently | 1.0 |
| Do you need somebody to accompany you to go to a new place? | No/preferably/yes | 0.5 |
| Can you get cab by yourself? | Yes/with difficulty/no | 1.0 |
| Do you have difficulty in traveling by bus/car? | No/occasionally/frequently | 1.3 |
| Do you feel uneasy to go out at night because of your visual problem? | No/occasionally/frequently | |
| Having meal | ||
| Do you feel difficulty in dining because of your visual problem? | No/occasionally/frequently | 0.4 |
| Can you have meal by yourself? | Yes/with difficulty/no | 0.4 |
| Do you drop food while eating food because of your visual problem? | No/occasionally/frequently | 0.8 |
| Do you spill tea/water while pouring into a cup/glass? | No/occasionally/frequently | 1.2 |
| Do you feel difficulty in using spoon or fork? | No/occasionally/frequently | 0.7 |
| Clothing/dressing | ||
| Do you have difficulty in dressing because of your visual problem? | No/occasionally/frequently | 0.4 |
| Can you change clothes by yourself? | Yes/with difficulty/no | 0.7 |
| Do you sometimes put underwear on inside out? | No/occasionally/frequently | 1.0 |
| Do you ever button up clothing in the wrong order? | No/occasionally/frequently | 1.1 |
| Can you see your face clearly in the mirror? | Yes/with difficulty/no | 0.8 |
| Others | ||
| Do you recognize peoples face on TV? | Yes/with difficulty/no | 1.3 |
| Do you find difficulty finding objects dropped on the floor? | No/occasionally/frequently | 1.4 |
| Do you have difficulty dialing the telephone unless you look very closely? | No/occasionally/frequently | 0.6 |


