


The main objective of this study is to obtain percentile curves of monocular and binocular visual acuity on a decimal scale in a Spanish population aged between 3 and 12 years old.
Materials and methodDescriptive, observational and transversal study which included children between 3 and 12 years old without any known eye and/or systemic diseases. The selection of the sample was made by means of a convenience sampling method carried out in three schools and a hospital of the Community of Madrid. Far monocular and binocular visual acuity was measured using the Bueno Matilla vision unit on a decimal scale, both for monocular and binocular tests. The test used was the symmetrical letters test included with this unit. A descriptive statistic was performed and the visual acuity percentile values obtained were 5, 10, 25, 50, 75, 90 and 95.
ResultsThe visual acuity of 1300 children was evaluated and analysed. In all the percentile curves obtained, an increase in age-related visual acuity has been observed, reaching a value close to the unit for the 50th percentile, around five years and three months of age, under monocular conditions and somewhat earlier in binocular conditions.
ConclusionAlthough the type of sampling performed does not allow a generalization to the entire population, these percentile curves may help the paediatric professional to decide the referral of the relevant child to the eyecare professional, so that certain conditions, like amblyopia or the early stages of school myopia may be early detected.
The determination of visual acuity (VA) in the paediatric population poses a challenge for the different specialists in charge of primary care who are involved in the screening of visual disturbances in early ages groups. These disturbances may cause problems in the development of vision or in school performance, and hence the importance of detecting them in their early stages. However, García Aguado et al., in a review on the current screening of visual disturbances in children show that there are a variety of criteria between countries, cities and even between the different healthcare facilities.1 Therefore, it is necessary to unify criteria if we wish to improve the screening of visual disturbances on the basis of VA measurements in that population. This task will call for a standardization of measurements, as well as for the obtaining of percentile curves that show the development of such disturbances as a factor of age.
The main visual impairment resulting from the absence of an adequate screening method in paediatric age is amblyopia (lazy eye). The amblyopia that arises during the critical period of visual development can result in an irrevocable and irrecoverable loss of monocular vision and stereopsis if it is untreated. However, screening tests for amblyopia, such as the measurement of monocular VA, are non-invasive and relatively easy to carry out; consequently, it may be reasonably be assumed that they are acceptable to the children and their families.2 Furthermore, and since it is relatively easy to perform, it is interesting to note that this assessment could even be administered by non-trained individuals.
One of the first visual acuity percentile curves published referred to children aged from 2 years and 9 months until the age of 8 in the UK.3 These curves allow to compare the visual acuity of a specific child with that of the remaining children of the same age. When the visual acuity value falls below the 10th percentile, a complete visual examination is considered necessary. An increase in visual acuity was found from the age of 2 years and 9 months up to 5 years and 3 months and the need for further studies to establish normal ranges in the development of visual acuity up to 12 years was also noted, so that visual disturbances that might cause the decline of VA, as is the case of myopia,4 might be detected at an early stage.
In order to differentiate normal VA from abnormal VA it is necessary to define the normality criteria. The custom of using 1.00 (0.0 logMAR or 20/20) as a criterion for a normal VA in adults originates from Snellen and Landolt, as early as 1874. However, later studies have shown that visual acuity levels may be higher than one.5 The VA normality criteria must be established according to age since the degree of maturation of the visual system depends on age and environmental factors.6 The value of unit for VA in children visual screening as referral criterium for visual examinations by eye care specialists is not valid in all ages.7,8
Currently this lack of standardization of visual acuity causes a certain amount of uncertainty among the population, since the referral of children to the eyecare specialist as a result of their low visual acuity shows considerable differences, depending on the centre, the professional concerned and the test that has been used for the screening. Faced with this reality, it is hereby proposed to conduct this study, to ascertain the development of VA levels depending on the age of the population between 3 and 12 years and to establish their percentile curves, which is the main object of this study.
Material and methodType of studyThis is a descriptive, observational and cross-sectional study, which included children without known eye and/or systemic diseases. The protocol followed the tenets of the Declaration of Helsinki. The study was reviewed and approved by the ethical committee of the Universidad Europea de Madrid (Spain), and the study participants have signed an informed consent form.
Study populationThe sample was selected by means of a convenience sampling undertaken in three schools (Carmelo Teresiano school in Madrid, Dulce Chacón Public School, in Fuenlabrada, and Hermanos Torá public school in Humanes) and a hospital (Rey Juan Carlos University Hospital of Mostoles) all of them located in the Community of Madrid in a percentage of children of each age which is representative of the frequency by which it is detected among the Spanish census population. The census distribution was obtained from http://www.ine.es/dyngs/INEbase/es/categoria.htm?c=Estadistica_P&cid=1254735572981
The children included in the study conducted at schools ranked between pre-primary education students and sixth grade students, which are included by age in the range of 3–12 years. The children of the hospital facilities included in the study were those who attended a new first routine ophthalmology examination and who did not show any obvious eye pathology or symptoms of refractive error. Children with systemic or eye pathologies were excluded from the study. The existence of the pathology was not determined by means of complementary explorations performed additionally to the measuring of visual acuity, but on the basis of the information provided by the parents or guardians in the anamnesis that had been previously done. A total of 1548 subjects between 3 and 12 years old were recruited, all of them of Caucasian origin. The study subjects were included during the third school quarter of the 2016–2017 academic year and the first quarter of 2017–2018.
MaterialsThe visual acuity measurement was performed with the Bueno-Matilla vision unit (UBM). This is a CE certified medical device for Class I visual examination, registered with the British Medicines and Healthcare products Regulatory Agency under reference number 5943 (https://optonet.es/). The unit consists of a computer application which incorporates, along with the VA test, other different optometric tests frequently used in the Opticians’ offices for the exploration of the eye system.
The test was displayed on a 24'' monitor, which was checked and calibrated on a daily basis for the distance selected, which was three meters. In all cases, the calibration distance of the test was respected and the lighting conditions of the room were kept within a pre-determined range. The illuminance conditions of the room were measured with a Testo 540 luxometer (Testo SA, Cabrils, Barcelona, Spain) and they should fall within the range of 400 lux and 600 lux. According to Tidbury et al.,9 if this range is maintained during the measuring of visual acuity, the effect caused by the different illuminance is limited to 0012 LogMAR.
ProcedureFor the collection of demographic data and the monocular and binocular decimal VA assessments, a space was enabled in each school, where students were taken for the screening, separated by group and by school levels. The testing protocol for each patient was performed by the same optometrist, previously trained to avoid interobserver errors. In schools, there could be several children waiting in the same measuring room; consequently, in all cases, and to prevent them from memorizing the letters, the tests were presented randomly. The data collection was performed in the following order: evaluation of VA of the right eye, evaluation of VA of the left eye, and evaluation of binocular VA.
The VA measurement was always performed without optical compensation of the patients, or with their usual optical compensation, in the case of those patients who use glasses, contact lenses or are subject to an orthokeratology treatment. Subjective refraction was not performed to determine the refractive status of the patient, as it was not part of the study protocol.
The measurement was taken with the patient seated and trying to keep the monitor always at the child's eyeline level at all times.
The paediatric optotype test used was that of symmetrical letters (Fig. 1) that was being displayed by isolated VA lines containing 5 letters each. For the measurement of VA in younger individuals, over 36 months and under 72 months, the recommendations published by Cotter et al. in 201510 were followed. For younger patients or those who were unable to vocalize their responses, pairing cards were used, consisting of letters printed on a sheet, wherein the child could point out the letter which is being shown to it on the screen. For the measurement of monocular VA, occlusion glasses for children were used, which causes less rejection than the eye patch.
 are repeated, varying in size with logarithmic reduction.")
The measurement was done by isolating the rows of letters used to measure visual acuity with contour separation, following the procedure recommended by Bueno-Matilla, designers of the test.
Each complete line of the test read corresponded to 0.1 VA units and each supplementary letter equalled to 0.02 units. So, for example, the correct visualization of all the letters of the 0.5 line plus 2 additional letters of the 0,6 line would give a score of 0.54.
Preliminary studyBefore commencing the study, it has been made a preliminary study to ascertain the intersession repeatability of the test used, including a comparison of the results obtained for left and right eye decimal VA with that sample. During that pilot test, since the Bueno-Matilla unit allows the use of different letter-based tests, the eventual existence of significant differences between the results obtained through the symmetrical letters test and the Sloan Letter Chart and the Landolt C tests was also analysed.
Statistical analysisData obtained from study variables such as age and monocular and binocular VA were sent anonymized to the statistical department of the university where the statistical study was conducted. The statistical analysis consisted of:
To analyse the agreement between the tests, both in the pilot test and in the total sample, normality was assessed in the first place in order to apply parametric or non-parametric tests. Subsequently, we calculated the effect size, the intraclass correlation coefficient, the coefficients of variation and the Bland–Altman limits of agreement.
Also, in addition to the above-mentioned analysis of agreement, and in order to verify the effect of age, an ANOVA was implemented to ascertain the eye by participants‘age interaction. Likewise, we also calculated the descriptive statistical values as a boxplot diagram and the 5th, 10th, 25th, 50th, 75th, 90th and 95th percentiles for monocular and binocular VA.
All the analyses have been made with a 5% significance level (p < 005), using the IBM SPSS Statistics v.24 software (IBM Corporation, Armonk, NY, EEUU). To determine the normality and the effect size in the pilot survey, we have used the JASP v.0.13.1 software (Jasp Team, University of Amsterdam, Amsterdam, The Netherlands).
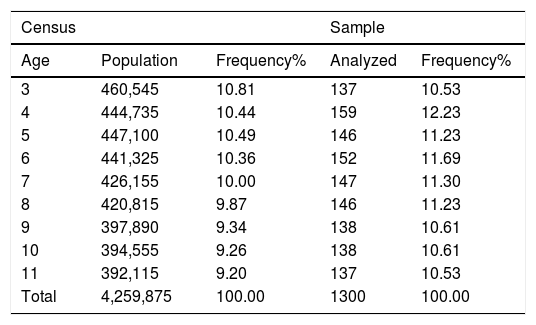
ResultsSampleIn order to homogenize the sample with respect to the census of the Spanish population, a series of individuals of 4, 7, 8, 9 and 10 years had to be randomly removed, thus leaving the sample in 1300 subjects distributed according to the census population frequency (Table 1). 51.1% of participants were male patients.
Distribution of the Spanish population from 3 to 12 years according to the census and the sample analyzed (average age: 6.93; standard deviation: 2556). The table determines the comparison between the census population during the collection of sample data and the distribution of the study sample, as well as its frequency for the different ages evaluated.
| Census | Sample | |||
|---|---|---|---|---|
| Age | Population | Frequency% | Analyzed | Frequency% |
| 3 | 460,545 | 10.81 | 137 | 10.53 |
| 4 | 444,735 | 10.44 | 159 | 12.23 |
| 5 | 447,100 | 10.49 | 146 | 11.23 |
| 6 | 441,325 | 10.36 | 152 | 11.69 |
| 7 | 426,155 | 10.00 | 147 | 11.30 |
| 8 | 420,815 | 9.87 | 146 | 11.23 |
| 9 | 397,890 | 9.34 | 138 | 10.61 |
| 10 | 394,555 | 9.26 | 138 | 10.61 |
| 11 | 392,115 | 9.20 | 137 | 10.53 |
| Total | 4,259,875 | 100.00 | 1300 | 100.00 |
- A
Comparison between the decimal VA (DecVA) of the right eye and the left eye
The comparison between the DecVA of the right eye and the left eye was analysed in the preliminary study performed with 36 subjects. To analyse whether there were differences between the measurements, the Shapiro-Wilk test of the variable was performed in the first place, resulting in acceptance of normal distribution (p = 0067). Therefore, the t-Student test was then executed, but it did not show any significant differences (p = 0486). Subsequently, effect size (ES) by Cohen´s d, intraclass correlation coefficient (ICC), the coefficient of variation (CV) of both measurements and the limits of agreement (Bland–Altman) were calculated, obtaining the following values: −0,11 [95% CI: −0,44;0,21] for the value of d; 0.70 for the ICC; and 0.17 and 0,20 as CV respectively. The Bland–Altman concordance analysis is attached as Fig. 2.
- B
Test repeatability
 versus left eye (LE) in the preliminary study. (DecVA: Decimal visual acuity).")
The repeatability of the test used (measurement 1 versus measurement 2) was analysed in the same preliminary study. To analyse whether there were differences between the measurements, the Shapiro–Wilk test of the variable was performed in the first place, resulting in the rejection of normal distribution (p < 0,01). Therefore, the Wilcoxon signed-rank test was then executed, but it did not show any significant differences (p = 0,406). Subsequently, ES by rank biserial correlation, ICC, CV of both measurements and the limits of agreement were calculated, obtaining the following values: 0.92 [95% CI: 0,67;0,98] for the rank biserial correlation; 0.97 for the ICC and 0.16 for both CV measurements. The Bland–Altman concordance analysis is attached as Fig. 3.
- C
Agreement between VA test
 versus Measurement 2 (M2) in the preliminary study. (DecVA: decimal visual acuity).")
The VA data obtained with the symmetrical letters test were compared to the Sloan Letter chart and the Landolt C tests for the same 36 subjects. To analyse whether there were differences between the measurements, the Shapiro–Wilk test of the variable was performed in the first place, resulting in acceptance of normal distribution (p > 0,05 for both comparisons). Therefore, the t-Student test was then executed, but it did not show any significant differences (p > 0,05) in VA levels between the different tests. The coefficients of agreement between the symmetrical letters test and the Sloan Letter Chart were: −0,16 [95%CI: −0,49;0,16] for the value of d, 0.71 for the ICC, and 0.16 and 0.14 as CV respectively. For the comparison between the symmetrical letters test and the C Landolt test, the coefficient of agreement results were: −0,34 [95%CI: −0,67; −0,006] for the value of d; 0.56 for the ICC and 0,16 and 0,14 as CV respectively. The Bland–Altman concordance analysis is attached as Fig. 4.
Percentiles curves and Symmetrical letters test versus the C Landolt test (down) in the preliminary study. (DecVA: decimal visual acuity).")
Percentile curves have been obtained by analysing the data collected from the sample for distant vision. In order to show one single monocular VA percentile curve, we analysed during the pilot test whether the VA values were interchangeable. As the ICC obtained was low, the same agreement tests were repeated for the total sample.
The t-Student test applied after the verification of normality did not show any significant differences (−0.02 ± 0.21; 95% reliability [−0.04: −0.01], p > 0.05). Effect size (Cohen’s d), ICC and the coefficient of variation were, for the total sample: −0.21 [95%CI: −0.27; −0.13] for the value of d; 0.89 for the ICC and 0.34 for both eyes as CV. The Bland–Altman analysis of agreement is shown in Fig. 5. An ICC value of 0.89 is deemed sufficient to consider that the results obtained for RE and LE are interchangeable.
 versus left eye (LE) for the full sample. (DecVA: Decimal Visual Acuity).")
Then, an ANOVA was made to verify the influence of age. The interaction eye by participants’ age was not significant (p = 0.142), and consequently we understand that there are no significant differences in the VA of both eyes for the ages analysed.
Thus, a single monocular VA percentile curve was calculated, corresponding to the average values obtained for both eyes.
Fig. 6 shows the box diagram for the monocular DecVA calculated at 3-month intervals, and Fig. 7 shows the monocular DecVA percentile curves with their numerical values.
. (DecVA: Decimal Visual Acuity).")
Box diagram for the decimal VA corresponding to the average of both eyes from 3 to 12 years, calculated at 3-month intervals, for the full sample. The box represents 50% of the data and the limits of the boxes correspond to Q1 and Q3, quartiles. Whiskers represent the data between quartiles and 1.5 times the interquartile range (IQR). (DecVA: Decimal Visual Acuity).

Fig. 8 shows the box diagram for the binocular DecVA at 3-month intervals, and Fig. 9 shows the binocular DecVA percentile curves with their numeric values.
. (DecVA: Decimal Visual Acuity).")
Box diagram for binocular decimal VA from 3 to 12 years, calculated at 3-month intervals, for the full sample. The box represents 50% of the data and the limits of the boxes correspond to Q1 and Q3, quartiles. Whiskers represent the data between quartiles and 1.5 times the interquartile range (IQR). (DecVA: Decimal Visual Acuity).

Percentile curves show that DecVA increases from the age of 3 years onwards, reaching a value of 1 for the 50th percentile at the age of 5 years and 3 months in monocular and slightly before that age (5 years) in binocular. The 50th percentile reaches a DecVA of 1.20 from the age of 7 years and 3 months in monocular, and before that age (6 years and 9 months) in binocular. From these ages onwards, DecVA undergoes no significant changes until the age of 12 years in monocular, and slightly increases to values around 1.5 in binocular.
DiscussionThe object of the study was to determine the percentile curves of visual acuity development, so that they may be used as a reference in the screenings and could also be used by non-qualified staff. Thus, it is critical to choose a test which is easily understood by patients and may be easily handled by the examiner3,4 That is why the visual acuity evaluation with the Bueno–Matilla unit for distant vision. This unit allows to ascertain visual acuity using different tests (symmetrical letters, Landolt, C and Sloan letters) and measurement scales (decimal or logMAR). The selection of the symmetrical letters was based on previous studies carried out by Cotter et al., as we have previously indicated. The agreement between the symmetrical letters and the remaining tests was appraised in the pilot study, and the ICC values were not very high. Therefore, the greatest reliability of the percentile curves will be obtained when the test is performed with the Bueno-Matilla unit with the symmetric letters test. This discrepancy between the tests used has already been noticed in other studies, including Bondarko et al., that found that VA, when measured with the Landolt C is 1.4 times higher than when measured with other tests.
Other factors may also influence the result, like the distance at which the test is performed, and the method of presentation of the optotypes. For the testing distance, according to Anstice et al.,11 while the use of a six-metre testing distance is considered standard for the measurement of adult visual acuity, shorter working distances such as 3.0 or 1.5 m allow for excellent repeatability and reliability when measuring visual acuity in children. In this study, the distance was the same for all age groups. As for the method of presentation of the optotypes when determining visual acuity may condition the result of the evaluation. Several studies determine that the presentation of isolated optotypes and linear optotypes is more accurate when determining this parameter, and that is the reason why visual acuity has been measured in this study by presenting linear isolated stimuli of visual acuity for each one of its levels.7
A VA value of 1.0 was obtained on the decimal scale at the age of 5 years and 3 months for a 50% percentile value for monocular VA and a little earlier (5 years) for binocular VA. If the top percentile values are analysed, the magnitudes obtained will be close to a visual acuity of 1.0 for ages from 3 years and 6 months in the 90% and 95% percentiles. Sonksen et al.4 determined in his percentile study that the 50% percentile represents the mean of measurements, achieving better visual acuity values already established in other similar studies as it is the case, for instance, of the Vision in Pre-schoolers Study Group,12,13 or those done by Shea et al.14 and Simmers et al..15 In this study in Spain, it can be intuited that the results are very similar. Although a direct comparison with the other studies cannot be made, due to the different statistical approaches that have been implemented or to other factors such as the sample size to determine the percentile curves.4,16–19 On the other hand, and according to Norgett et al.,7 the results show poorer mean acuity using the crowded tests in younger children with ages of 4 and 9 years. In this study, the method of presentation of the test does not change with age, and consequently, for ages below 9 years, VA could be higher than in the VA obtained if the test presented to the subject contains isolated letters.
Binocular visual acuity has values closer to 1.0 at younger ages than monocular visual acuity. In the case of the 50% percentile there is no significant difference, as this value is determined for an age of 5 years. By contrast, if the 75% percentile is analysed, it can be appreciated that monocular visual acuity is determined for an age of 4 years and 9 months, while binocular visual acuity can be determined for an age of 3 years and 6 months, presenting stability in that value with a subsequent improvement in visual acuity at higher ages. This summative effect of monocular visual acuity to promote binocular visual acuity has been determined in similar studies, and it is objectifiable even with the presentation of different optotypes.3,4,11,16–20
As one of the major strengths of the study, it should be mentioned the fact that these normative values presented are the only ones taken in Spain and among the few ones available in the world, including those of Soknen in the United Kingdom in 2007,3,4 the Multi-Ethnic Paediatric Eye Disease Study of 2009,21 the study undertaken in Bogotá in 201122 and the Shenzhen Kindergarten Eye Study in 2015.23
If compared this study, which was performed with a Spanish sample, with the previous ones, it´s found that the development of VA in the study population generally shows a similar evolution, despite the significant differences found in the methodology and in certain specific results.
As in the Soknen study mentioned above, Guo et al. confirm the gradual development of visual acuity without compensation. This latter one uses the value of 95% as cut-off point, pointing out that VA reaches a maximum value of 0.5 in the decimal scale in ages from 5 to 6 years. This should not be compared to this study, since the visual acuity value obtained in the 95th percentile was considerably higher for those ages. The Guo study used a ETDRS test with directional E letters, a test which is different from the one used in this research.
In the studies published by Pan et al. and Molina et al., the development of visual acuity is similar to that found in this study, reaching similar values for the same groups of age. If we analyse the 95th percentile in both studies and compare it to this one, it will be noticed that an average visual acuity value of 1 in the decimal scale is reached in all of them. This visual acuity value may already be found in younger groups, as it also happens with this study. These studies implemented a methodology which is more similar to the one used in this research, using the symmetrical letters tests as the visual acuity optotypes.
The limitations of this study must, however, be highlighted. The most important one is the type of sampling used as a result of time and economic reasons. No probabilistic sampling was executed, but a convenience sampling, which explains why the results are not directly translatable to the entire population and these curves can be understood as indicative. This circumstance should be taken into account in future studies, and a series of inclusion criteria that include the measurement of refraction should be created. Above a certain age an incipient myopia can be increasingly present, altering visual acuity without compensation. That would justify the decrease in VA levels found in the curves after the age of 9–10 years, mostly in monocular conditions.
Finally, it should be emphasised that percentile development curves make it possible to ascertain the ordinary pattern of visual acuity increase and its eventual deviations, but do not provide by themselves any indication about the health condition – in this case, ocular or visual health – of children
FinancingThe research has been funded by the CAT0001305 project of the Cátedra Fundación Salud Visual – Universidad Europea de Madrid.
This article reflects part of the results obtained in the research project "Percentiles of visual acuity and stereoacuity in children (PAVEI)", a project which has been put into effect under the auspices of the Cátedra Fundación Visual Salud (FUNSAVI) – Universidad Europea de Madrid, whom we thank for the confidence placed throughout the development of the different phases of the project.


