


Near visual acuity is an essential measurement during an oculo-visual assessment. Short duration continuous text reading charts measure reading acuity and other aspects of reading performance. There is no standardized version of such chart in Arabic. The aim of this study is to create sentences of equal readability to use in the development of a standardized Arabic continuous text reading chart.
MethodsInitially, 109 Arabic pairs of sentences were created for use in constructing a chart with similar layout to the Colenbrander chart. They were created to have the same grade level of difficulty and physical length. Fifty-three adults and sixteen children were recruited to validate the sentences. Reading speed in correct words per minute (CWPM) and standard length words per minute (SLWPM) was measured and errors were counted. Criteria based on reading speed and errors made in each sentence pair were used to exclude sentence pairs with more outlying characteristics, and to select the final group of sentence pairs.
ResultsForty-five sentence pairs were selected according to the elimination criteria. For adults, the average reading speed for the final sentences was 166 CWPM and 187 SLWPM and the average number of errors per sentence pair was 0.21. Childrens’ average reading speed for the final group of sentences was 61 CWPM and 72 SLWPM. Their average error rate was 1.71.
ConclusionsThe reliability analysis showed that the final 45 sentence pairs are highly comparable. They will be used in constructing an Arabic short duration continuous text reading chart.
La agudeza visual de cerca es una medición esencial del examen visual. Las tablas de lectura de textos continuos de corta duración miden la agudeza visual y otros aspectos del rendimiento lector. No existe una versión estandarizada de dichas cartillas en árabe. El objetivo de este estudio es el de crear frases de igual legibilidad, para ser utilizadas en el desarrollo de una cartilla estandarizada de lectura de textos continuos en árabe.
MétodosInicialmente, se crearon 109 pares de frases en árabe para construir una cartilla con un diseño similar al de la tabla de Colenbrander. Fueron creadas para tener el mismo nivel de dificultad e igual longitud física. Se reunió a cincuenta y tres adultos y dieciséis niños para validar las frases. Se midieron la velocidad lectora en palabras correctas por minuto (CWPM) y las palabras de longitud estándar por minuto (SLWPM), contabilizándose los errores. Se utilizaron los criterios basados en la velocidad lectora y los errores en cada frase para excluir los pares de frases con más características periféricas, y seleccionar el grupo final de pares de frases.
ResultadosSe seleccionaron cuarenta y cinco pares de frases, de acuerdo con los criterios de eliminación. Para los adultos, la velocidad lectora media de las frases finales fue de 166 CWPM y 187 SLWPM, y el número medio de errores por par de frase fue de 0,21. La velocidad lectora media de los niños para el grupo final de frases fue de 61 CWPM y 72 SLWPM. Su índice medio de error fue de 1,71.
ConclusionesEl análisis de fiabilidad mostró que los 45 pares de frases finales son altamente comparables. Se utilizarán para construir una tabla de lectura de textos continuos de corta duración en árabe.
Reading is essential in modern life and is the most common rehabilitation goal for people with low vision.1 Inability to read significantly affects quality of life and so aspects of reading are usually included in vision-related quality of life measures.2–5 Reading acuity measurement (acuity for text or words) is important in assessing a patient's reading performance6 and in understanding the impact of eye disease.7–9 Although there is a good correlation between distance letter acuity and word or text acuity,10–12 they are not equal,10,13,14 and word or text reading acuity is more related to everyday reading tasks.15,16 Charts using short duration continuous text are considered a better representation of a person's vision for everyday reading than charts using unrelated words15,16 as reading short duration sentences includes cognitive and visual factors, e.g. effects of context and crowding.6 They quickly assess a patient's near reading acuity and can also measure maximum reading speed and critical print size (the smallest print to achieve maximum or near maximum reading speed).6 These measures indicate the potential for reading small print fluently, and are used to estimate the required magnification for reading in patients with low vision. The use of standardized sentences and layout is important, so that the print size is the only parameter that affects the threshold, and not variability in the text difficulty or crowding effects, so as to ensure reliable and repeated results.17–20
The concept of using standardized sentences of equal length and difficulty was first introduced by Legge and co-workers in 1993 and developed into the MNREAD charts.21 Radner et al.22 developed the concept further, creating sentences which were equal in terms of lexical and syntactical difficulty, word length and positioning of words within the sentence. Continuous text reading charts are now available in many languages.19,20,23–28 Arabic is ranked as the fifth spoken language (in number of first language speakers) and is spoken in 60 different countries globally, with approximately 237 million native speakers.29 Despite this there is no short duration standardized Arabic reading acuity chart. There have been a number of attempts to develop Arabic distance and near letter visual acuity charts,30–35 but none of them have been produced or are commercially available. The lack of standardized continuous text reading charts has made the use of non-standardized charts very common. These are either created and printed by clinicians or freely distributed by eye-care companies for advertisement purposes. These charts use sentences that have not been developed according to the recommendations for standardized reading acuity charts6,16,17,36 and they have not been tested for reliability and repeatability. It is important that chart variables, such as text typeface, text difficulty, and text length should be equal for different acuity levels so that comparable results are given with different versions of the chart. The one standardized reading chart in Arabic is the IReST texts,24 but this is primarily a measure of reading speed rather than reading acuity. It is composed of paragraphs of text in one size of print.
Reading charts are available in different types. They differ in their design (i.e. unrelated words, mixed contrast, long passages)24,25,37,38 and test purposes (reading comprehension, silent reading).39,40 The ultimate purpose is the development of the first standardized short duration continuous text near reading charts in Arabic. This type of chart is commonly used, is easily administered clinically and gives results which are related to daily reading material.6 The final layout was chosen to be similar to the Colenbrander charts which uses pairs of equal length sentences in a logarithmic size progression. Although his sentences were created based on certain criteria (e.g. words no longer than 10 letters), they were not formally tested for difficulty of reading. Retrospectively, they were found to be of grade 4 difficulty (Colenbrander, personal communication). There are two approaches to the development of standardized sentences. Either sentences are generated that are matched according to the number of characters and physical length and then empirically tested6,21 or sentences are generated to have equal lexical and syntactical difficulty, word length and positioning of words.22 As this is the first chart in Arabic, we chose the former method. The aim of this initial study is to create Arabic sentences of equal readability to be used in the development of these charts. Since the characters and writing in Arabic are complex and quite different from Roman letters, there are many decisions to be made regarding the choice of typeface and print characteristics. This paper describes the rationale for these decisions and the creation of a set of sentences with good reliability.
MethodsChoice of typefaceIt has been suggested by other researchers6,37,41 that the optimum font would be the most commonly used font in everyday printed material such as newspapers, magazines, books, etc. However, most Arabic newspapers use their own specially designed font, whereas most English newspapers use commonly available proportionally spaced serif fonts (e.g. Times New Roman).6 The exact fonts used in popular Arabic newspapers are not available, for use by others and thus, could not be used. Therefore, the closest available font in Microsoft Word© was chosen, which was Arabic Times New Roman font. This choice had additional advantages. Firstly, it is frequently used in reading charts of other languages.6,19,24,26,28 Secondly, Arabic Times New Roman font in Microsoft Word© does not use ligatures, which are specific Arabic font characteristics. A ligature is used when more than one character is joined to form a single glyph (a readable character or shape) (Fig. 1) and they cannot be eliminated. The use of a ligature could affect the readability, as it changes the shape and height of a word and may cause more crowding, especially in small font sizes and for people with low vision. Thirdly, it has been shown that Arabic Times New Roman results in enhanced reading performance compared to Courier.42
 A sample of a five-letter word (which means community) in Times New Roman font. The numbers 1–5 indicate each letter. (B) The same word with a ligature using Arabic typesetting font.")
A second decision was not to use vocalization marks, as they are absent in everyday materials,43,44 like newspapers. Experienced readers fluently read unvocalized text by using contextual clues.44 Vocalization marks are usually used to clarify the pronunciation of certain words. They are commonly used as learning aids for children and beginner readers, in dictionaries and some literary materials,44 in poetry43 and the Quran, where it is imperative to avoid misreading. However, general readability improves without vocalization marks when in conjunction with the simplest font.43
Creating a set of sentences with high reliabilityThe ultimate goal is to produce three versions of Arabic continuous text near visual acuity chart, so that repeated testing is possible (e.g. binocularly and monocularly). The charts will be developed to be similar in design to the Colenbrander near acuity charts, in which each font size has a pair of unrelated sentences designed to be of the same length and difficulty, with the same number of characters including spaces and ending with a full stop or question mark. For the Arabic chart, it is planned that each chart will have fifteen pairs of pairs of sentences in a logarithmic progression of decreasing print size. Ultimately, forty-five pairs of sentences are needed to produce the three different charts. Candidate sentences were initially developed by BA based on the content and the vocabulary of grade three Arabic schoolbooks and with the help of two Egyptian Arabic school teachers. The sentences in each pair were independent of each other in their semantic content and were designed so that each is printed on a separate line. They were created at approximately the same level of difficulty, the exact same physical length, and the same number of characters with spaces for each pair of sentences (102 characters). The number of words in each pair ranged from 16 to 22 and no words had more than ten letters (Fig. 2). Two sample sentences in Arabic with their English translation can be seen in Fig. 2. The sentences were then checked by three Arabic language specialists from Saudi Arabia for grammatical and sentence structure accuracy. Lastly, the sentences were sent to three other readers, from Libya, Egypt and Morocco to check that the sentences did not contain cultural inaccuracies in these countries. The use of people from several Arabic countries insured that the sentences are understandable across different Arabic countries and cultures.

The sentences were printed in Microsoft Word© using Arabic Times New Roman font, in a font size that was well above the thresholds of participants with normal visual acuity, so that reading accuracy and speed would not be limited by vision, but by the readability (difficulty) of the text. Thirty-five point size was chosen, which is the largest font that would fit easily on a standard 8.5 by 11in. (21.6cm×27.9cm) page in landscape orientation. Since there is no measurement of the size of print in Arabic similar to the “x” height45 in English, this print size cannot be compared directly with Roman letter point sizes or x heights. However, in the current study this lack of clear comparison is not expected to have an impact, as the print size was not varied. All the sentences were printed in this chosen size and of the same font. Determining an equivalent of the “x” height will be the subject of future studies. Each pair of sentences was printed in landscape orientation at the center of an 8.5in.×11in. separate page using 1.15 line spacing and all pages were inserted in a binder folder. The folder was supported on a wooden reading stand to easily display the sentences. A standard reading distance of 40cm was used for adults and 30cm for children. A thread measuring 30 or 40cm was attached on the side of the stand to measure the exact reading distance and was used to frequently check the reading distance and to keep it constant.
ParticipantsThe sample consisted of 69 native Arabic speakers from twelve different countries. Snowball sampling was used to recruit fifty-three adults from the University of Waterloo and from the city of Riyadh in Saudi Arabia. The inclusion criteria were being a fluent Arabic speaker, VA 6/7.5 or better (with habitual correction) and no known eye disease.
The adult participants were aged from 18 to 60 years (mean 31.1) and included 31 males and 22 females. In terms of their education, 41% had completed high school, 29% had completed first post-secondary studies, and 30% of the participants had completed post-graduate studies. For the child sample, seven male and nine female grade three participants were recruited.
Distance visual acuity was measured binocularly using an EDTRS logMAR chart (for those who could recognize Roman letters) or a LEA Symbols® Massachusetts Flip Chart at 3m (for those who did not know Roman letters). Near visual acuity was measured using a Sloan Letter Near Vision Card or a Lea symbols® near vision card at 40cm.
Grade three students were recruited from Altarbiya Alislamiya Schools in Riyadh, Saudi Arabia. The inclusion criteria were as follows: age 7–8 years (grade three), fluent Arabic speaker, no known learning or reading disability or special needs, no Autism or behavioral issues as reported by the parents. Distance visual acuity was measured binocularly using the LEA Symbols® Massachusetts Flip Chart at 3m and near visual acuity was measured with Lea symbols® near vision card at 40cm.
ProcedureThe luminance of the paper was set to be ≈130cd/m2. Participants’ ocular and general health history was recorded.
The order of the sentence pairs was randomized for each participant and all participants were videotaped while reading the sentences. Participants were instructed to read aloud as fast as possible without sacrificing accuracy but not to worry if they did make an error, i.e. they were encouraged to keep reading even if they realized they had made an error. To familiarize participants with the reading procedure, they began by reading three demonstration pairs of sentences. Flipping pages was performed by the examiner to control the reading distance and the presentation. The number of errors for each sentence pair was recorded for each participant. The time taken to read each pair of sentences and the number of errors were determined after the reading session by reviewing the participants’ videos. This allowed an accurate calculation of the speed in “correct words per minute” (CWPM, see below).
The study was approved and received full ethics clearance from the Office of Research Ethics, University of Waterloo. All participants gave their written informed consent prior to participation in the study.
Data analysisNineteen sentence pairs were eliminated before carrying out any formal analysis. This is because a large number of participants made several errors while reading them because of the text flow or stumbled because of difficulties in pronunciation and/or commented that the sentences did not make good sense. For the remaining ninety sentence pairs, the maximum and mean number of errors and the standard deviation of errors were calculated for each sentence pair. The following measures of reading speed were calculated for each participant for each of the 90 remaining sentence pairs.
Correct words per minute (CWPM)
CWPM was included as it is more likely to be used by clinicians than SLWPM (below). However, CWPM can result in more variability6,16 in reading speed because of the variability of word length in different pairs of sentences. So therefore SLWPM was also used to calculate reading speed in this study.
Correct standard length words per minute (SLWPM)Measuring reading speed in standard length words has been used in reading speed research in English.12,46,47 To the authors’ knowledge, there are no published data giving the average or standard word length in Arabic. This was calculated from a selection of three typical types of articles (general, sports and politics). One of each type was selected from thirteen Arabic newspapers, which originated from ten different Arabic countries (i.e. a total of 39 articles). In addition, three articles were taken from one woman's and one man's magazines (total of six articles). The average word length in these Arabic articles was 4.7 characters. For this study, the average word length in Arabic was rounded to five characters. For comparison, the average word length (without spaces) was also 4.7 in the 90 pairs of sentences that were analyzed for this study.
Since there are exactly 20.4 standard words in each sentence, reading speed in correct standard length words per minute (SLWPM) was calculated as follows.

Finally, all reading speed values were converted to log units and the mean reading speed and the standard deviation (SD) (calculated for both CWPM and SLWPM) for each sentence pair was calculated.
Selecting sentences with similar readability characteristicsThe data of children and adults were analyzed separately. As there was a larger sample of adults, the adult data were used first to finalize a group of sentence pairs with equal readability characteristics, and a higher percentage of sentences were eliminated based on the adult data. The distributions of reading speed were checked for normality using the D’Agostino & Pearson omnibus normality test. Pairs of sentences were eliminated according to the following criteria:
- •
To equalize the reading speeds for both CWPM and SLWPM of the sentence pairs, the 90% interval was calculated (mean±1.645×SD) and all sentences that fell outside this range (i.e. in the higher and lower 5%).
- •
To eliminate those sentence pairs with more variability in reading speed, those in the highest percentile (10%) of the SD of CWPM and SLWPM.
- •
To eliminate those sentence pairs which gave more errors, those in the highest percentile of the mean number of errors.
- •
To eliminate those sentence pairs with more variability in errors, those with the highest percentile of the SD of errors.
- •
To eliminate those which gave higher errors, sentence pairs in the highest percentile (to the nearest integer) of the maximum number of errors.
Sentence pairs were eliminated in a two-step process. Firstly, each criterion was applied separately, and the results were reviewed to ensure that these eliminations would not result in too many sentence pairs being eliminated from the total. This was not the case and so then all the criteria were applied and any sentence pair that met any of the above criteria for the adult data were eliminated. At this first step 35 sentences were eliminated.
Secondly, based on the remaining sentences, a similar analysis was performed using the child data to eliminate any obvious outliers. The 95% interval for SLWPM was calculated (mean±1.96×SD) and pairs of sentences that fell outside this range (in the highest and lowest 2.5%) were eliminated. Additionally, pairs of sentences which gave the highest percentile of the mean number of errors and the highest percentile of the maximum number of errors were eliminated.
The Cronbach's alpha coefficient was calculated for the final set of sentence pairs to determine inter-item (sentence pair) consistency/reliability.
ResultsAdults’ distance and near visual acuity ranged between −0.18 to 0.12 (mean −0.11logMAR) and −0.28 to 0.10logMAR (mean −0.09logMAR), respectively. The childrens’ distance and near visual acuity ranged between −0.10 to 0.20 (mean 0.01) and −0.12 to 0.10logMAR (mean 0.02) respectively.
For the adult data, the distributions of the two measures of reading speed were both normally distributed (p=0.87 for CWPM and p=0.36 for SLWPM). Thirty-five sentences were eliminated after applying all the elimination criteria on the adult data. The results of the elimination process for adults are shown in Fig. 3 which shows reading speed of adults for all 90 sentence pairs before and after elimination according to all elimination criteria. Fig. 4 shows histograms of the mean number of errors for adults for each sentence pair and the maximum number of errors for each sentence pair.
 for each sentence pair (adults). Red lines show the 90% interval of all 90 sentences. (A) Reading speed in CWPM for all 90 sentences pairs. (B) CWPM for final set of sentence pairs using all exclusion criteria. (C) Reading speed in SLWPM for all 90 sentences pairs. (D) SLWPM for final set of sentence pairs using all exclusion criteria.")
Mean reading speed (log units) for each sentence pair (adults). Red lines show the 90% interval of all 90 sentences. (A) Reading speed in CWPM for all 90 sentences pairs. (B) CWPM for final set of sentence pairs using all exclusion criteria. (C) Reading speed in SLWPM for all 90 sentences pairs. (D) SLWPM for final set of sentence pairs using all exclusion criteria.
. (A) Average number of errors for all 90 sentences pairs. (B) Average number of errors for final set of 45 sentence pairs. (C) Maximum number of errors for all sentence pairs. (D) Maximum number of errors for final set of 45 sentence pairs.")
Histograms of mean number of errors and maximum number of errors for each sentence pair (adults). (A) Average number of errors for all 90 sentences pairs. (B) Average number of errors for final set of 45 sentence pairs. (C) Maximum number of errors for all sentence pairs. (D) Maximum number of errors for final set of 45 sentence pairs.
The childrens’ data were analyzed subsequently. Based on the remaining 55 sentences, the 95% interval (mean±1.96×SD) of children's reading speed was calculated in SLWPM. Sentence pairs that fell outside the 95% interval were eliminated. Also sentence pairs in the highest 10% of average number of errors and maximum number of errors were excluded. Final reading speed for the children in SLWPM is shown in Fig. 5 and the final number of errors and maximum number of errors are shown in Fig. 6.
 for children for the final set of 45 sentence pairs using all exclusion criteria.")
. (A) Average number of errors. (B) Maximum number of errors.")
The second elimination process resulted in 47 sentences. This allowed us to eliminate two more sentences to obtain 45 sentences. The sentence with the next highest mean number of errors and the sentence with the next highest maximum number of error based on the children's data were excluded.
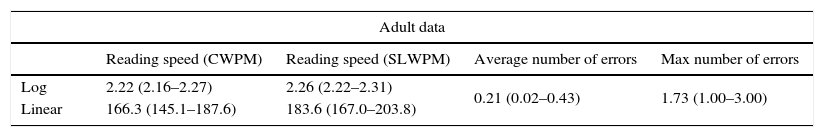
Forty-five sentence pairs remained after these elimination procedures and these will be used to create three versions of an Arabic continuous text reading chart. Table 1 shows the summary of the final sentence pairs after elimination for adults and children.
Mean (range) of the final 45 sentence pairs (based on adult and child data).
| Adult data | ||||
|---|---|---|---|---|
| Reading speed (CWPM) | Reading speed (SLWPM) | Average number of errors | Max number of errors | |
| Log | 2.22 (2.16–2.27) | 2.26 (2.22–2.31) | 0.21 (0.02–0.43) | 1.73 (1.00–3.00) |
| Linear | 166.3 (145.1–187.6) | 183.6 (167.0–203.8) | ||
| Child data | |||
|---|---|---|---|
| Reading speed (SLWPM) | Average number of errors | Max number of errors | |
| Log | 1.81 (1.69–1.90) | 1.71 (0.88–2.76) | 5.51 (3.00–8.00) |
| Linear | 63.9 (48.9–79.7) | ||
The Cronbach's alpha coefficient was calculated to support that the final set of sentence pairs were reliable to be used in the construction of the new Arabic reading charts. The Cronbach's alpha for the final set of sentence pairs in CWPM and SLWPM was 0.986 for adults and 0.996 for children.
The average reading speed (CWPM) of adult participants ranged from 117.7 to 252.4 (mean 166.4±34.3) and for children this ranged from 20.5 to 103.6 (mean 60.6±27.9).
DiscussionThe aim of this study was to create Arabic sentences of equal difficulty to be used in the development of the first standardized Arabic short duration continuous text reading acuity charts. The charts will be designed to measure near visual acuity as well as reading speed, critical print size and reading acuity for children and adults. It is intended that each chart will have fifteen descending print sizes in a logarithmic progression, which will allow print that is large enough to measure near visual acuity in patients with low vision.
The sentences were tested with 35 point size (pt) print, which may sound large in the context of Roman print. However, Arabic is approximately 2× smaller than Roman print (i.e. 35 point in Arabic appears smaller than 35 point in Roman print) so when this is taken into account, the print size is not abnormally large. Additionally, preliminary data showed that reading speed for 35 point print in Arabic is within the range of print sizes that gives maximum reading speed. These preliminary findings indicate that using 35 point print for testing sentences did not introduced a ceiling effect for reading speed.
So far, standardized continuous text charts are available in nineteen languages, or more. Most of these languages use Roman script. Recently, researchers have developed the IReST text charts24 which are standardized long passage reading charts available in seventeen different languages, including Arabic. These charts are designed with one print size only (1M) to measure and assess reading speed and compare it across different languages. The developers based the texts for different languages on the original German IReST chart, with modifications for language differences i.e. they did not create new text for each language.25 They have reported differences in text length across languages due to differences between alphabetic and non-alphabetic languages.24 Many scholars16,19,26 hold the view that direct translation of sentences from an existing standardized chart to a different language is often impractical and not ideal because each language has specific orthographic differences. Grammar, spelling, average word length, word breaks, hyphenation, and the use of vocalization marks are all different and all make direct translation difficult. The Turkish language uses the same Roman characters as English, plus seven extra letters that are modified to meet the unique phonetic requirements of the language. In Greek the differently formed Cyrillic alphabet is used. In comparison, Arabic uses a completely different alphabet. Unlike Roman characters, where letters are written individually from left to right, Arabic is written from right to left in a cursive style only. These factors make translation inappropriate in the development of consistent sentences. In order to achieve uniformity in the total number of characters and physical length on the line, new sentences have to be composed for some languages.19,26
Therefore, in the present study we developed new sentences in Arabic, which were composed following the layout of the Colenbrander chart. The present study utilized methodologies similar to other studies in the creation and testing of sentences.16,19,26 It is a common practice to use schoolbooks to create sentences of a certain grade level. This approach was used for the Greek MNREAD chart,19 MNREAD Turkish chart26 and UiTM-Mrw Malay chart.28 Language experts were consulted to verify the correctness of grammar and sentence structures in these charts19,24–26 and lay readers also checked for cultural differences.
Videotaping was chosen as a more accurate method of timing to measure reading speed than the use of a stopwatch. A number of previous studies20,48–50 have based their reading speed measurements on video or audiotape records, which reduces variability in reading speed measurements compared to the use of a stopwatch, as the measurement is done after the reading session.16 Rubin51 identified several factors, including examiner reaction time in timing each sentence, false starts, and the habit of self-correcting errors by readers, which may affect reading speed measurement precision and repeatability with a stopwatch. In addition, the decision about errors must be made in real time and cannot be re-checked, as it can with videotaping. Brussee et al.16 and Rubin51 discussed how the number of examiners/raters used in a study and their training may contribute to the variability of the reading measurement. In the current study, only one examiner (BA) carried out reading sessions and reading speed calculations from recorded videos.
Adults19,20,23–25,27,28 of varying educational levels and grade 3 children19,26 were recruited to measure the reliability of the sentences, so that the charts can be used for people with reading ability of grade 3 upwards. The Cronbach alpha of the sentence pairs in the present study was 0.99 for both adults and children. This compares very favorably to the study by Radner et al.,20 in which the calculated Cronbach alpha coefficient was 0.98 for short German sentences, which were used to construct the German Radner reading charts.
The adults’ average reading speed in CWPM obtained in the current study ranged between 118 and 252 (mean 166±34). The only other study which gives reading speed for Arabic reading test charts is the study by the IReST group,24 which reported an average reading speed in WPM of 138±20, which is similar to the current study. This similarity is despite differences such as the grade level of text (the IReST used a higher grade level), the size of the print (IReST used 1M) and the fact that IReST did not take errors into account. Alsaiari and Azmi52 reported an average Arabic reading speed for University students reading passages without vocalization marks of 164.27±7.57 WPM and 128.98 SD±5.47 for two different Arabic fonts, which is similar to the reported reading speed here.
These results indicate that reading speed for Arabic may be slower on average than for English. This difference was reported by the IReST group,24 reading speed in words per minute in Arabic was lower compared to English and compared to all other alphabetic languages that they measured. In fact English resulted in the highest reading speed of all the languages when measured in WPM (228±30 wpm in English compared to 138±20 WPM in Arabic).
In the current study, children's reading speeds in CWPM ranged between 20 and 104 (mean 61±28). The only comparable data is that of Hussien,53 which showed a median oral reading rate of 90 WPM in 6th grade children. The obvious reason for the higher reading rate in Husseins's study is the higher grade levels of the children (6th versus 3rd grade readers). However, comparing reading speeds between different studies must be interpreted with caution. Testing methods and procedures play a large role on the resulting average reading speed, and may explain the differences in the results.16
Developing the new chartsPrototypes of the final charts were printed on 11 by 14in sheets, which is a similar overall size to the MNREAD chart. They were printed in landscape orientation to accommodate the largest font. The font size ranged from 63.5 pt to 2.5 pt. The largest three pairs of sentences were printed on one side and twelve smaller pairs of sentences were printed on the other side. Sentences were arranged with size progression in increments of 0.1 log steps. The typical layout of one side of the chart is shown in Fig. 7.

Preliminary data with twenty bi-lingual participants compared near reading visual acuity between the newly designed Arabic charts and the standardized MNREAD English chart. The results showed that most of the participants’ threshold with the Arabic charts was 4 point size which is the third sentence from the bottom of the chart (i.e. the third smallest size). This gives two levels below the acuity level of almost all participants. This similar to the MNREAD chart with which the reading acuity of most participants was −0.1logMAR which is the fifth sentence from the bottom of the chart. Note that the MNREAD chart has 19 size levels compared to 15 levels on the newly designed Arabic charts. Thus the number of supra-threshold levels of the Arabic chart will be 12 compared to 14 for the MNREAD, ensuring that sufficiently supra-threshold print sizes are available to measure a threshold in patients with low vision.
ConclusionsThe current study developed and determined the reliability of a group of forty-five sentence pairs which have similar readability to one another and which will be used to create short duration Arabic continuous text reading charts. We have also presented data on reading speeds for Arabic text for both adults and children.
Conflicts of interestThe authors report no conflicts of interest and have no proprietary interest in any of the materials mentioned in this article.
We would like to thank Dr. Mosa Alawees, Hamada Ahmed and Fateh Talluge for their help in sentence creation. Dr. Mohammed Almulla and Dr. Sulaiman Alayuni for their grammatical revision of the sentences. Majeda Alsumai for her assistance in recruiting participants from Altarbiya Alislamiya Schools. Also, we would like to thank Professor Gordon Legge for his valuable advice and support. This research was funded by King Saud University, Saudi Arabia.


