


To evaluate the features of retinal and choroidal microcirculation and structure in patients with amblyopia compared to healthy adolescents of the same age (>10 years old). To classify and diagnose amblyopia using machine learning techniques on optical coherence tomographic angiography (OCTA) images.
MethodsNineteen adolescents aged 11–17 with hyperopic refractive amblyopia and 22 age-matched healthy controls underwent 12 × 12 mm macular OCTA scans. The eyes were classified into three groups: amblyopic, contralateral non-amblyopic, and control. Retinal thickness (RT), choroidal thickness (ChT), and perfusion densities in the superficial capillary plexus (SCP) and deep capillary plexus (DCP) were measured across nine regions. A combination of statistical analysis and machine learning, including cross-validation and Random Forest classification, was used to enhance the diagnostic accuracy and classify amblyopic and normal eyes.
ResultsRetinal thickness was significantly higher in the amblyopic eyes compared to the control group in multiple regions, including the central (p < 0.001), nasal (p < 0.01), and temporal zones(p < 0.01). Choroidal thickness was also greater in the amblyopic eyes, particularly in the central and nasal regions (p < 0.05). However, no significant differences were observed in the perfusion densities of SCP and DCP. The machine learning classification model incorporating cross-validation achieved an accuracy of 92%, with Random Forest demonstrating improved classification and feature importance analysis.
ConclusionThe results indicate that eyes with refractive amblyopia have notably thicker retinal and choroidal layers, particularly in the central and nasal regions. Combining OCTA data with machine learning creates a strong diagnostic framework for detecting changes in the retina and choroid associated with refractive amblyopia. Utilizing sophisticated classification methods, like Random Forest and cross-validation, improves diagnostic precision and presents new possibilities for automated clinical evaluation.
Amblyopia, usually caused by abnormal binocular interactions during the critical period of visual cortex development, is characterized by decreased visual acuity in one or both eyes, although no detectable ocular abnormalities are present.1,2,3 In young children, prolonged occlusion therapy of the better (non-amblyopic) eye is often effective in improving visual function.1,2,3,4 However, as visual plasticity decreases significantly after the critical developmental period, the treatment of amblyopia in older children and adults becomes increasingly difficult.1,2,3 As a result, amblyopia remains a leading cause of visual impairment in adults due to late detection or inadequate treatment in childhood.5,6,7 If left untreated during the appropriate developmental window, amblyopia can lead to irreversible visual impairment.5,6,7
Although amblyopia has traditionally been viewed primarily as a cortical disorder, there is increasing evidence that structural and functional abnormalities may extend beyond the visual cortex to other components of the visual pathway. For instance, some studies have identified microstructural changes in the lateral geniculate nucleus, while the involvement of the retina is still under debate.8,9,10 The retinal capillary network, which supplies vital oxygen and nutrients to the retina, plays a central role in maintaining visual function. Similarly, the choroidal circulation, which supplies the outer layers of the retina, is crucial for maintaining healthy vision. It suggests that the mechanisms behind amblyopia are not limited to the visual cortex and may also involve other parts of the visual pathway. This opens up a new perspective for understanding the condition by examining the structure and microcirculation of retina and choroid.
Optical coherence tomography angiography (OCTA), a non-invasive imaging technique, provides high-resolution imaging of retinal and choroidal blood flow and structure. This modality has demonstrated significant value in diagnosing and monitoring vascular alterations associated with retinal diseases. Emerging evidence highlights its potential in identifying structural abnormalities in amblyopic eyes.11,12 Research leveraging OCTA has observed differences in the retinal and choroidal structures, optic nerve head, and vasculature between amblyopic and normal eyes. However, discrepancies across studies, arising from variations in methodologies, sample characteristics, and measurement standards, have impeded the formation of a unified consensus. Notably, data on older children and adolescents with amblyopia, especially those with refractive amblyopia, remain scarce.
This study aims to assess the retinal and choroidal structures as well as the microcirculation in the amblyopic eyes of older adolescents with refractive amblyopia using OCTA. Through the integration of machine learning techniques, the research further explores diagnostic applications and investigates potential underlying mechanisms. This comprehensive approach addresses existing gaps in knowledge and offers new insights into the pathophysiology and diagnostic strategies for amblyopia in this demographic.
MethodsThis case-control study was conducted from March 2022 to September 2023 at Tianjin Eye Hospital. Nineteen subjects aged 11 to 17 years with hyperopic refractive amblyopia and 22 age-matched healthy controls were included. The study protocol was approved by the Ethics Committee of Tianjin Eye Hospital (2021040) and adhered to the Declaration of Helsinki principles. Informed consent was obtained from all participants and/or their legal guardians. Hyperopic refractive amblyopia was defined as best-corrected visual acuity (BCVA) lower than age-matched standards due to hyperopic refractive error during visual development. The inclusion criteria for amblyopic participants were: (1) no prior refractive correction or amblyopia treatment in the past two years; (2) no nociceptive hypersensitivity, glaucoma, or cerebral disorders; and (3) no mixed amblyopia or systemic diseases. Exclusion criteria included poor cooperation, mental retardation, or poor general health.
All participants underwent comprehensive ophthalmological examinations, including BCVA assessment using LogMAR charts, slit-lamp biomicroscopy, refractometry with dilated pupil (RKT7700; NIDEK, Gamagori, Japan), corneal topography, and contrast sensitivity testing. OCTA (VG200I; Vision Micro Imaging, Henan, China) was used to perform 12 × 12 mm macular scans, dividing the macula into nine regions: central, inner nasal, inner superior, inner temporal, inner inferior, outer nasal, outer superior, outer temporal, and outer inferior. Retinal and choroidal thicknesses were measured, and perfusion density data were obtained. Images with significant artifacts or a signal strength index < 7/10 were excluded.
Statistical analysis was performed using SPSS 27 (IBM Corp., Armonk, NY, USA). Categorical variables were expressed as numbers and percentages, while continuous variables were presented as mean ± standard deviation or median (interquartile range). Group differences were evaluated using analysis of covariance (ANCOVA), controlling for axial length, and p < 0.05 was considered statistically significant.
In addition to statistical analysis, a logistic regression model was applied to classify amblyopic, contralateral non-amblyopic, and healthy eyes based on retinal and choroidal thickness data. The dataset was divided into training (80%) and testing (20%) sets. Features were standardized to eliminate scale differences. Model performance was assessed using confusion matrices, Receiver Operating Characteristic (ROC) curves, precision, recall, F1-score, and ROC-AUC. Cross-validation was conducted to ensure model robustness.
This study adhered to the STARD (Standards for Reporting of Diagnostic Accuracy Studies) guidelines to ensure transparency and completeness in reporting diagnostic accuracy research. The checklist items were systematically addressed throughout the study design and analysis.
ResultsA total of 38 eyes of 19 patients with refractive amblyopia were included in this study, including 13 males and 6 females, with a median age of 13 (11–17). Amblyopic eyes (AE: 4.02±2.59 D) showed significantly higher spherical equivalents than non-amblyopic eyes (NE: 0.98±2.4 D, P < 0.001) and control eyes (CE: −2.39±2.13 D, P < 0.001), with NE also exhibiting higher SE than CE (P < 0.001). LogMAR visual acuity in AE (0.37±0.35) was significantly worse than in CE (0.00 ± 0.00, P < 0.001) and NE (0.00±0.03, P < 0.001), while no difference existed between NE and CE (P = 0.992). Age (P = 0.415) and sex distribution (P = 0.747) showed no statistical differences, indicating balanced baseline characteristics. All participants were of Chinese ethnicity (Table 1).
Demographic and baseline characteristics of the study population.
Unpaired t-test was used for analysis of continuous variables, χ2 test was employed for analysis of categorical variables, data shown as mean ± SD. AE, amblyopia eyes; NE, non-amblyopia eyes; CE, control eyes; SE, spherical equivalents; VA(LogMAR), logarithm of the minimum angle of resolution; F, female; M, male; D, diopter; SD, standard deviation. AE and NE represent paired eyes of the same individuals.
Through the examination and comparative analysis of macular RT within 6 mm of macular diameter in the three groups, the thickness of macular RT in the amblyopic eyes was thicker than that of the control group in the central, inner ring nasal, superior, inferior, outer ring nasal, superior, temporal, and inferior regions, and there was no significant difference between the thicknesses of the two groups in the inner ring temporal lateral region (p = 0.829); the thicknesses of macular full-layer RT in the non-amblyopic eyes were also higher than that of the control group in the central, inner ring nasal, superior, temporal, and inferior, and outer ring nasal, superior, temporal, and inferior thicknesses were also higher than those of the control group; the thicknesses of macular whole-layer RT in the outer ring temporal (p = 0.004) and inferior (p = 0.008) were higher than those of the contralateral non-amblyopic eyes in amblyopic eyes, and there were no significant differences in the other subregions (Figs. 1-3 and Table 2).

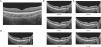
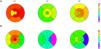
The thickness and blood flow density were obtained by 12 × 12 mm scanning. A. Comparison of retinal thickness (μm) between amblyopic eyes, normal eyes and contralateral non-amblyopic eyes; B. Comparison of inner retinal blood perfusion density (%) in amblyopic eyes, normal eyes and contralateral non-amblyopic eyes. AE amblyopia eyes, NE Non-amblyopia eyes, CE control eyes.

A. Schematic representation of retinal stratification on OCTA scanning. B. Schematic of the full, inner and outer retinal thickness scans. C. Schematic representation of retinal blood flow, superficial blood flow and deep blood flow density scanning areas. D. Schematic of the range of choroidal thickness scans. ILM Internal limiting membrane, IPL Inner plexiform layer, BM Bruch’s membrane, OPL Outer plexiform layer. CSI Choroid-scleral interface.

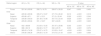
Comparison of macular retinal thickness in amblyopic eyes, normal eyes and non-amblyopic eyes in nine regions.
AE, amblyopia eyes; NE, non-amblyopia eyes; CE, control eyes.
The inner macular RT of the amblyopic eyes was higher than that of the control group in the central, inner ring nasal, superior, inferior, outer ring superior, temporal, inferior, no significant difference was seen in the outer ring nasal side (p = 0.299), while in the inner ring temporal side, the inner RT of the amblyopic eyes was lower than that of the control group (p < 0.001); the non-amblyopic eyes were greater than that of the control group compared to the control group in the central, inner ring nasal, temporal, inferior, outer ring superior, temporal, inferior, but no significant difference was seen in the inner ring superior (p = 0.077), and outer ring nasal side (p = 0.156) no significant difference was seen between the two groups; the amblyopic eyes were larger than the contralateral non-amblyopic eyes in the central area, inner ring nasal, superior, outer ring temporal, inferior, compared to the non-amblyopic eyes, and there was no significant difference in the inner RT between the two groups in the inner ring inferior (p = 0.277), outer ring nasal (p = 0.891), superior (p = 0.470), and in the inner ring temporal side, the inner RT was lower in the amblyopic eyes than in the non-amblyopic group (p < 0.001) (Figs. 1, 2 and Table 3).
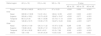
Nine-zone comparison of macular retinal inner layer thickness in amblyopic eyes, normal eyes and non-amblyopic eyes.
AE, amblyopia eyes; NE, non-amblyopia eyes; CE, control eyes.
The outer macular layer RT of amblyopic eyes was greater than that of controls in the central zone, inner ring nasal, superior, inferior, outer ring nasal, superior, temporal, inferior, with no significant difference in the inner ring temporal side (p = 0.087), while in the central zone (p < 0.001), inner ring nasal side (p < 0.001), and inner ring superior (p < 0.001), the outer layer RT of amblyopic eyes was lower than that of controls; in the non-amblyopic eyes compared to controls, the non-amblyopic eyes had greater RT in the central region, inner ring nasal, superior, temporal, inferior, outer ring nasal, superior, temporal, inferior were greater than those of the control group; amblyopic eyes compared to contralateral non-amblyopic eyes had higher RT on the temporal side of the outer ring (p = 0.038) and below the outer ring (p = 0.025) than non-amblyopic eyes, and between the two groups on the temporal side of the inner ring (p = 0.359), inferior (p = 0.122), and on the nasal side of the outer ring (p = 0.074), and superior (p = 0.076) There was no significant difference in outer RT, while in the central region (p < 0.001), inner ring nasal (p < 0.001), and upper inner ring (p < 0.001), the amblyopic eyes were lower than the non-amblyopic eyes (Figs. 1, 2 and Table 4).
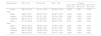
Nine-zone comparison of macular outer retinal thickness in amblyopic eyes, normal eyes and non-amblyopic eyes.
AE, amblyopia eyes; NE, non-amblyopia eyes; CE, control eyes.
The choroidal thickness in amblyopic eyes was greater than in control eyes in the central region, inner ring (nasal, superior, temporal, inferior), and outer ring (nasal, superior), but there was no significant difference on the temporal side (p = 0.127) and inferior side (p = 0.170) of the outer ring. In non-amblyopic eyes compared to controls, there was no significant difference in choroidal thickness in the central region, inner ring (nasal, superior, temporal, inferior), or any partitions of the outer ring (nasal, superior, temporal, inferior). When comparing amblyopic eyes to contralateral non-amblyopic eyes, the choroidal thickness was higher on the inner ring nasal side (p = 0.046) and outer ring nasal side (p = 0.013) in amblyopic eyes, but there was no significant difference in the central zone, inner ring (superior, temporal, inferior), or outer ring (superior, temporal, inferior) between the two groups (Figs. 1-3 and Table 5).
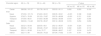
Comparison of choroidal thickness in macular area of amblyopic eyes, normal eyes and non-amblyopic eyes in nine regions.
AE, amblyopia eyes; NE, non-amblyopia eyes; CE, control eyes.
There were no significant differences in whole-layer retinal perfusion density among the three groups across the central, inner nasal, superior, temporal, inferior, and outer nasal, superior, temporal, and inferior regions. Similarly, SCP perfusion density did not significantly differ among the groups in the central, inner nasal, superior, temporal, inferior, and outer nasal, superior, temporal, and inferior areas. Additionally, DCP perfusion density showed no significant differences between the groups in the central, inner nasal, superior, temporal, inferior, and outer nasal, superior, temporal, and inferior regions.
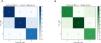
Machine learning classificationMachine learning classification performance was evaluated using logistic regression and random forest models to distinguish amblyopic, non-amblyopic, and healthy eyes based on retinal and choroidal thickness data. Logistic regression achieved an overall classification accuracy of 92%, with a confusion matrix showing 100% true positive rate for healthy eyes and amblyopic eyes, while non-amblyopic eyes were classified with an 80% true positive rate, albeit with some misclassifications. Cross-validation accuracy ranged from 55.56% to 89.47%, with a mean accuracy of 77%, reflecting moderate variability across data splits. The random forest model similarly achieved an overall accuracy of 92%, with an improved true positive rate of 90% for non-amblyopic eyes, alongside 88% for healthy eyes and 100% for amblyopic eyes. Feature importance analysis highlighted retinal outer temporal, outer inferior, and outer superior thickness as the most significant contributors to classification, emphasizing the relevance of outer retinal thickness in differentiating amblyopic from non-amblyopic eyes. (Fig. 4, S1, Table 6)

Performance metrics of logistic regression and random forest models.
| Model | Group | Precision | Recall | F1-score | Support |
|---|---|---|---|---|---|
| Logistic regression | 1 | 0.889 | 1 | 0.941 | 8 |
| 2 | 1 | 0.8 | 0.889 | 10 | |
| 3 | 0.857 | 1 | 0.923 | 6 | |
| Random forest | 1 | 0.875 | 0.875 | 0.875 | 8 |
| 2 | 1 | 0.9 | 0.947 | 10 | |
| 3 | 0.857 | 1 | 0.923 | 6 |
Models for classifying AE, CE, and NE groups, including pecision, recall, F1-score, and support for each group.
AE, amblyopia eyes; NE, non-amblyopia eyes; CE, control eyes.
Currently, relevant studies have confirmed the reliability and reproducibility of the OCTA technique,12–15 offering valuable insights into retinal structural alterations in amblyopic patients for clinical applications.16 To date, however, limited data exist on how retinal alterations evolve during the clinical course of amblyopia. The prevalence of amblyopia in China is 1–3%,17 and studies have shown that about 50% of it is caused by refractive error. Although routine ophthalmic examinations in amblyopia often reveal no abnormalities, current evidence regarding retinal thickness changes remains controversial. Retinal thickness alterations in amblyopic eyes demonstrate type-specific patterns, with the most significant structural changes observed in strabismic amblyopia and hyperopic anisometropic amblyopia. Age and refractive status (e.g., myopia/hyperopia) serve as critical modulating factors in these morphological variations.18 However, variations in methodologies have led to conflicting findings in the literature, particularly regarding older adolescents. This study addresses a critical research gap by analyzing retinal thickness across nine macular subdivisions in older adolescents with amblyopia using OCTA. Importantly, we integrated machine learning techniques to enhance the classification of amblyopic, non-amblyopic, and healthy eyes. This novel approach not only provides new insights into the structural heterogeneity of the retina but also demonstrates the potential for machine learning to supplement traditional statistical methods in clinical research.
Our current study revealed a significant increase in retinal thickness in the amblyopic eyes of older adolescents (11–17 years old) with refractive amblyopia. These findings align with Kavitha et al. (2019), who reported increased macular and central concavity thickness in amblyopic eyes among patients aged 5–18 years.19 However, our study also employed machine learning techniques, specifically a logistic regression model, to classify amblyopic, non-amblyopic, and healthy eyes. The logistic regression model achieved 92% accuracy, demonstrating its ability to effectively classify amblyopic, non-amblyopic, and healthy eyes. This confirms the potential of machine learning in differentiating between amblyopic and healthy eyes based on retinal and choroidal thickness parameters, providing a new dimension to the analysis of OCTA data. In addition to logistic regression, the random forest model achieved comparable accuracy of 92%. Feature importance analysis identified the outer retinal layers, particularly the temporal and inferior regions, as critical predictors for amblyopia classification. These findings underscore the potential of machine learning to highlight key structural biomarkers.
As for choroidal thickness (ChT) in amblyopic patients, most studies support the idea that ChT is thicker in amblyopic children than in non-amblyopic patients. Hansen et al. found that after correcting for axial length, ChT under the macular center was still thicker in amblyopic eyes than in non-amblyopic control eyes.20 Liu et al.21 suggested that the increased choroidal thickness in amblyopia may be to supply additional blood to a thicker retina. Our machine learning model further reinforced this finding, demonstrating that regions of increased choroidal thickness were strongly predictive of amblyopia. By including choroidal thickness as a feature in our model, we were able to improve classification performance, highlighting its importance as a marker of amblyopia. Regions with increased choroidal thickness were strongly predictive of amblyopia in the random forest model, further supporting its role as a potential diagnostic marker.
Although no significant differences in SCP and DCP perfusion densities were observed, a decreasing trend in amblyopic eyes suggests the need for further investigation in larger cohorts.
Despite its promising findings, this study has limitations. First, the small sample size may have affected the generalizability of our findings, particularly regarding retinal blood perfusion. Second, individual eye axial length was not accounted for when analyzing OCTA images, which may have introduced magnification errors. Lastly, the study’s cross-sectional design restricts the ability to assess dynamic changes in retinal and choroidal structures over time. Future research should prioritize multi-center studies with larger cohorts, incorporate axial length measurements, and include longitudinal follow-up to better understand the progression and potential reversibility of structural changes in amblyopia.
In conclusion, our findings suggest that machine learning techniques, when combined with OCTA-based retinal and choroidal structural data, hold promise for enhancing the classification and understanding of amblyopia. While these results underscore the potential of automated diagnostic tools in clinical practice, further studies are needed to validate these findings across larger, more diverse cohorts. Additionally, exploring whether machine learning-identified structural changes could guide targeted interventions may provide new avenues for personalized amblyopia management.
Supplementary material 1. Feature importance ranking derived from the Random Forest model for distinguishing AE, CE, and NE groups. The top features include retinal and choroidal thickness in various regions. AE amblyopia eyes, NE Non-amblyopia eyes, CE control eyes.
CRediT authorship contribution statementXinlong Liu: Investigation, Methodology, Writing – original draft, Writing – review & editing. Caihong Xue: Investigation, Methodology. Mengdi Li: Investigation, Data curation. Yatu Guo: Project administration, Supervision, Writing – review & editing. Wei Zhang: Resources, Funding acquisition, Supervision.
The authors have no conflicts of interest to declare.
1. Tianjin Metrology Science and Technology Project (2024TJMT007; No. 2024TJMT032)
2. Tianjin Health Research Project (No. TJWJ2021MS042)
3. Open Fund of the Vision Science Research Institute, Nankai University (NKSGY202301)
4. The 3rd Tianjin Talent Development Program and the High-level Talents Program in TJHS;
5. Tianjin key Medical Specialty Construction Project, Tianjin Key Medical Discipine (Specialty) Construction Project (No.TJYXZDXK-016A).


