


Digital or computerised eye charts are becoming standard in the examination of visual acuity. Each instrument allows the selection of different optotypes, presentation modalities, and crowding. The aim of this study was to examine the differences in visual acuity (VA) measurement using a digital eye chart, comparing different optotypes and procedures, together with an evaluation of the repeatability of the measurement.
MethodsTwo groups of 52 participants aged between 18 and 31 years participated in the study. In the first experiment, VA thresholds were measured using LEA Symbols, Tumbling E, and Landolt Rings in monocular and binocular conditions using single line presentation and QUEST presentation. In the second experiment, we have compared all modalities of presentation together with a paper eye-chart and test the repeatability.
ResultsThe results showed that thresholds for LEA Symbols are low. The modality of presentation affects these thresholds. For Landolt Rings and Tumbling E, the QUEST procedure gave significantly better thresholds than line presentation, while this difference was absent for LEA Symbols. In comparing all modalities of presentation, single letter and line presentation showed similar values, slightly better than block presentation. Paper eye-charts showed better values of VA. Repeatability and agreement were good for all presentations, but best for QUEST.
ConclusionsThe QUEST modality of presentation provides a better threshold than line presentation except for LEA Symbols. Examiners using digital eye charts must take into account that not all modalities of presentation and optotypes are equivalent and give different VA thresholds. Specific thresholds need to be used for each optotype and presentation modality.
Visual acuity (VA) expresses the level of ability with respect to the spatial resolution of the visual system, and it is the first test in the analysis of the visual function.1 A number of techniques are used to measure visual acuity using different instruments, charts, and methods.2,3 Depending on the age of the subject, various optotypes (i.e., the symbols used in the assessment) are available for measuring visual acuity, each one having specific characteristics. In its evidence-based clinical practice guidelines, the American Optometric Association suggests the use of letter charts (Snellen or ETDRS) with adults and symbol charts (e.g. LEA Symbols) or small sets of letters (HOTV) with preschool children.4,5 In recording data, the letter-by-letter scoring method is preferred because it takes into account each symbol and provides a precise evaluation of VA.1,2
During vision screening aimed at detecting amblyopia, refractive errors and other conditions, it is necessary to use acuity charts with standardized optotypes and methods.6–9 The selection of the most appropriate VA charts depends on the age of the participant. Special care must be taken with toddlers and preschool children.4 The use of symbols optotypes (e.g., LEA Symbols) and small sets of letters (e.g., HOTV) are considered to be best practices for visual acuity testing of children between 3 and 6 years old.5,10 However, despite this, different optotypes and charts/cards may be used for preschool children, such as Kay Pictures,11 Cambridge crowded cards,12 Glasgow acuity charts13 and Patti-Pics.14 With school children, a full logMAR chart with different optotypes can be used.15–17
Oriented optotypes, such as Tumbling E, can be used with preschool children18 but this optotype requires left-right comprehension.19 This involves a complex mental process, especially at ages between 3 and 4 years.20 A printed card that a child can rotate, 21 or the use of a three-option forced-choice task (i.e., Up, Down, Left/Right), without the problem of left-right orientation, represent possible solutions.22
LEA Symbols are a valid alternative to the tumbling E.19 These symbols were created to improve the testability of preschool children (3–5 years old) who are not always sufficiently familiar with letters or directional symbols. They can answer by naming a picture or pointing to a symbol on a response card. The optotypes are four simple figures; square and circle and their derived apple and house. The design of the test is such that each symbol has a similar threshold for VA, and, consequently, this chart meets the criteria for a good VA test. It should be noted that the size of each symbol was slightly modified to meet these criteria.19
Digital or computerised eye charts are becoming standard in vision examinations. With digital eye charts, it is possible to modify each parameter in the presentation of optotypes such as contrast, time of presentation, presentation modalities, the spacing between targets (i.e., to control the crowding phenomena), and obviously, optotypes. Using the advantage of the random presentation of optotypes, memorization problems are abolished even for a single level of VA. With these instruments and specific procedure, simple, accurate and repeatable measurements can also be made easily with low expertise in VA measurement possessed by the examiner.1
In fact, a simple way of achieving an increased standardization of the measurement is to use digital eye charts based on algorithms that eliminate the examiner's involvement from the interpretation of the subject’s answers and the scoring of the results. It also allows a precise comparison of the results measured by different professionals.23 Furthermore, computerized VA systems can reduce the test-retest variability through repeated measurements. In this way, it is simple to detect real clinical changes in individual subjects.24 The automated scoring method does not allow the examiner to make mistakes or misunderstand the answers.25
Digital eye charts allow a QUEST function to be used, which is a psychometric procedure that defines the relationship between physical stimuli, in this case, optotypes dimensions, and the probability of a psychophysical response.26 This method identifies the most probable VA threshold value by using an adaptive process. The size of the stimulus in the next trial is determined on the basis of the subject’s answer in the previous trials.27
Different digital eye charts present different characteristics in the possible modalities of presentation, crowding, and flanker used. For these reasons, the various digital eye charts could present different results even for the same instrument. The aims of this study are to use a digital eye chart: (i) to examine the differences in VA measurement using different optotypes (i.e. LEA Symbols, Landolt Rings and Tumbling E); (ii) to compare different procedures (i.e., single presentation, line, block and QUEST); (iii) to assess the validity and repeatability of the measurement. In order to avoid response factors present in the testing of children,28 only adults were tested.
Materials and methodsExperiment 1SubjectsA group of 52 adults participated in the first experiment. The age (mean ± SD) was 24 ± 3 years, from 18 to 30 years old. There were 22 male and 30 female participants. Each participant was asked to wear his/her own usual refractive correction during the evaluation (13 wore glasses; 5 wore contact lenses, and 34 required no correction). The single exclusion criterion was the presence of any ocular disease that was reported by a subject. None of the participants reported any eye disease. The study was carried out in accordance with the guidelines given in the Declaration of Helsinki and participants gave their written consent to participate in the study.
TestVisual acuity was tested at 5 m distance with a digital eye chart (CSO – Vision Chart, v 1.3.0). This instrument used was a PC-based digital eye chart with a screen with a resolution of 1280 × 1024, which has a VA standard presentation optotypes range from 1.30 to -0.3 LogMAR. Optotypes were presented in black on a white background and had a luminance of 2.6 and 135 cd m−2, respectively. The contrast was set at the maximum level of 500:1. Three different optotypes, Landolt Rings, Tumbling E, and LEA Symbols, were presented in two modalities: single line presentation and QUEST. Both modalities presented optotypes with logarithmic size scaling. Single line presentation was used in the digital eye chart because it represents a simple form, and it is readily accepted by the observer for its simplicity of reading. The sequence of presentation of each optotype used was random. Five random optotypes were presented spaced by the same size of each symbol (100% spacing as referred to other charts15). Spacing was proportional to the letter size.
The QUEST presentation used the same optotypes viewed above, in which the size of the single target was changed actively on the basis of the response (correct or not) of the previous trial. QUEST presentation was unflanked by other optotypes.
ProcedureTesting was performed in an optometry laboratory of the University of Turin, with a uniform illuminance of approximately 350 lux. Monocular (right and left eye) and binocular visual acuity were measured in that order. The first modality of presentation was by a single line. A single row of five targets (four possible options to choose from) was presented, and the participants were required to identify the different optotypes presented. Participants were encouraged to guess, and the first response was recorded (no self-correction as QUEST mode). The scoring procedure was the letter by letter visual acuity.1,15 The value corresponding to the line in which the participant correctly read at least 3 out of 5 targets was recorded. The number of symbols recognized and verbally reported (i.e., 3/5, 4/5 or 5/5) was then recorded plus the number of letters read at the subsequent smallest size (up to two).1,15 The final value of the VA takes into account all the letters read correctly. The second modality of presentation was the QUEST, which presented a series of targets of variable size, which was determined by the correct or incorrect responses given by the participant. We took the threshold VA reported by the software as the VA value. All values were recorded on a logMAR scale. The modality of presentation was balanced across participants. The participants were divided equally according to the order in which the three different optotypes were presented.
ResultsDescriptive results are reported in Table 1.
Mean ± SD values of VA obtained by different optotypes, eye tested and procedure of testing for experiment 1.
| Right eye | Left eye | Binocular | ||
|---|---|---|---|---|
| Single line presentation | Landolt Rings | −0.005 ± 0.086 | −0.004 ± 0.098 | −0.079 ± 0.104 |
| Tumbling E | −0.007 ± 0.082 | −0.017 ± 0.079 | −0.089 ± 0.075 | |
| LEA Symbols | 0.069 ± 0.096 | 0.067 ± 0.093 | −0.018 ± 0.076 | |
| QUEST mode | Landolt Rings | −0.034 ± 0.145 | −0.056 ± 0.115 | −0.135 ± 0.090 |
| Tumbling E | −0.040 ± 0.095 | −0.049 ± 0.091 | −0.124 ± 0.093 | |
| LEA Symbols | 0.090 ± 0.118 | 0.088 ± 0.119 | −0.007 ± 0.103 |
A 2 × 3×3 repeated measure ANOVA was performed to compare all the VA values. The factors applied in the ANOVA were Method with two levels (Line and QUEST), Optotype with three levels (Landolt Rings, Tumbling E and LEA Symbols), and Eye with three levels, Right eye, Left eye, and Binocular. The results showed a significant main effect of Method (F(1,51) = 13.62, p < 0.0005, η2p = 0.21), a significant main effect of Optotype (F(2,102) = 216.11, p < 0.0001, η2p = 0.81) and a main effect of Eye (F(2,102) = 105.98, p < 0.0001, η2p = 0.68). Significant second-order interactions are only Method × Optotype (F(2,102) = 24.76, p < 0.0001, η2p = 0.33). No other interactions were significant. The results are shown in Figs. 1 and 2.

 and optotype (Landolt Rings, Tumbling E and LEA Symbols). Bars represent +/- 1 SEM.")
Since in the ANOVA, the factor Eye was significant only as the main factor, we have compared the single mean values using the Post-Hoc Bonferroni test. The results show a significant difference between the right eye and Binocular (p < 0.0001), between the left eye and Binocular (p < 0.0001), but no significant difference between left and right eye. The overall improvement between monocular and binocular VA is 0.084 logMAR (i.e., about four letters; Fig. 1).
In order to illustrate the difference between optotypes better, post-hoc analyses with Bonferroni correction show that there is not a significant difference between Landolt Rings and Tumbling E. However, there are differences between Landolt Rings and LEA Symbols and between E and LEA Symbols (both p < 0.0001), which corresponds to 0.101 logMAR (about 5 letters). In comparing the second-order interaction, Method × Optotype, there are significant differences between Line and QUEST for Landolt Rings (p < 0.0001), and for Tumbling E (p < 0.0001), but not for LEA Symbols (p = 0.11). The mean difference for Landolt Rings and Tumbling E between Line and QUEST was 0.040 logMAR (i.e., two letters).
DiscussionIn this first experiment, we examine the differences in VA measurement using different optotypes (i.e., LEA Symbols, Landolt Rings and Tumbling E) and procedures (i.e., line and QUEST) with a digital eye chart.
Regarding the thresholds for the left and right eyes, as expected, we found that the overall binocular VA was significantly better than monocular, in the order of about 0.08 logMAR (i.e., four letters).
In comparing method, we found that the QUEST presentation for Landolt Rings and Tumbling E optotypes show better values of VA compared to the single-line presentation. This difference does not appear for LEA Symbols optotypes. In comparing QUEST and line for Landolt Rings and Tumbling E, the QUEST thresholds are better than line, and the difference could simply be caused by the different crowding conditions between the two modalities of presentation. This last point illustrates perfectly the difference in the crowding of the two conditions. While the line presentation is partially crowded on two sides (except for the first and last symbol), QUEST is totally uncrowded and consequently, a better threshold value was found. With LEA Symbols, this difference did not occur, probably due to the nature of the optotypes itself (i.e., line thickness and specific drawings).19
In comparing optotypes, we found that Landolt Rings and Tumbling E give the same thresholds. Conversely, we also replicated with a digital eye chart the result that LEA Symbols show worse thresholds giving inferior VA of about 0.1 logMAR, which was equivalent to 5 letters or one line. This result confirms a previous comparison that used standard eye charts.28 It is essential to underline that this difference of 0.1 logMAR was obtained by directly comparing the optotypes using the same modality of presentation and crowding. Different eye charts, with different flankers or spacing (crowding), could give different results.3,29–31 The difference in VA due to the presence of flankers could only be tested directly by comparing several modalities of presentation. Moreover, in order to test stability as a function of time, the repeatability of the measurement should be analysed. These issues have been addressed in experiment 2.
Experiment 2In the second experiment, the aim was to compare the different presentation modality of the digital eye chart with a classic paper eye chart and their test-retest repeatability.
Materials and methodsSubjectsA second sample of 52 adults (independent from the first) participated in this study. The age (mean ± SD) was 23 ± 2 years, with a range from 20 to 31 years old. There were 17 male and 35 female participants. Inclusion and exclusion criteria were the same as those described above for experiment 1. Participants wore their habitual correction (22 wore glasses; 6 wore contact lenses and 24 required no correction).
TestsVisual acuity was measured with two instruments. At a distance of 5 m, VA was tested with a digital eye chart (CSO – Vision Chart, v 1.3.0) as reported above for experiment 1. Randomly-selected SLOAN letters (C, D, H, K, N, O, R, S, V, and Z) were presented in four different modalities: single letter, single line, a block of letters (similar to LogMAR chart) and QUEST. The block of letters consist in a presentation of three lines of different size of five optotypes identical to a logMAR charts. Participants have to read the central row. The SLOAN letters were used for a direct comparison with a paper eye chart. In the case of single letter modality, a multiple of 5 random presentations were used. All other parameters were identical to experiment 1. Visual acuity was also tested with Milan Eye Charts15 using only the standard 100% spacing chart (100A). In this case, a distance of 3 m was used, and the same letter-by-letter procedure described above for experiment 1 was applied. The chart has a uniform illuminance of approximately 350 lux.
ProcedureSince the aim of this second experiment was to compare the different modalities and their repeatability, VA was measured only binocularly. The scoring of VA and all other experimental parameters were the same as those described above for experiment 1. The order of presentation of each modality plus the paper chart was balanced between participants. The retest session for repeatability was performed after one week using the same sequence of presentation.
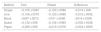
ResultsDescriptive results are reported in Table 2.
Mean ± SD values of VA obtained by different procedure of testing and session for experiment 2.
| Method | Test | Retest | Difference |
|---|---|---|---|
| Single | −0,105 ± 0087 | −0,120 ± 0086 | −0,014 ± 006 |
| Line | −0,108 ± 0075 | −0,120 ± 0088 | −0,012 ± 0042 |
| Block | −0087 ± 0072 | −0101 ± 0096 | −0014 ± 0056 |
| Quest | −0,132 ± 008 | −0,134 ± 0085 | −0,002 ± 0038 |
| Paper | −0,206 ± 008 | −0,210 ± 0078 | −0,004 ± 0055 |
Firstly, a 2 × 5 repeated measure ANOVA was performed to compare all VA values. The factors applied in the ANOVA were Session with two levels (first and second), and method with five levels (single, line, block, QUEST, and paper). The results showed a significant main effect of Session (F(1,51) = 4.19, p < 0.05, η2p = 0.08), Method (F(1,51) = 72.21, p < 0.0001, η2p = 0.59) and no significant interactions were found. In order to examine the difference between methods of presentation in the best way, a repeated measure ANOVA was performed only using the first session of administration. Results were significant (F(4,204) = 66.71, p < 0.0001, η2p = 0.57). Post-hoc comparisons with Bonferroni correction show significant differences between QUEST and block (p < 0.05) and between paper and all the other four modalities (all ps<0.0001). The paper presentation shows the best values of VA. The mean difference between Line and Quest presentation was 0.024; this difference between Line and Quest presentation was significantly lower [t(102) = 6.4, p < 0.0001] compared to experiment one, but in the same direction. The results are shown in Fig. 3.
 and Session (first and second). Bars represent +/- 1 SEM.")
Regarding the repeatability, the first analysis took into account the direct mean comparisons of each modality of presentation between sessions. Even in the previous ANOVA Session was significant; direct comparison with paired t-test (without correction for multiple comparisons) showed a significant result only for line presentation (t(51) = 2.12, p < 0.05). In contrast, all other comparisons between sessions did not show significant differences. Repeatability of measurement also needs to be analysed with correlation and Bland and Altman limits of agreement (LoA). Correlation of each VA method of presentation was performed with the single score ICC [ICC(A,1)].32 The results showed a moderate to high correlation for single, block, and paper modality of presentation, but high correlation for line and QUEST (Table 3).
Results of repeatability of VA for all modalities of presentation. The correlation was the intraclass correlation (ICC); p-values were referred to the significance of correlation; Bias = mean difference between sessions; LoA = limits of agreement.
| Method | Correlation (95 % CI) | p-value | Bias | LoA |
|---|---|---|---|---|
| Single | 0.75 (0.6 to 0.85) | <0.0001 | −0,014 | 0.118 |
| Line | 0.86 (0.77 to 0.92) | <0.0001 | −0,012 | 0.082 |
| Block | 0.78 (0.64 to 0.87) | <0.0001 | −0,014 | 0.109 |
| Quest | 0.90 (0.83 to 0.94) | <0.0001 | −0,002 | 0.074 |
| Paper | 0.76 (0.61 to 0.85) | <0.0001 | −0,004 | 0.107 |
The mean bias between sessions is smaller even than a single letter and the QUEST modality presents the smallest value. The limits of agreement (LoA) were calculated as 1.96*SD of differences. The broader results (single, block, and paper) are in the region of 5–6 letters, and the narrower (line and QUEST) were approximately 4 letters. Graphical representations of these results are shown in Fig. 4.

Bland and Altman limits of agreement representation for test and retest for the five modalities of presentation in experiment 2. Values are in logMAR. The x axis represent the mean of the measurement of the two sessions. The y axis represent the second measurement minus the first measurement. The small dotted line represents the mean bias and the long dotted lines represent the positive and negative LoAs.
The aim of the second experiment was to compare the different procedures (i.e., single presentation, line, block, and QUEST) to a paper eye chart in order to assess the validity and repeatability of the measurement.
The majority of the results show that the effect of crowding, although small, was present in the expected direction. VA was similar for single and line presentation and reduced for a block presentation of approximately a value of one letter. For the different presence of flankers, a larger difference between single and line presentation would be expected. Many participants showed values of VA in the order of -0.3 logMAR; the presentation of this line of optotype in block presentation was not fully flanked because, in the lower part, it was not surrounded by other small optotypes (e.g., -0.4 logMAR). Compared to the line presentation, the QUEST presentation gave a better value of 0.024. This value difference is significantly lower than the one obtained in experiment 1, albeit in the same direction. Different optotypes and participants may explain this difference. However, there is a difference between QUEST and single presentation that did not corroborate the influence of crowding in giving better results for QUEST. The two threshold methods, the full psychophysical QUEST and the simple letter by letter scoring could explain this result. The most unexpected result was obtained in comparing the results for the digital eye chart with those for a paper eye-chart. The latter present VA values are significantly better than all other modalities of presentation.
The repeatability and the agreement of the measurement of VA generally showed good values. Specifically, the mean bias was small in the direction of a minor improvement, on the edge of significance. This was visible only for the overall test-retest comparison (ANOVA) and in a direct comparison to line presentation. However, the size of this effect is small and did not reach the value of a single letter. ICC correlations and LoAs results were generally good and smaller than other studies. Their comparisons only allow differences between modality of presentation to be shown. QUEST presentation presents the high correlation, the small bias, and the small LoAs as a sign of high repeatability and agreement.
General discussionsDigital eye charts are modern instruments that are intended to allow different types of presentations at a distance in vision examinations. However, few studies have taken into account its use and made comparison between various presentation modality and between different optotypes and have assessed the repeatability of the measurement.
Specifically, the aims of this study were to use a digital eye chart: (i) to examine the differences in VA measurement using different optotypes (i.e. LEA Symbols, Landolt Rings and Tumbling E); (ii) to compare different procedures (i.e. single presentation, line, block, and QUEST); (iii) to assess the validity and repeatability of the measurement. The study has produced some interesting findings, and these are discussed below.
Since we are interested in comparing VA between different modalities of presentation, we have used the habitual correction. Consequently, our acuity could be better defined as habitual correction visual acuity (HCVA) and not best-corrected visual acuity (BCVA), and we, therefore, cannot generalize and compare these results. The results of a study that collected BCVA values at various ages have reported values that are slightly better than ours (i.e., when referred to the single line presentation).33
A study aimed at comparing LEA Symbols with Tumbling E on a group of preschool children found comparable VA results. However, the difference between the two charts was statistically significant only in the 3–4 and not in the 5–6 year age group.20 Based on a group of adults between 17 and 31 years old, another study found that LEA Symbols showed mean VA values that were weaker than Tumbling E, with about a value of 0.042 logMAR, which is approximately two symbols.16
In a group of children of 4–9 years of age, the comparison between LEA Symbols and other pediatric tests (i.e., single line or multiple lines surrounded by a black box) with the full logMAR ETDRS chart showed that the ETDRS charts gave worse VA results compared to LEA Symbols (i.e. about 1–2 lines). Since the authors have used different eye-chart layouts, the crowding effect had a crucial role and interacted with different layouts and optotypes.29
Different modalities of crowding affect the VA thresholds. Sailoganathan et al.3 found different results for LEA Symbols surrounded by flanking optotypes or flanking bars.
The crowding phenomenon is an important factor in measuring VA because of the different spacing between optotypes produces different VA values.15 Visual acuity charts, cards, and tests offer several modalities that can be used to control the crowding effect by means of different flankers and spacing.28 As a result, data from different charts are not directly comparable and this should be taken into account when comparing charts.3,16,29
In the first experiment, when comparing optotypes, we found that the LEA symbols show a worse VA of about 1 line. We also found that the QUEST presentation for Landolt Rings and Tumbling E optotypes show better values of VA compared to the single-line presentation using a letter by letter scoring. This result is also confirmed in the second experiment, but with a smaller difference. Comparing single letter, line and block presentation directly, we found that only block presentation shows lower values of VA. Crowding has a great influence when a target is flanked in four directions rather than two.
The unexpected result is the significant difference (0.07 logMAR) between the other formats and the paper charts in the second experiment. The reason that a paper eye-chart shows better results is an interesting question. All instruments were correctly set at the correct distance from the examiner. Contrast does not seem an acceptable explanation because it is greater for the digital optotype than the paper chart. The most realistic explanation seems to be linked to the different distances used for testing. The VA at 5 m (and not at 3 m), can be influenced by a small degree of myopia / pseudo-myopia, and this factor could explain the difference. In fact, one of the limitations of this study is the testing of HCVA and as opposed to BCVA, and consequently, the role of the refractive status is unknown.
Digital eye charts based on different algorithms have been compared with standard charts. Harris et al.25 did not find any significant difference when comparing backlit ETDRS with an automated ETDRS system (A-ETDRS). The A-ETDRS measures VA in two phases: range finding and thresholding. The same two phases are used by the compLOG system. No significant bias was found between the gold standard ETDRS and the compLOG system, the time required for testing being similar.34 The compLOG was also used with Kay Pictures and to compare the printed Kay Pictures chart with compLOG Kay Pictures, resulting in the detection of a small bias. However, the difference was small and not clinically significant.35
The agreement for all modalities of presentation of VA was excellent, with a small mean improvement over time (with a value of half of a symbol). This bias between sessions is aligned with a study that reports little bias 36 but smaller than the previously reported data of about one line.37,38 Compared to previous studies,36–38 which report LoAs of about 0.15−0.18, the LoAs found were smaller (0.07−0.12) with the smallest values for QUEST and line presentation. The high correlation and small LoA is a sign of consistent and stable performance over time. The correlation value has an essential role for its connection to the standard error of measurement, test-retest variability, and, consequently, the smallest visual acuity changes that can be detected.39 However, on comparing the different methods, QUEST shows better results in terms of smaller LoA and bias. Based on the overall results of experiment 2, excluding QUEST, the single line seems to be the better modality of presentation, bearing in mind a difference between this and block presentation of about one letter.
From a psychophysical point of view, the QUEST presentation represents the best modality of letter presentation, preventing the response factor and the influence of the experimenter. However, the line presentation presents an advantage because by using the remote control of the digital eye chart, it is simple to switch from the single letter presentation to reach the threshold zone quickly, and then switch to line presentation in order to measure the threshold precisely using letter-by-letter scoring. This is perfectly consistent with the presentation method used in the A-ETDRS,25 and the FrACT systems.40
The limitations found in the digital optotype used are in the totally un-flanked presentation during QUEST and the lack of line of -0.4 logMAR in the block presentation. We hope that future revision of the software could include the QUEST presentation with flankers (using the same optotype) and another line of optotypes in the block presentation. A limitation of our evaluation is the use of only adult participants. This point could be solved in future studies with children participants to provide clinical information specific for this population.
ConclusionsIn evaluating VA, digital eye charts present different modalities of presentation and optotypes. Clinicians who use digital eye charts have to take into account that not all modalities and optotypes are equivalent and give different VA thresholds. Landolt Rings and Tumbling E present similar thresholds while those of LEA Symbols are worse. The modality of presentation also affects the measurement of VA, which was stable over time. Taken together, these aspects of the measurements become essential in patients that present VA near the cut-off when specific thresholds are required (e.g., driver licensing, specific jobs, etc.). Under these conditions, the differences in the type of presentation and the optotypes used play an important role.
Conflicts of interestThe authors have no conflicts of interest to declare.


